
Earlier today, the National Australia Bank showed that its business confidence index dropped to 8 in August. Additionally, home loans in Australia rose 0.3% in July, missing expectations for a 1.0% increase. Thanks to these disappointing numbers, the Australian dollar declined to a five-week low against its U.S. counterpart, reaching very important support zone. Will it withstand the selling pressure?
In our opinion the following forex trading positions are justified - summary:
- EUR/USD: long (stop-loss order: 1.2846; initial price target: 1.3200)
- GBP/USD: none
- USD/JPY: none
- USD/CAD: short (stop-loss order at 1.1068; initial price target: 1.0812)
- USD/CHF: none
- AUD/USD: long (stop-loss order at 0.9150; initial price target: 0.9382)
EUR/USD
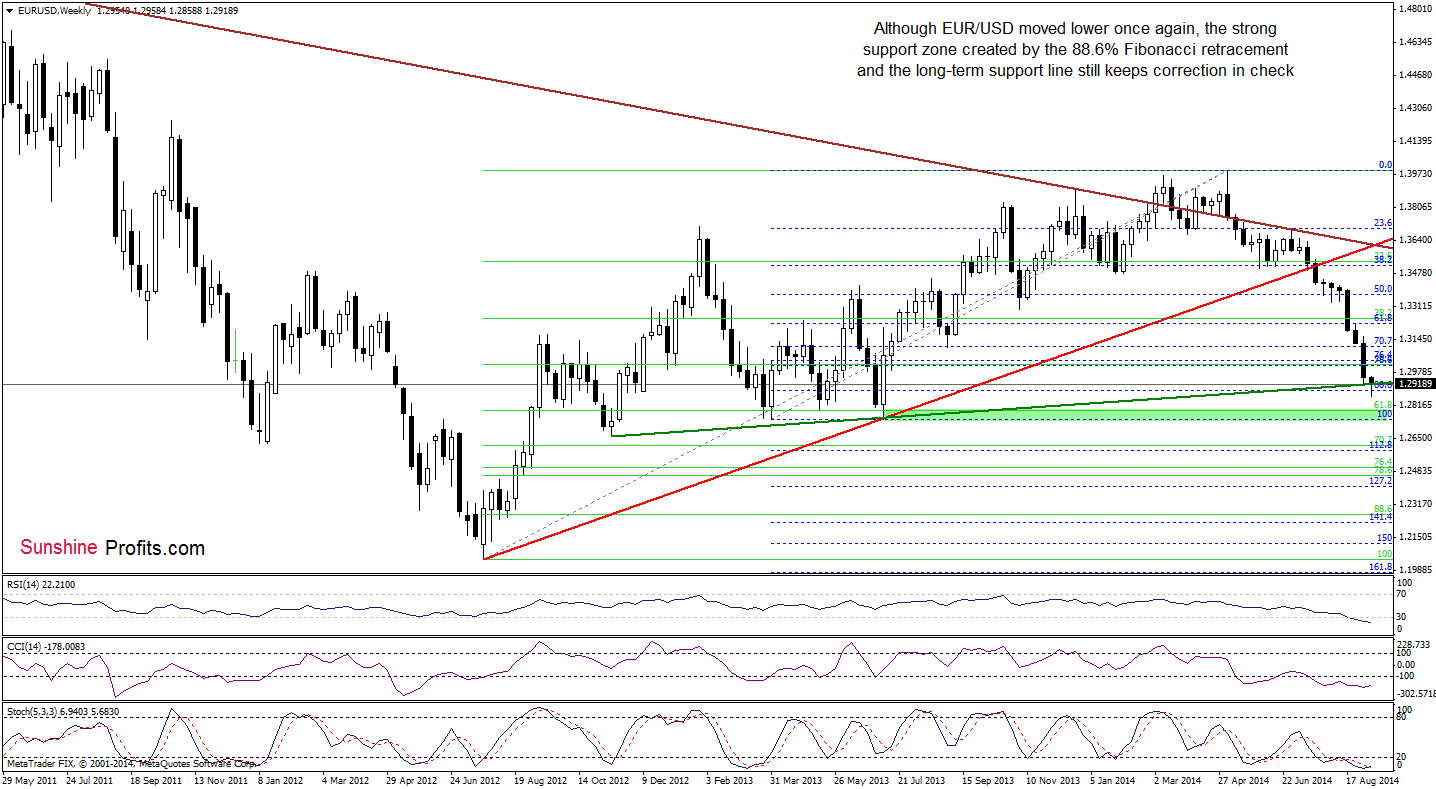
Although EUR/USD extended losses and slipped below the support zone (created by the 88.6% Fibonacci retracement and the long-term green support line based on the Nov 2012 and Jul 2013 lows), the pair rebounded invalidating this small breakdown. In our opinion, this is a bullish sign that could trigger a corrective upswing in the coming week.
Can we find more clues about future moves on the daily chart? Let’s find out.
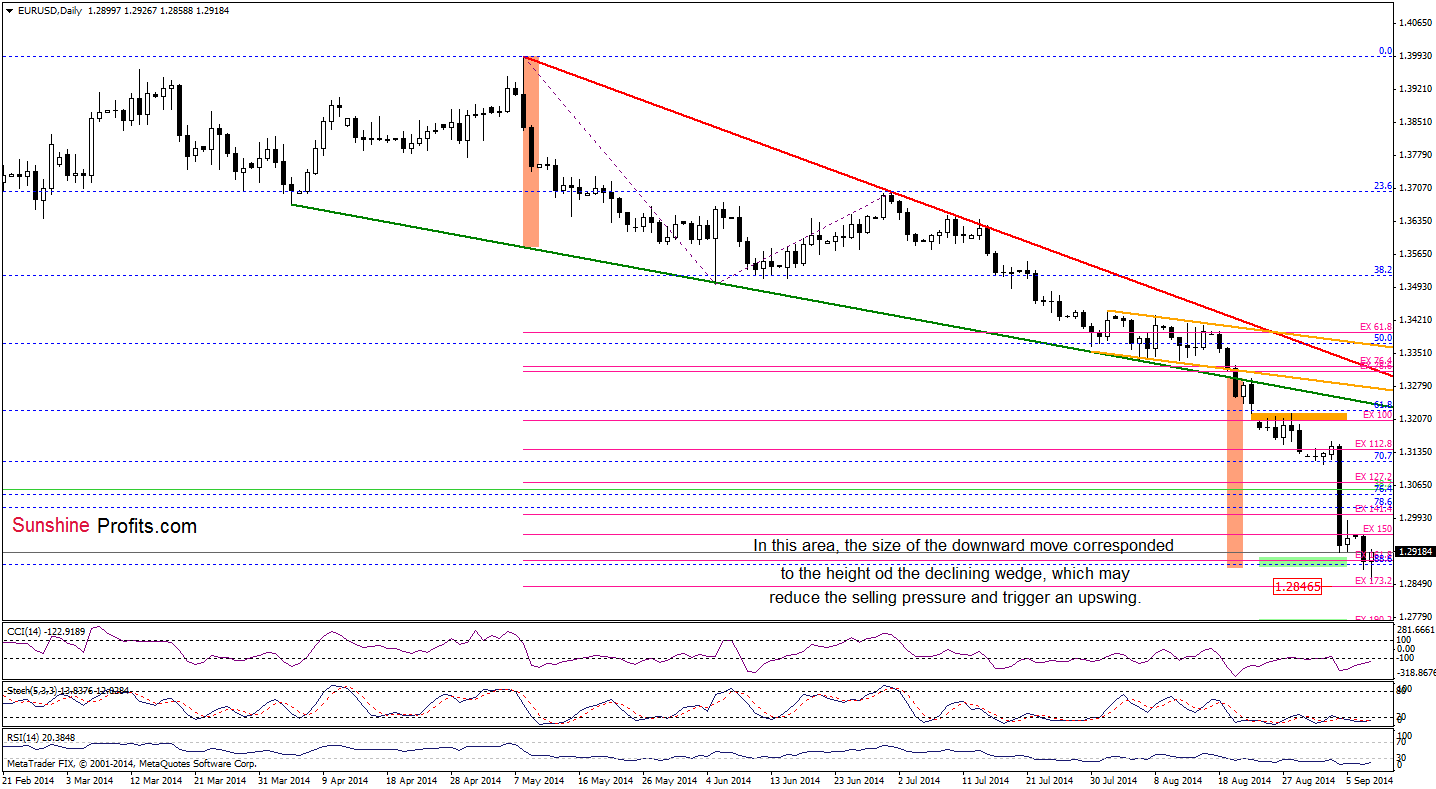
Yesterday, we wrote the following:
(…) EUR/USD is likely to move higher, but not very likely before it moves slightly lower first. This scenario is currently reinforced by the position of all indicators (although they are oversold, there are no buy signals, which could encourage currency bulls to act at the moment).
Looking at the daily chart, we see that currency bears managed to push the pair lower (as we expected) and EUR/USD slipped below the support zone created by the 161.8% Fibonacci price projection and the 88.6% Fibonacci retracement level. Despite this drop, the pair reversed and rebounded as the size of the downswing corresponded to the height of the declining wedge, which reduced the selling pressure. Taking this fact into account and combining it with an invalidation of the breakdown (seen on the weekly chart), it seems to us that the next move will be to the upside. If this is the case, we’ll see further improvement and an increase to the last week’s highs (around 1.3153). In our opinion, this scenario will be even more likely if the indicators generate buy signals in the coming day (or days).
Very short-term outlook: mixed with bullish bias
Short-term outlook: mixed with bullish bias
MT outlook: mixed
LT outlook: bearish
Trading position (short-term): In our opinion opening long positions with a stop-loss order at 1.2846 is justified from the risk/reward perspective. We will keep you informed should anything change, or should we see a confirmation/invalidation of the above.
USD/CAD
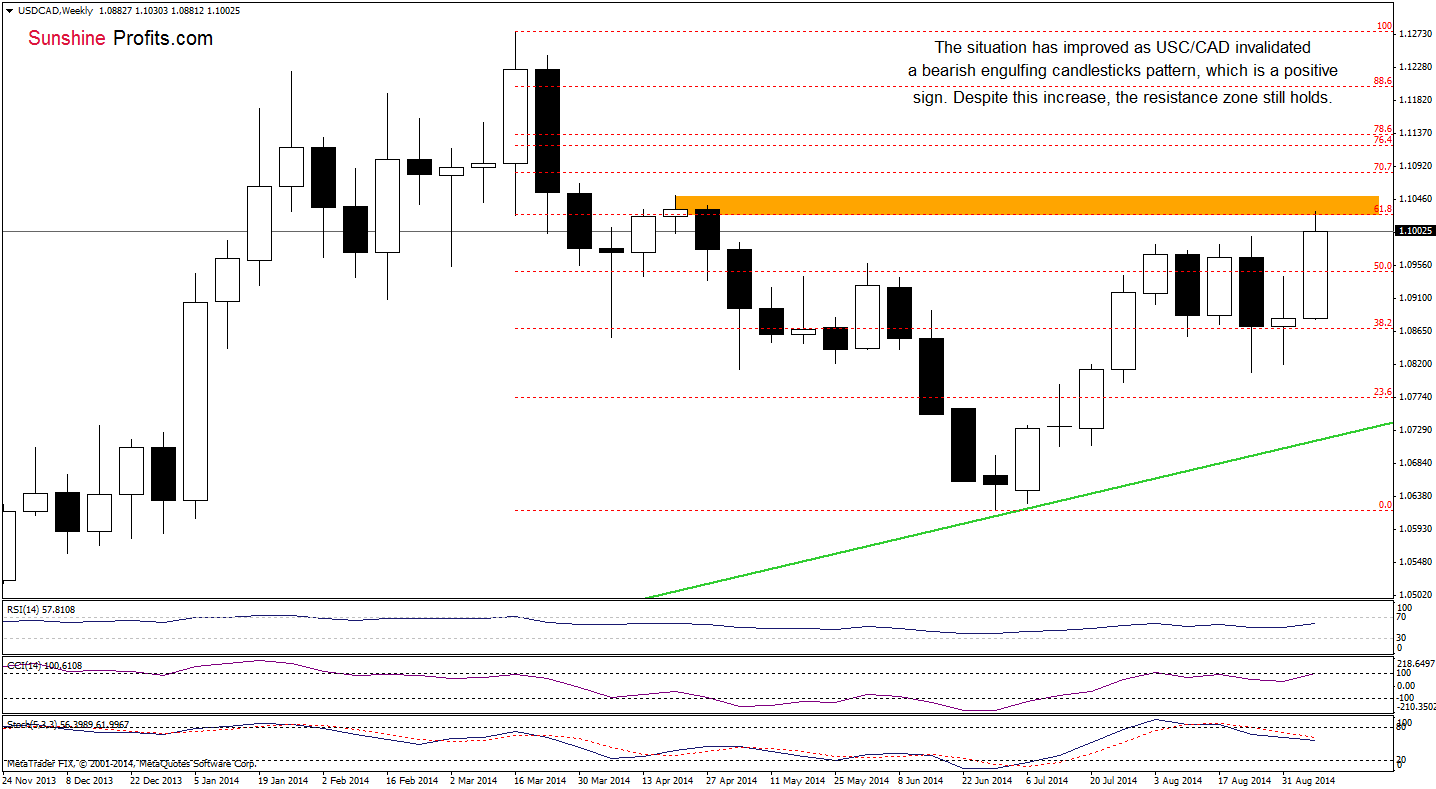
The medium-term outlook has improved significantly as USD/CAD moved higher and broke above the recent highs, invalidating a bearish engulfing candlesticks pattern, which triggered a decline at the end of the previous month. This positive signal encouraged currency bulls to act and resulted in a rally to the 61.8% Fibonacci retracement (based on the entire March-June decline). As you see on the above chart, this resistance level is reinforced by the April highs, which may pause or even stop further improvement and translate to lower values of USD/CAD in the coming week.
Having say that, let’s examine the daily chart.
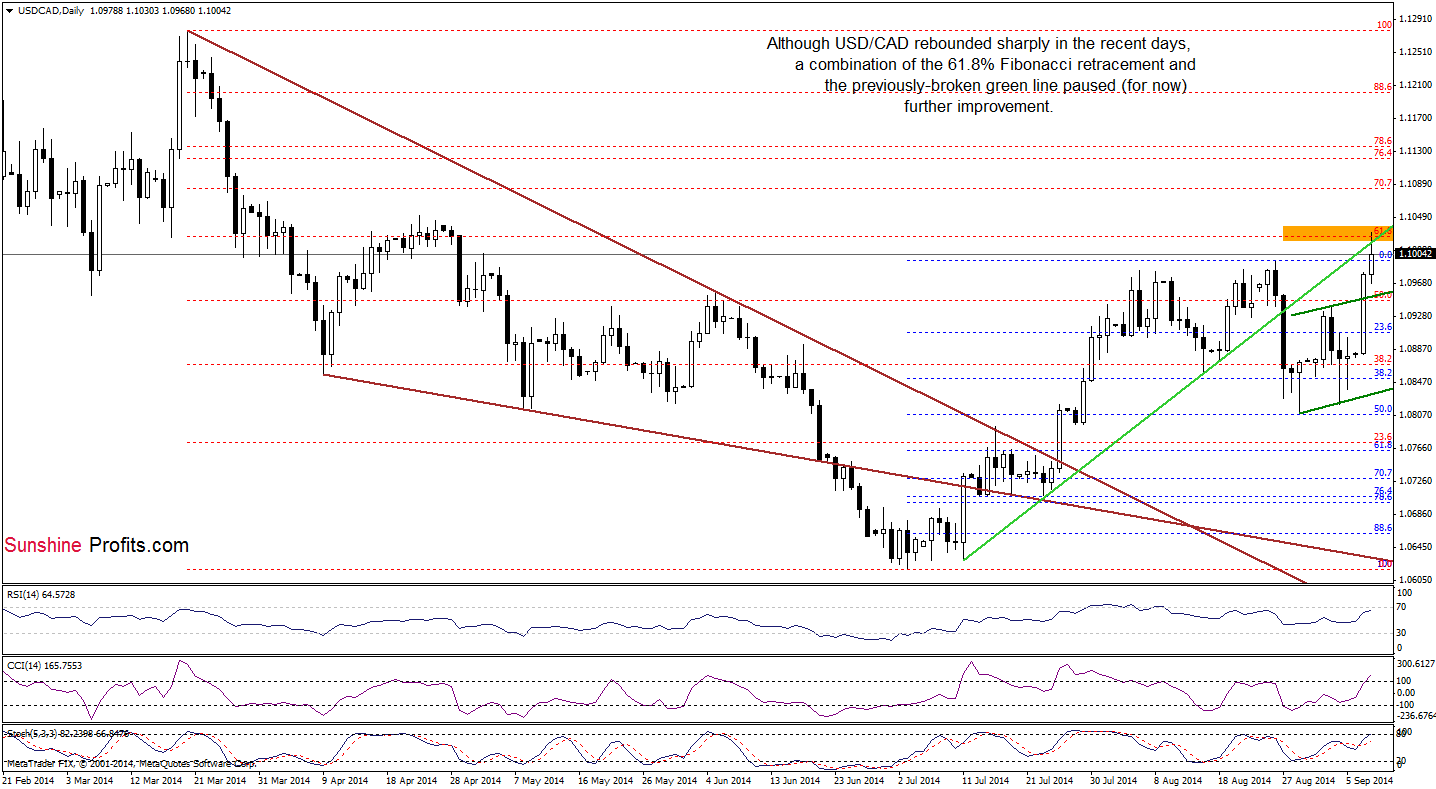
From this perspective, we see that USD/CAD rebounded sharply in the recent days, which resulted in a breakout above the upper line of the small rising trend channel. Despite this positive sign, currency bulls didn’t manage to break above the green support/resistance line, which is currently reinforced by the 61.8% Fibonacci retracement. At this point, it’s worth noting that we saw to unsuccessful attempts to break above this line in the previous week. Back then, they preceded a correction, which suggests that we may see similar price action in the coming days – especially if the indicators generate sell signals. If this is the case, we’ll likely see a comeback to the previously-broken upper line of the small rising trend channel (currently around 1.0948).
Very short-term outlook: mixed with bearish bias
Short-term outlook: mixed
MT outlook: mixed
LT outlook: bearish
Trading position (short-term): In our opinion opening short positions with a stop-loss order at 1.1068 is justified from the risk/reward perspective. We will keep you informed should anything change, or should we see a confirmation/invalidation of the above.
AUD/USD
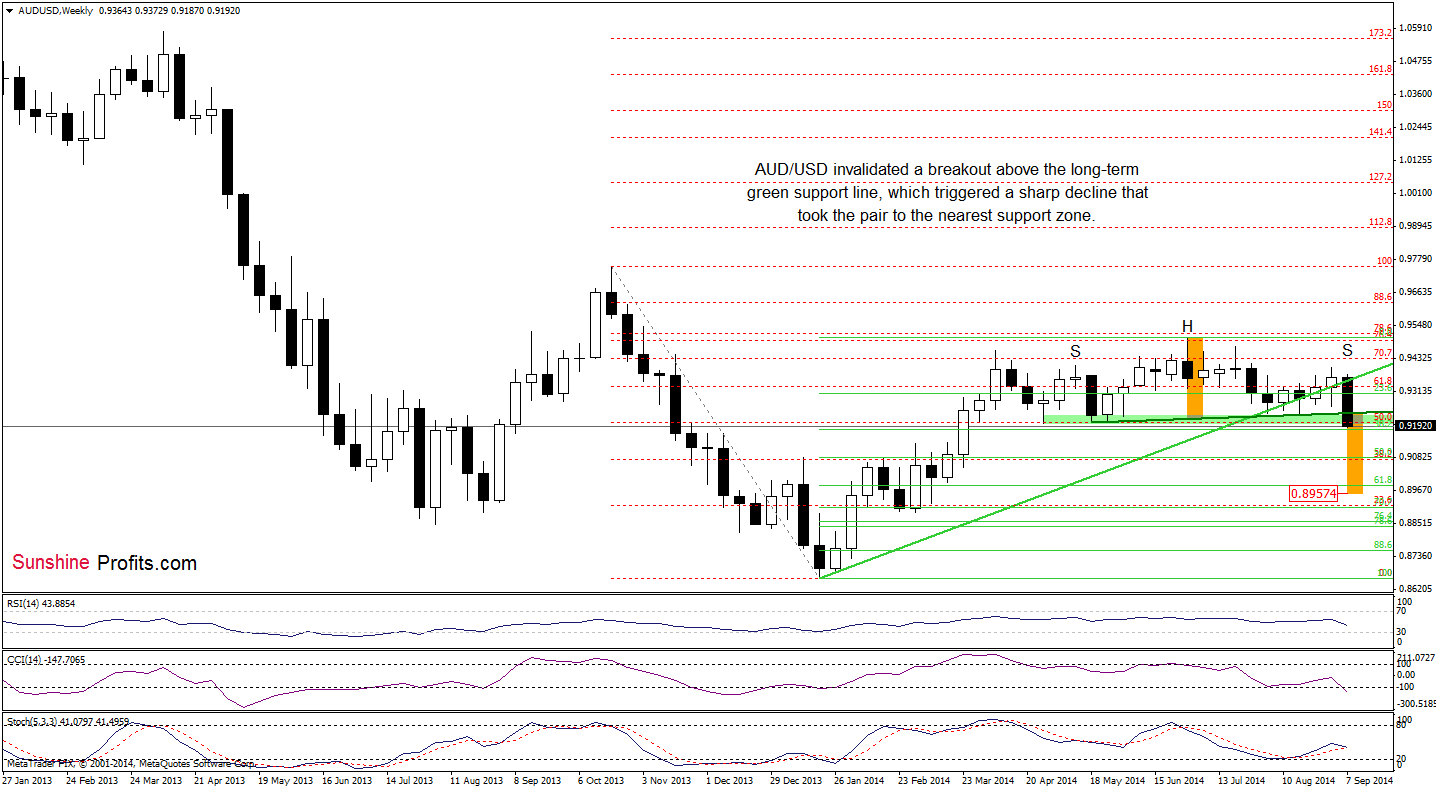
The first thing that catches the eye on the above chart is the head and shoulder top formation. As you see on the weekly chart, AUD/USD declined not only below the long-term green support line, but also slipped under the neck line (marked with dark green), which is a strong bearish signal. Despite these negative circumstances, the pair reached the strong green support zone, which succesfully stopped further deterioration in the prvious month. Will it withstand the selling presure in the coming week?
Let’s examine the daily chart and find out.
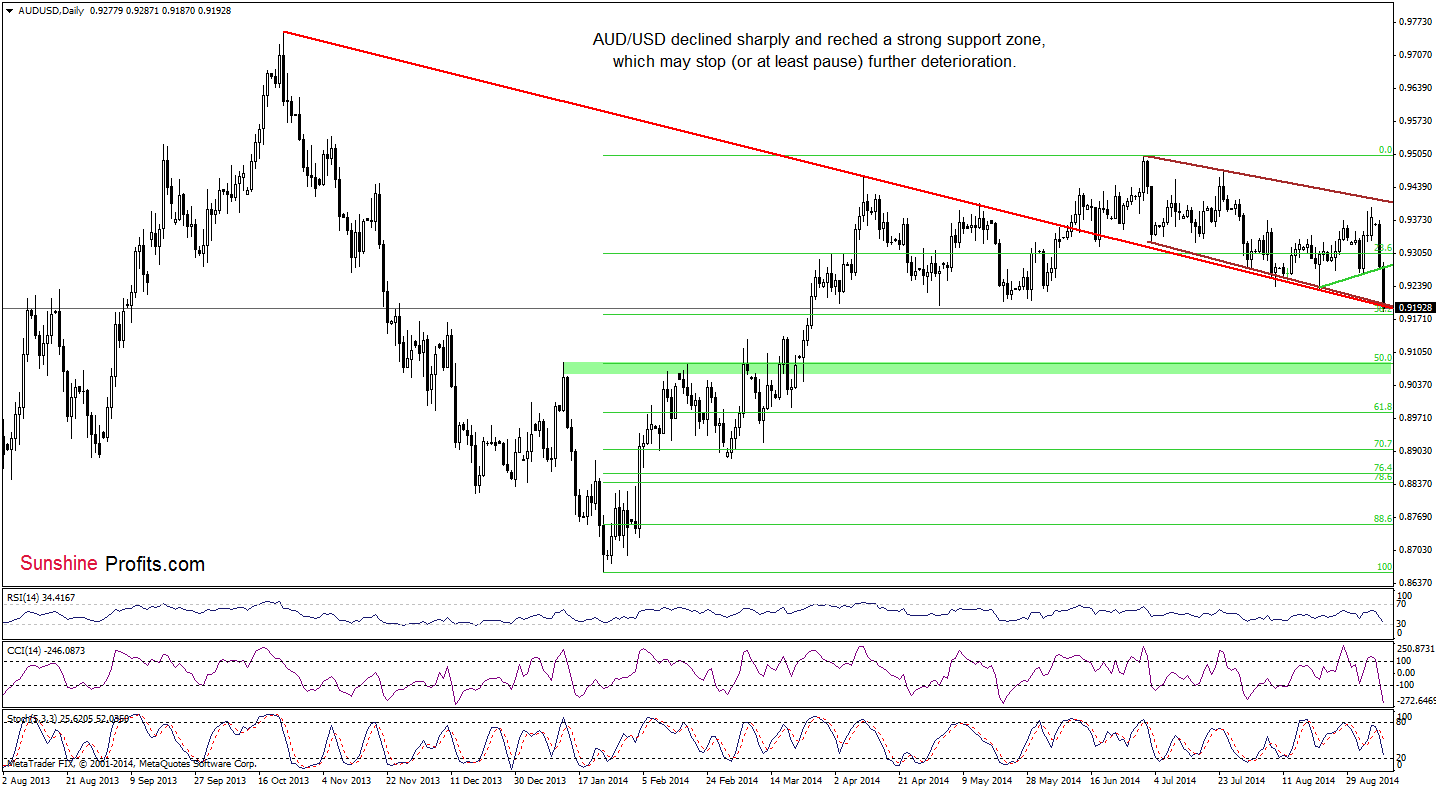
From this perspective, we see that AUD/USD moved lower and dropped below the green support line, which accelerated declines in the recent days. With this downward move, the exchange rate reached two very important support lines: the long-term red line and the lower border of the declining trend channel. As you see on the above chart, they successfully stopped further deterioration several times in the past. Taking this fact into account and combining it with the proximity to the 38.2% Fibonacci retracement based on the entire Jan-Jul rally, it seems to us that this area will be strong enough to trigger a corrective upswing in the following days. If this is the case, we’ll likely see a rebound to the previously-broken green support/resistance line. Nevertheless, when we factor in the medium-term outlook and the current position of the indicators, we should also consider a bearish scenario. What could happen if the pair drops below this strong support zone? We’ll see a drop to (at least) the 50% Fibonacci retracement (at 0.9084) or even to around 0.8957, where the size of the downward move will correspond to the height of the head and shoulders top formation.
Very short-term outlook: mixed with bullish bias
Short-term outlook: mixed
MT outlook: mixed with bearish bias
LT outlook: bearish
Trading position (short-term): In our opinion opening long positions with a stop-loss order at 0.9150 is justified from the risk/reward perspective. We will keep you informed should anything change, or should we see a confirmation/invalidation of the above.
Thank you.
Nadia Simmons
Forex & Oil Trading Strategist
Przemyslaw Radomski, CFA
Founder, Editor-in-chief
Gold & Silver Trading Alerts
Forex Trading Alerts
Oil Investment Updates
Oil Trading Alerts

