
Earlier today, data showed that Japan’s gross domestic product shrank by 7.1% in the second quarter. As a result, the U.S. currency rebounded and approached the last week’s almost six year high against the yen. Will we see further improvement or rather a post double top decline?
In our opinion the following forex trading positions are justified - summary:
EUR/USD
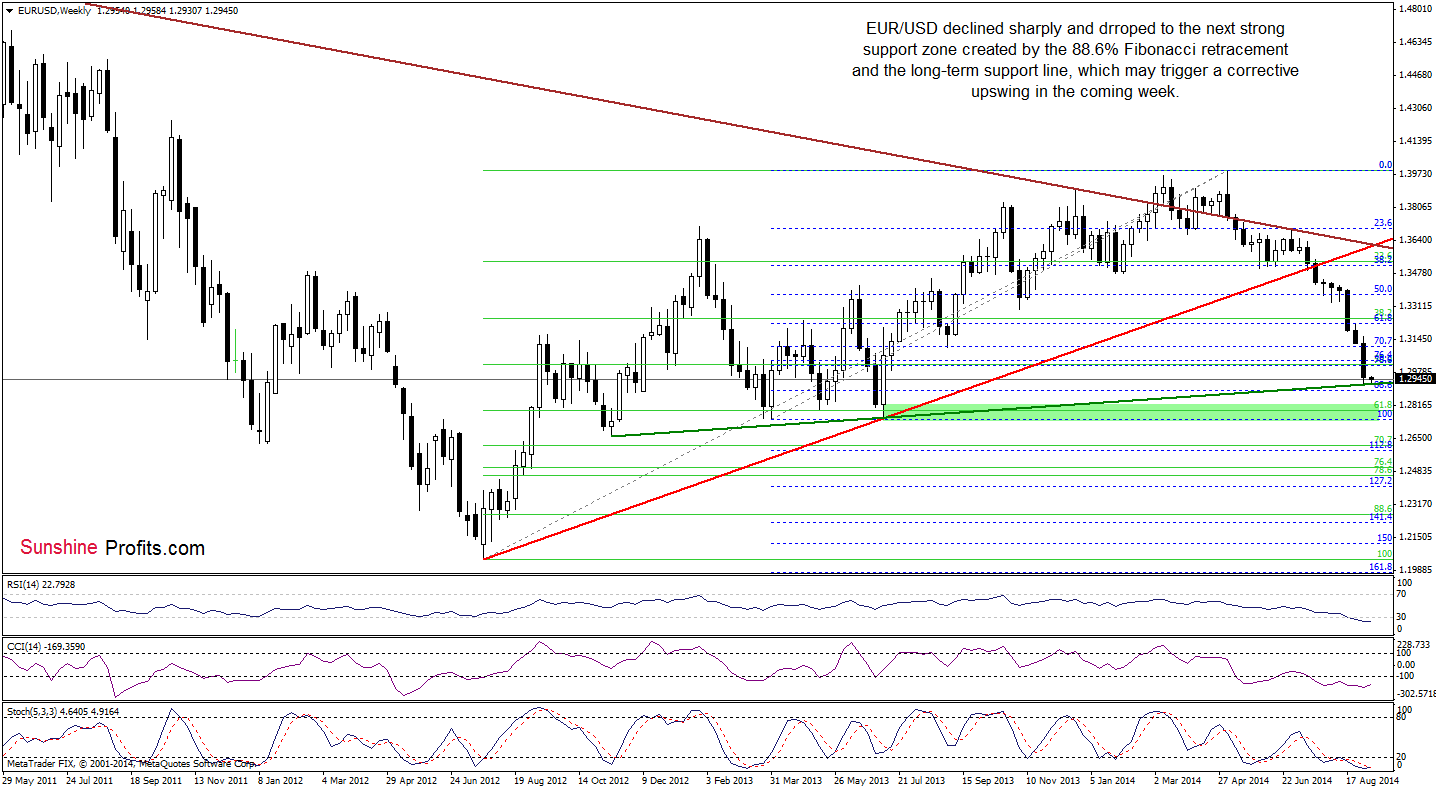
The medium-term picture hasn’t changed much since Friday and EUR/USD still remains slightly above the support one created by the 88.6% Fibonacci retracement and the long-term green support line based on the Nov 2012 and Jul 2013 lows. Therefore, we still think that this strong support area should (at least) pause further deterioration in the nearest future and trigger a corrective upswing.
Can we find more clues about future moves on the daily chart? Let’s find out.
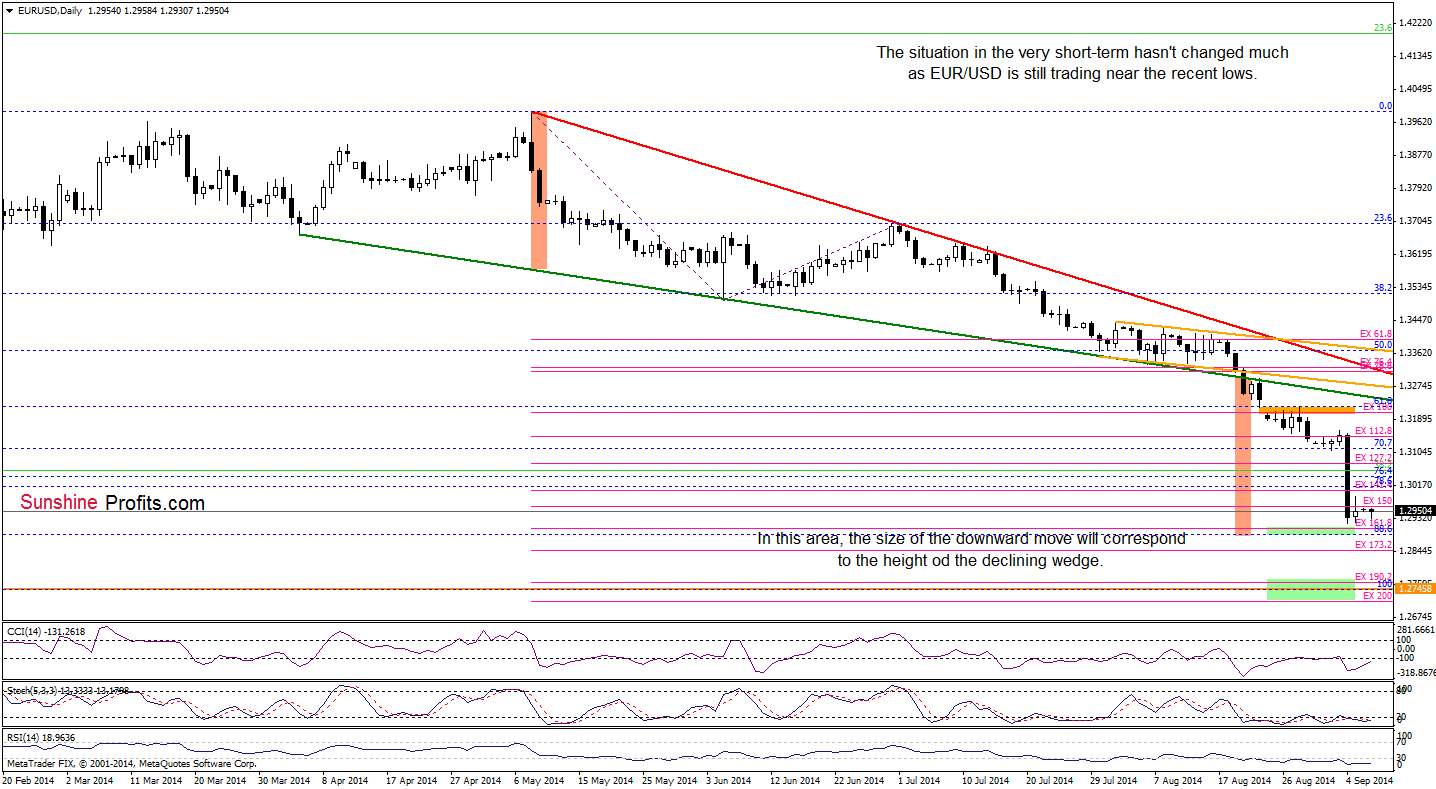
The overall situation in the very short-term also hasn’t changed much since our last Forex Trading Alert was posted as EUR/USD is still trading in a narrow range, slightly above the recent lows. In our opinion, the EUR/USD is likely to move higher, but not very likely before it moves slightly lower first. This scenario is currently reinforced by the position of all indicators (although they are oversold, there are no buy signals, which could encourage currency bulls to act at the moment).
Before we move on to the next currency pair, please keep in mind what we wrote in our last commentary on this currency pair:
(…) EUR/USD declined not only to the support levels that we discussed earlier, but also approached the 161.8% Fibonacci price projection. On top of that, in this area, the size of the downswing corresponds to the height of the declining wedge, which may reduce the selling pressure in the near future. Therefore, if this support zone holds, we may see a corrective upswing to at least the recent highs around 1.3145-1.3160.
Very short-term outlook: mixed
Short-term outlook: mixed
MT outlook: mixed
LT outlook: bearish
Trading position (short-term): In our opinion no positions are justified from the risk/reward perspective. We will keep you informed should anything change, or should we see a confirmation/invalidation of the above.
GBP/USD
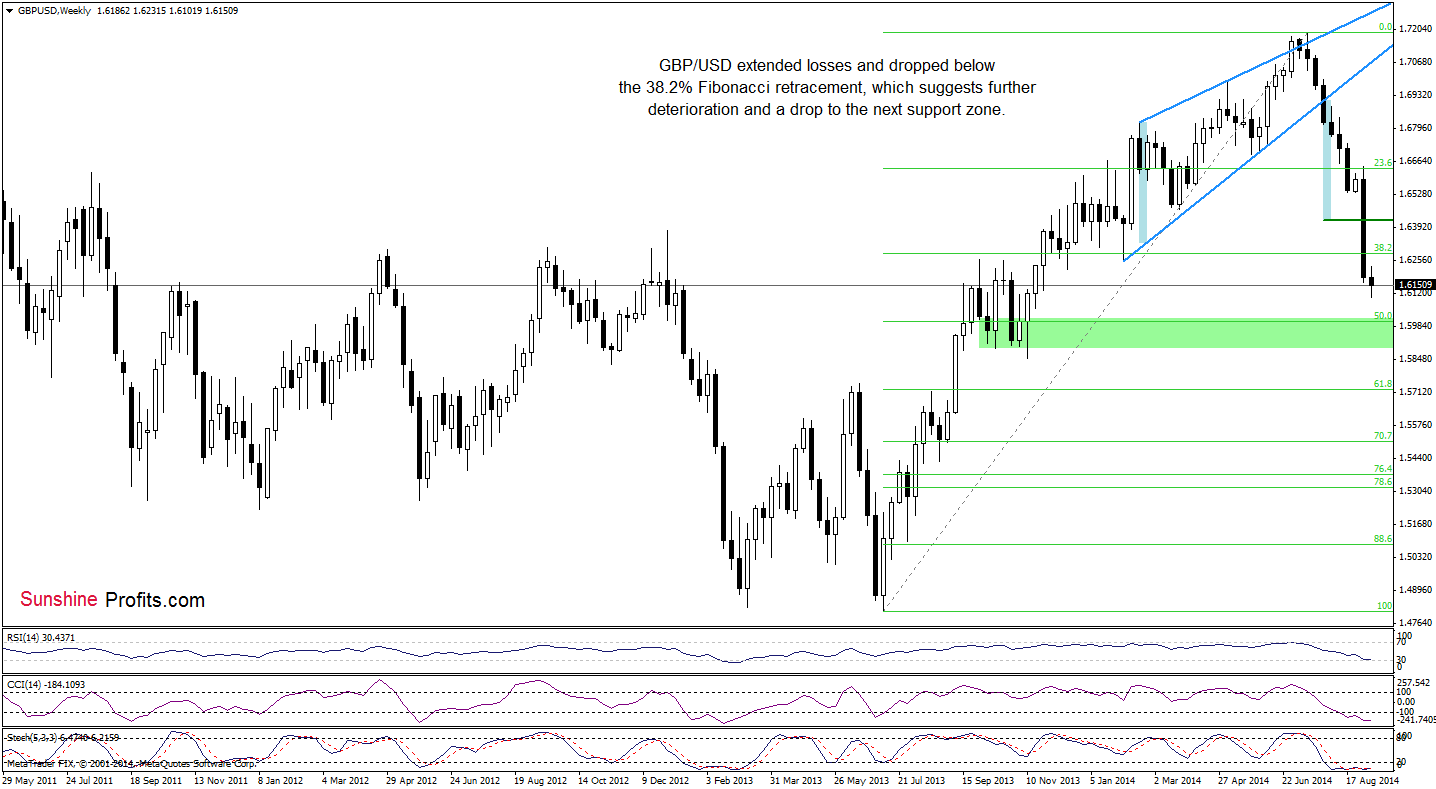
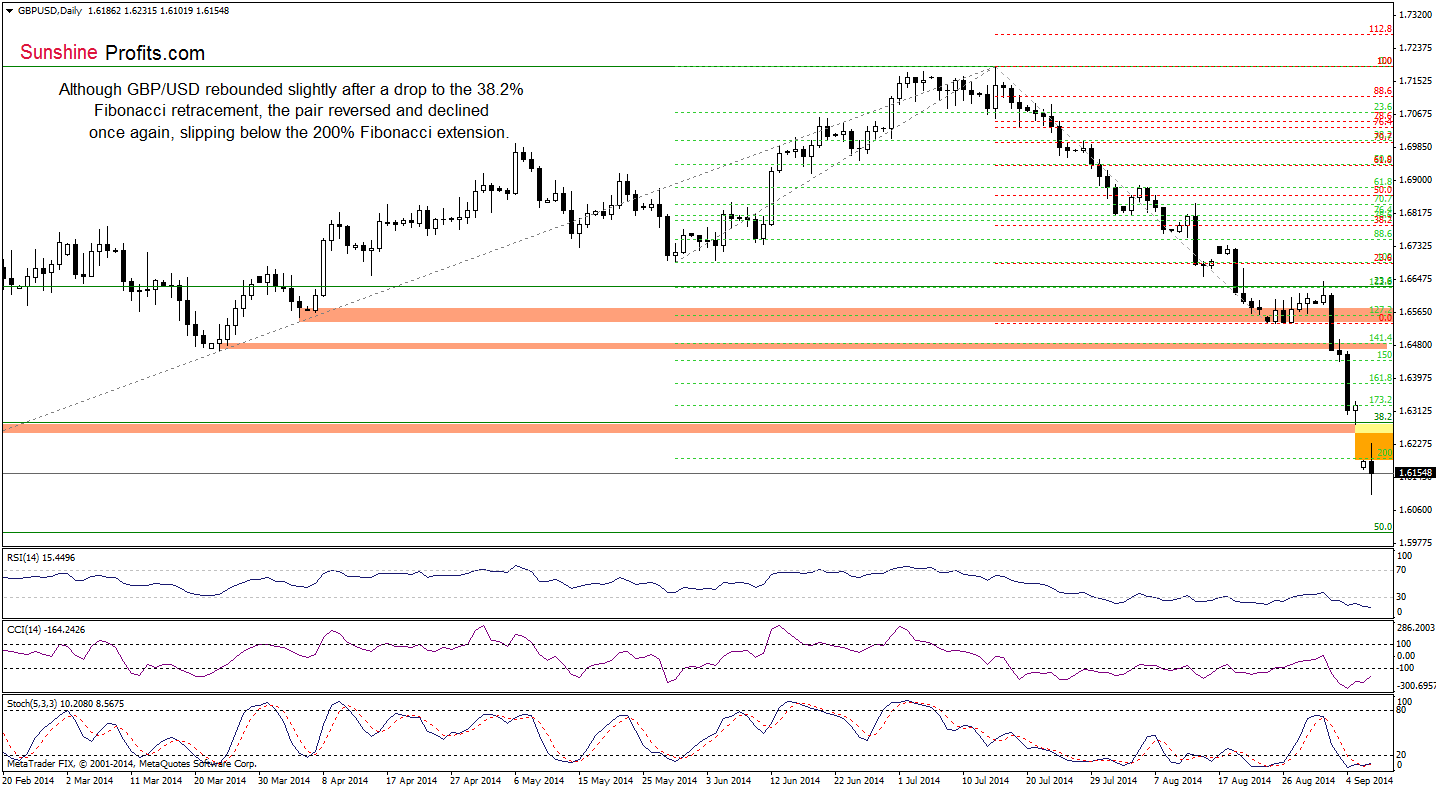
Looking at the above charts, we clearly see that the medium- and short-term situation has deteriorated as GBP/USD declined below the strong support zone created by the 38.2% Fibonacci retracement and the Feb low. Although the pair rebounded slightly on Friday, currency bulls didn’t manage to trigger a bigger corrective upswing. As a result, the exchange rate started this week well below the Friday low, creating an orange gap, which serves as the nearest resistance at the moment. Please note that similar gap successfully stopped further improvement in the case of EUR/USD (at the end of the previous month). Taking this fact into account and combining with a breakdown below the green support zone, it seems to us that the next move will be to the downside and currency bears will try to reach the 50% Fibonacci retracement (around the psychological barrier of 1.6000).
Very short-term outlook: bearish
Short-term outlook: mixed with bearish bias
MT outlook: bearish
LT outlook: mixed
Trading position (short-term): In our opinion, no positions are justified from the risk/reward perspective. We will keep you informed should anything change, or should we see a confirmation/invalidation of the above.
USD/JPY
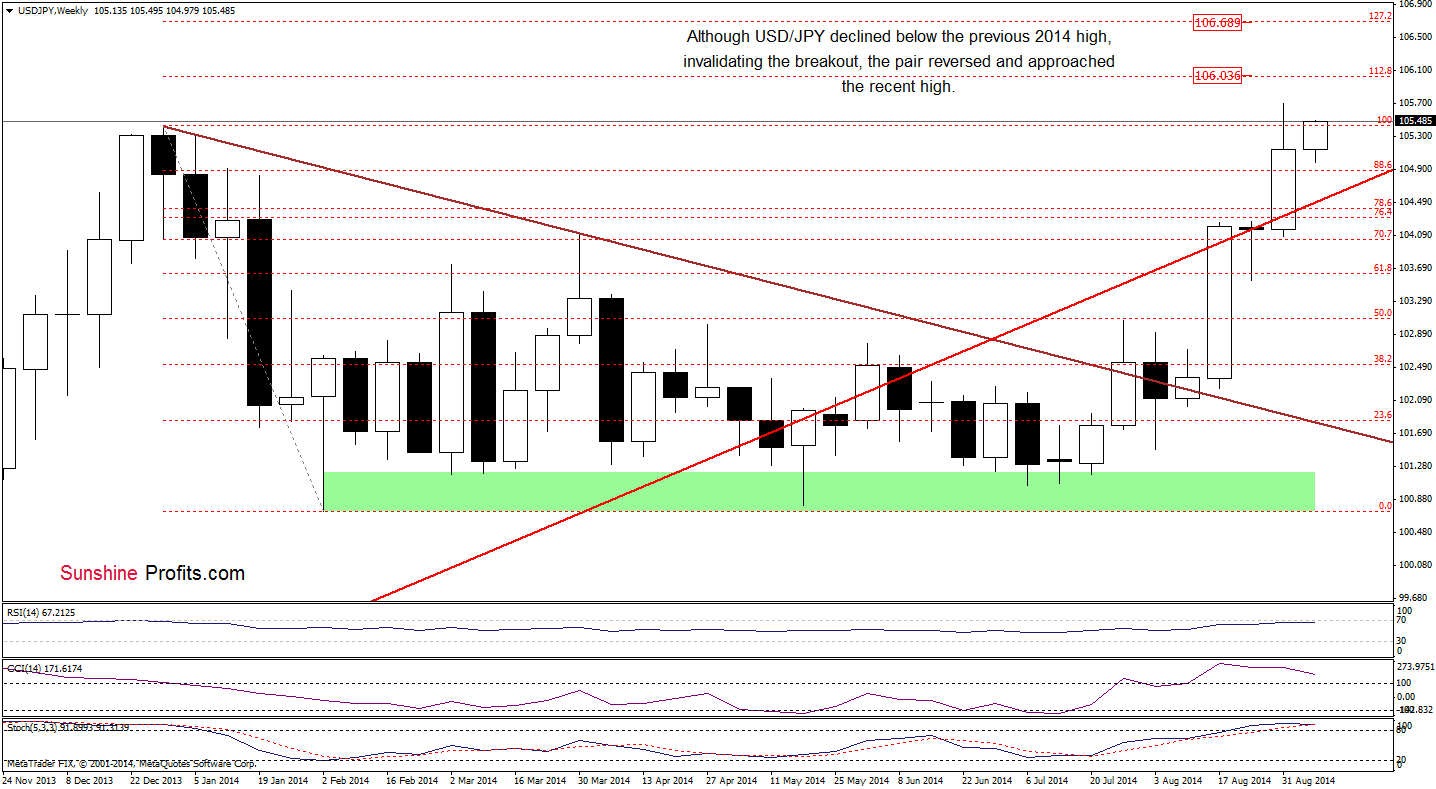
On the above chart, we see that although USD/JPY invalidated the breakout above the Jan high (which was a bearish signal), the pair reversed and is still trading near the recent high. Will we see further improvement in the coming days? Let’s examine the daily chart and look for more clues about future moves.
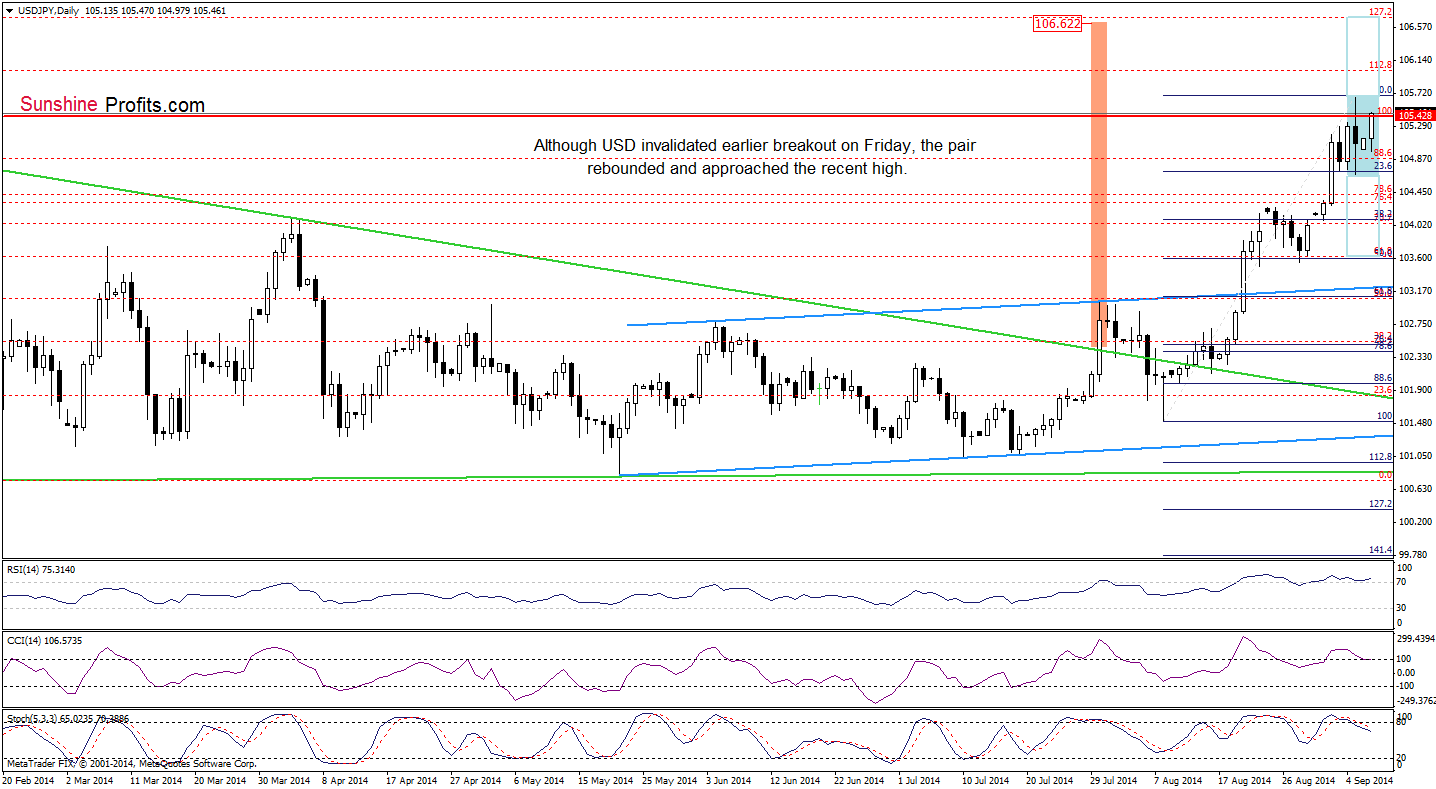
From this perspective, we can see that although USD/JPY reversed, approaching the recent high, the pair is trading in a consolidation between Friday’s high and low. What does it mean for the exchange rate? In our opinion, as long as there is no breakout above the upper line of the formation (or breakdown below the lower border) another bigger move is not likely to be seen. Please note that the current position of the indicators favors currency bears, but we saw similar situation at the end of the previous month. Back then, such price action resulted only in a shallow correction, therefore, it seems to us that may see another attempt to move higher in the coming days. If this is the case, the initial upside target will be around 106, where the 112.8% Fibonacci extension is. If this resistance is broken, the next target for currency bulls will be near 106.62, where the size of the upward move will correspond to the medium-term green triangle (we discussed it here) and the 127.2% Fibonacci extension is.
Very short-term outlook: mixed
Short-term outlook: mixed
MT outlook: mixed
LT outlook: bearish
Trading position (short-term): In our opinion no positions are justified from the risk/reward perspective at the moment. We will keep you informed should anything change, or should we see a confirmation/invalidation of the above.
Thank you.
Nadia Simmons
Forex & Oil Trading Strategist
Przemyslaw Radomski, CFA
Founder, Editor-in-chief
Gold & Silver Trading Alerts
Forex Trading Alerts
Oil Investment Updates
Oil Trading Alerts

