
Earlier today, the Thomson Reuters/University of Michigan revised consumer sentiment index came in at 82.5 this month, beating expectations for a reading of 80.1. Additionally, the Chicago-area PMI rose to 64.3 in August from 52.6 in July, also beating expectations for an increase to 56.0. Thanks to these bullish numbers USD/CHF came back to around the recent high, while EUR/USD hit a fresh multi-month low. What impact did the data have on other currency pairs? Did it change their short-term outlook?
In our opinion the following forex trading positions are justified - summary:
EUR/USD
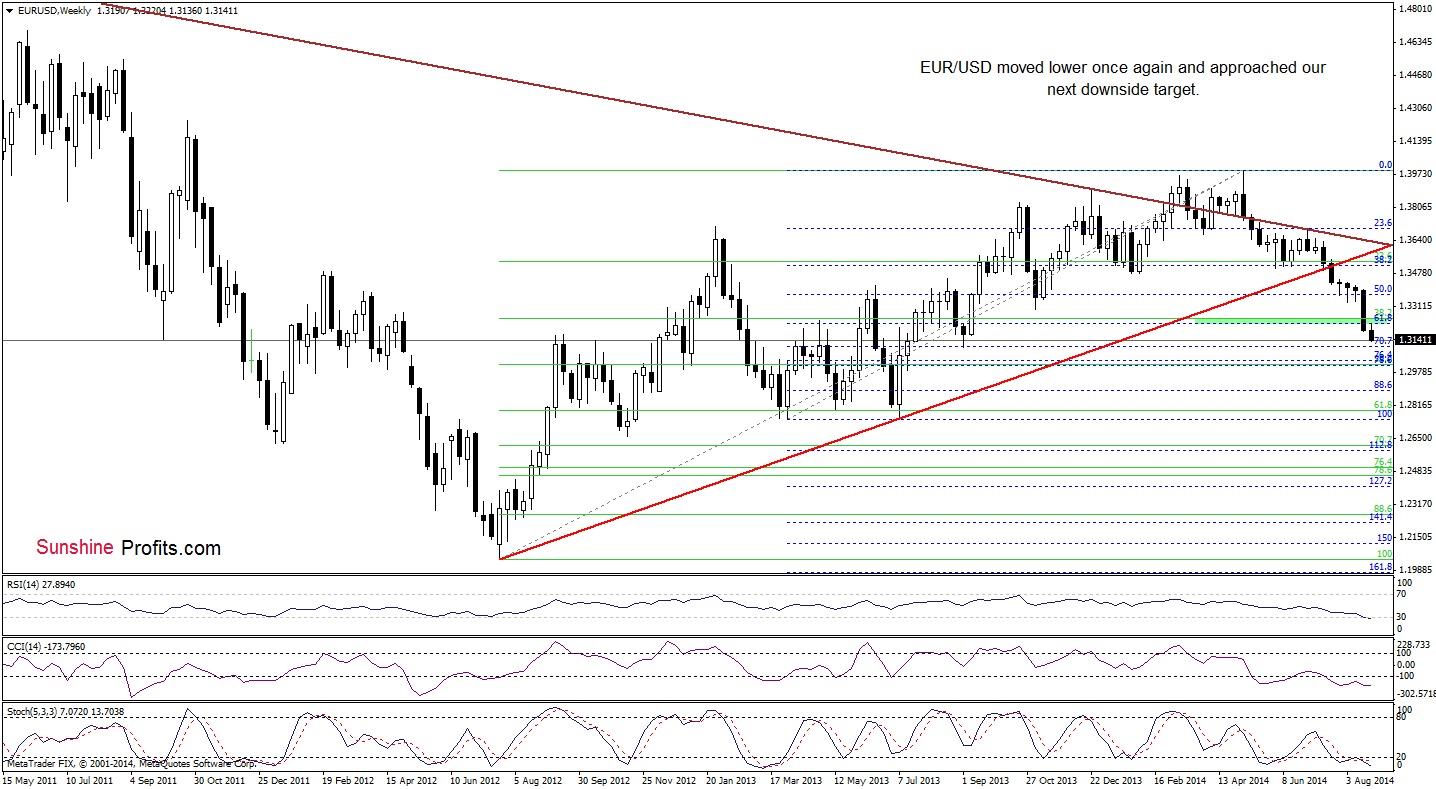
The medium-term picture has deteriorated as EUR/USD extended losses below the strong support/resistance zone created by the 38.2% and 61.8% Fibonacci retracement levels. Therefore, what we wrote on Monday is up-to-date:
(…) This is a strong bearish signal, which suggests further deterioration and a drop to around 1.3104-1.3109, were the 70.7% Fibonacci retracement meets the September low. (…) although the RSI declined to its lowest level since July 2012 (while the CCI and Stochastic Oscillator are oversold) suggesting a pause or corrective upswing, we should keep in mind that as long as there is no invalidation of the breakdown below the green area, another attempt to move lower can’t be ruled out.
What can we infer from the very short-term picture? Let’s check.
Quoting our previous Forex Trading Alert:
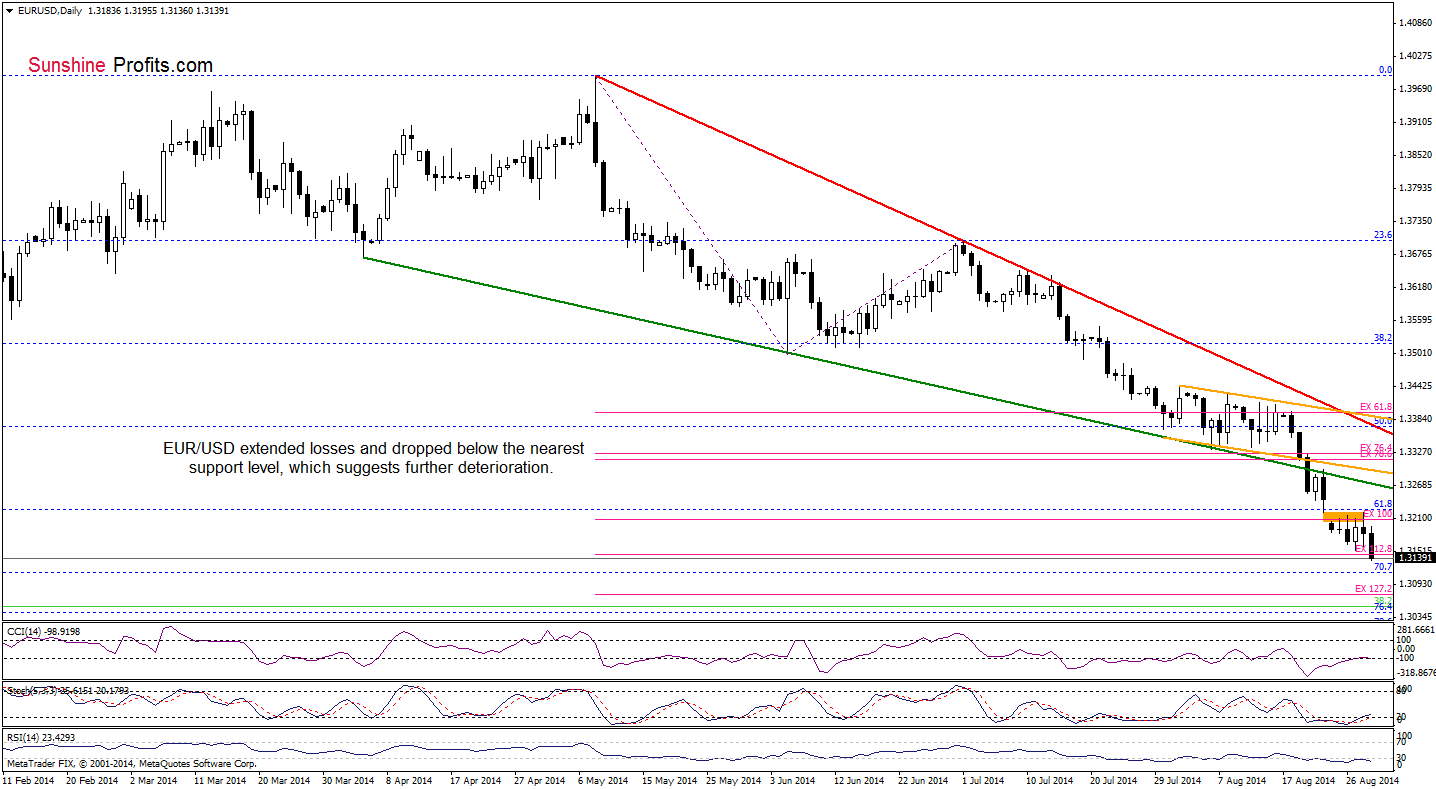
(…) the orange gap successfully stopped further improvement. As a result, the exchange rate reversed and declined, which suggests that the pair will test the strength of the recent lows. If this area (…) is broken, the next downside target for currency bears will be around 1.3109, where the 70.7% Fibonacci retracement is.
Looking at the above chart, we see that the exchange rate broke below the recent lows and the 112.8% Fibonacci price projection, which suggests further deterioration and a drop to the above-mentioned downside target in the coming days.
Very short-term outlook: mixed with bearish bias
Short-term outlook: mixed
MT outlook: mixed
LT outlook: bearish
Trading position (short-term): In our opinion no positions are justified from the risk/reward perspective. We will keep you informed should anything change, or should we see a confirmation/invalidation of the above.
GBP/USD
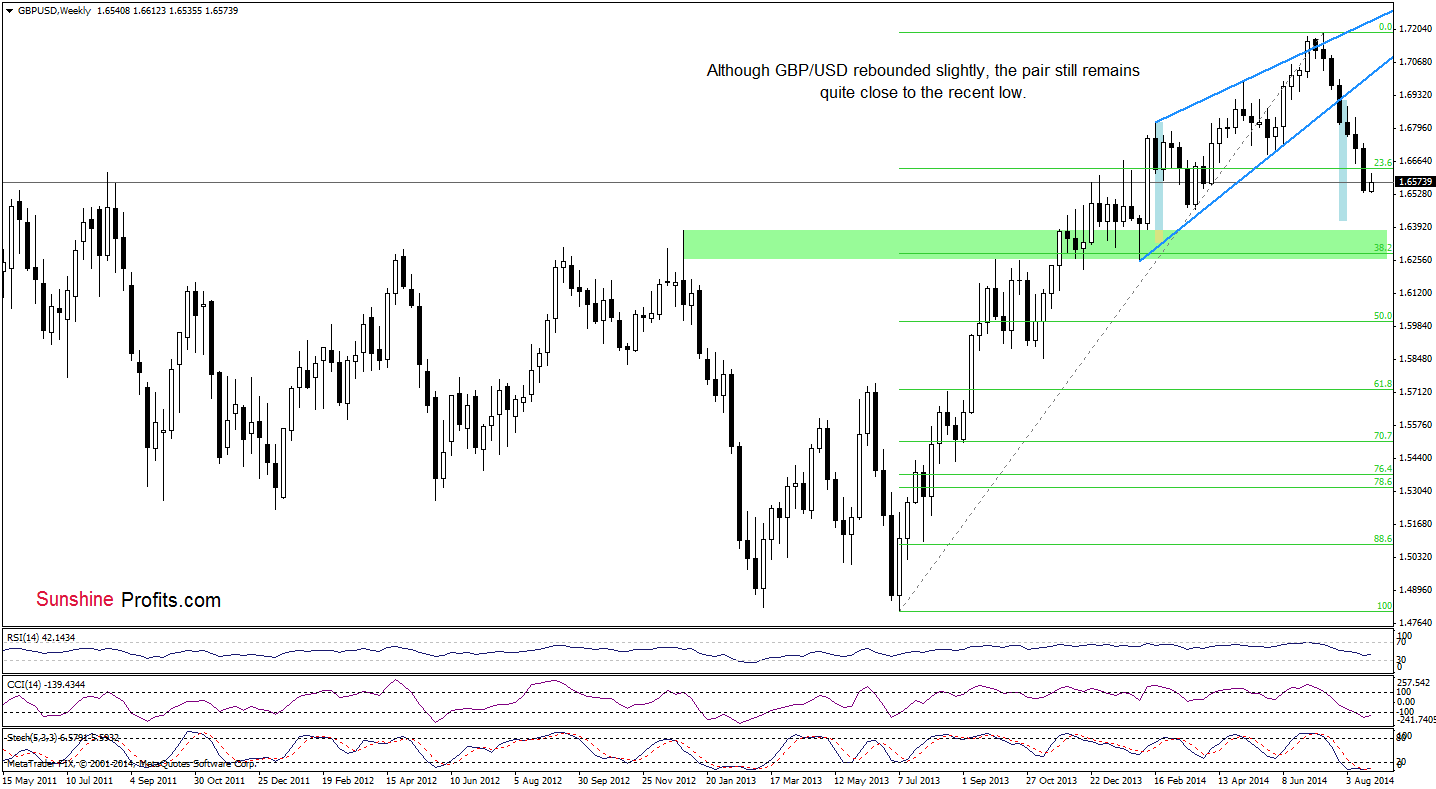
The medium-term picture remains almost unchanged as GBP/USD is trading slightly above the recent lows. What’s next? Taking into account the fact that there are no buy signals or positive divergences between the indicators and the exchange rate, which could bode well and precede a pause or an upswing, we think that another attempt to move lower can’t be ruled out.
What can we infer from the daily chart? Let’s check.
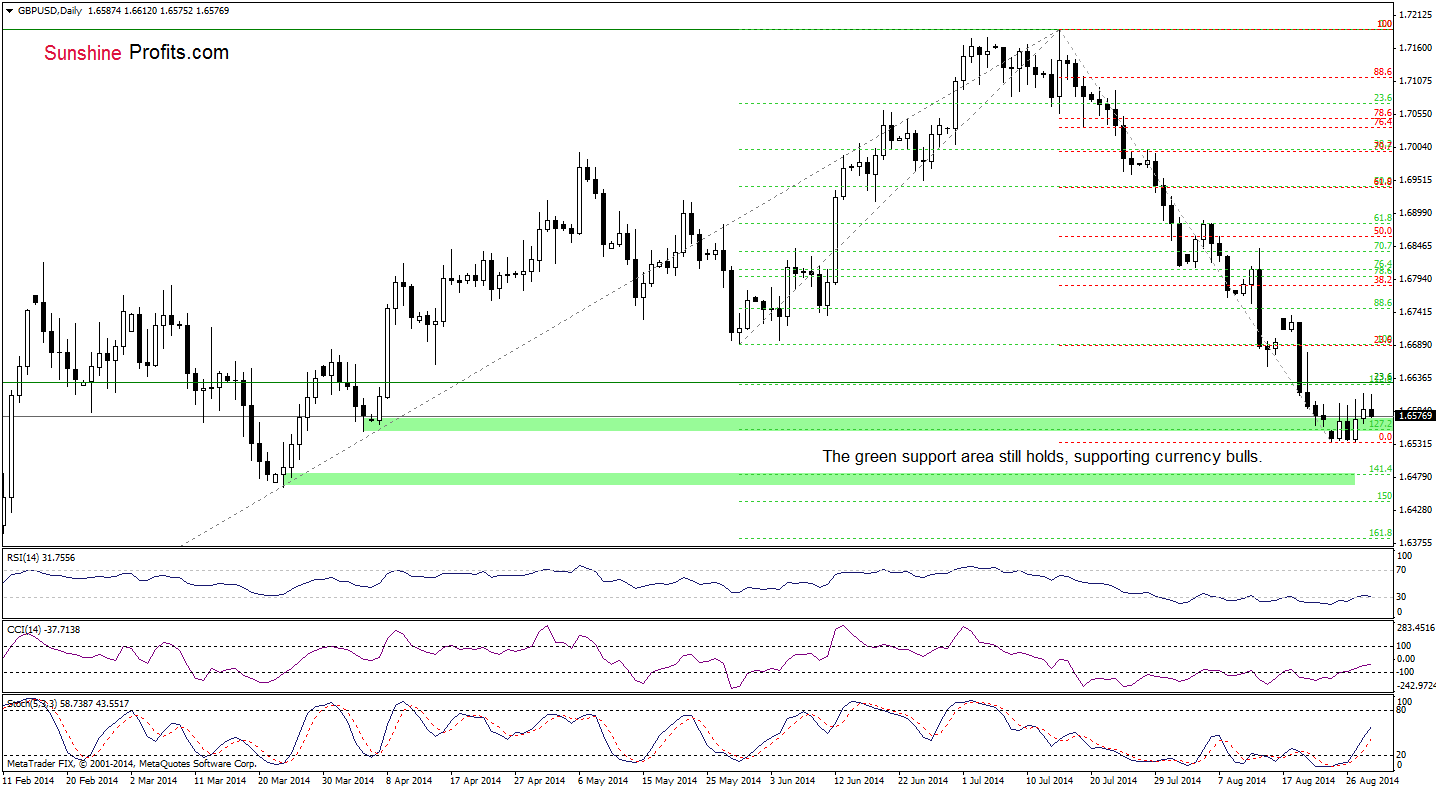
From this perspective, we see that the very short-term situation also hasn’t changed much as GBP/USD is still trading slightly above the green support zone created by the April low and the 127.2% Fibonacci extension (based on the May-July rally). If this area holds, we’ll see a rebound from here and an increase to (at least) 1.6690, where the 23.6% Fibonacci retracement based on the entire Jul-Aug decline is. Nevertheless, if the exchange rate moves lower, the next target for currency bears will be around the March low, which is reinforced by the 141.4% Fibonacci extension. Please note that the CCI and Stochastic Oscillator generated buy signals, which supports the bullish case.
Very short-term outlook: mixed
Short-term outlook: mixed
MT outlook: bearish
LT outlook: mixed
Trading position (short-term): In our opinion, no positions are justified from the risk/reward perspective. We will keep you informed should anything change, or should we see a confirmation/invalidation of the above.
USD/JPY
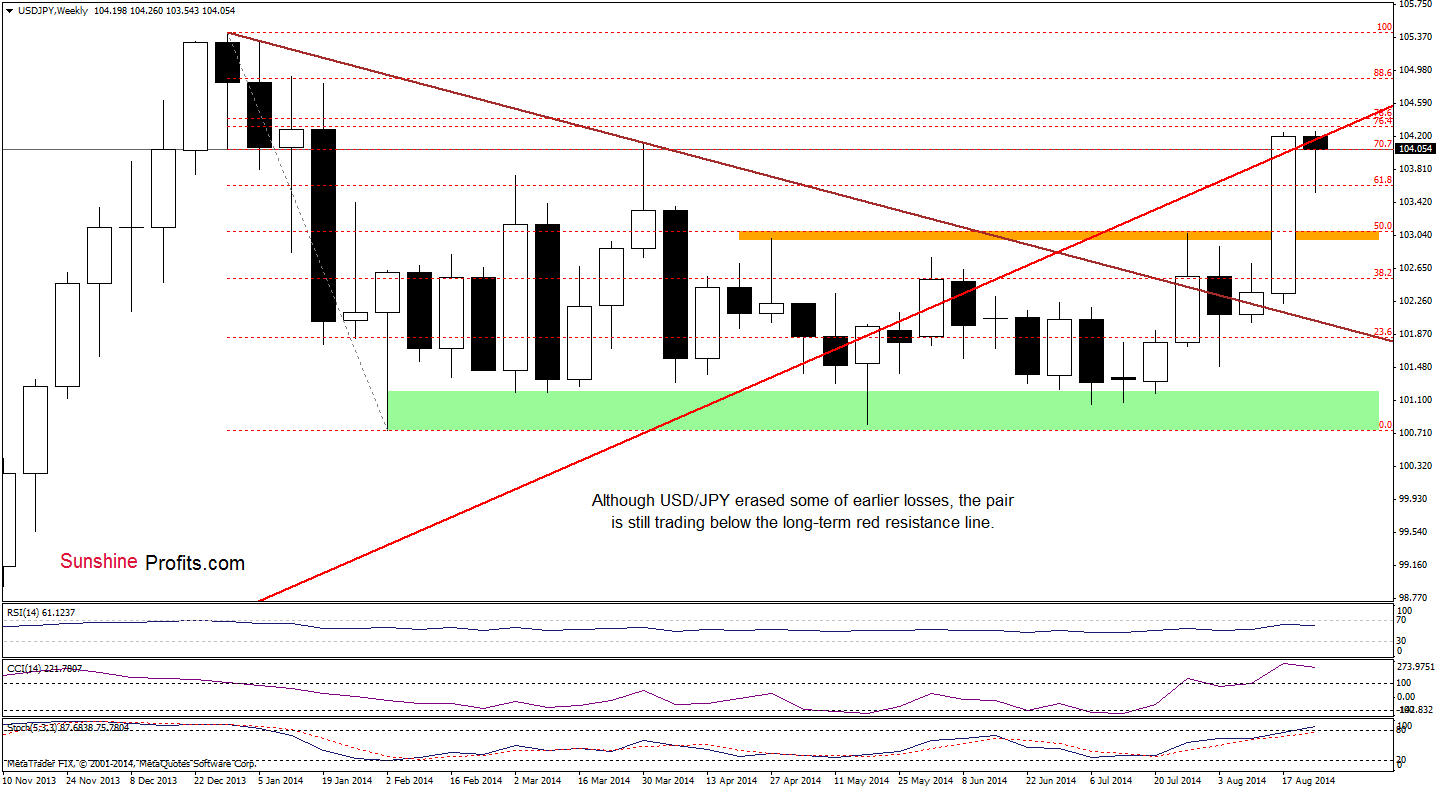
Although USD/JPY rebounded, the medium-term picture hasn’t changed much as the exchange rate still remains slightly below the previously-broken resistance zone created by the long-term red resistance line and the 70.7% Fibonacci retracement. If the pair moves higher and invalidates the breakdown, it will be a strong bullish signal that will trigger an increase to around 104.88, where the 88.6% Fibonacci retracement is. On the other hand, taking into account the current position of the indicators and the proximity to the strong resistance zone (created by the 76.4% and 78.6% Fibonacci retracements), it seems that another attempt to move lower should not surprise us.
Will the daily chart give us more clues about future moves? Let’s check.
Quoting our last commentary on this currency pair:
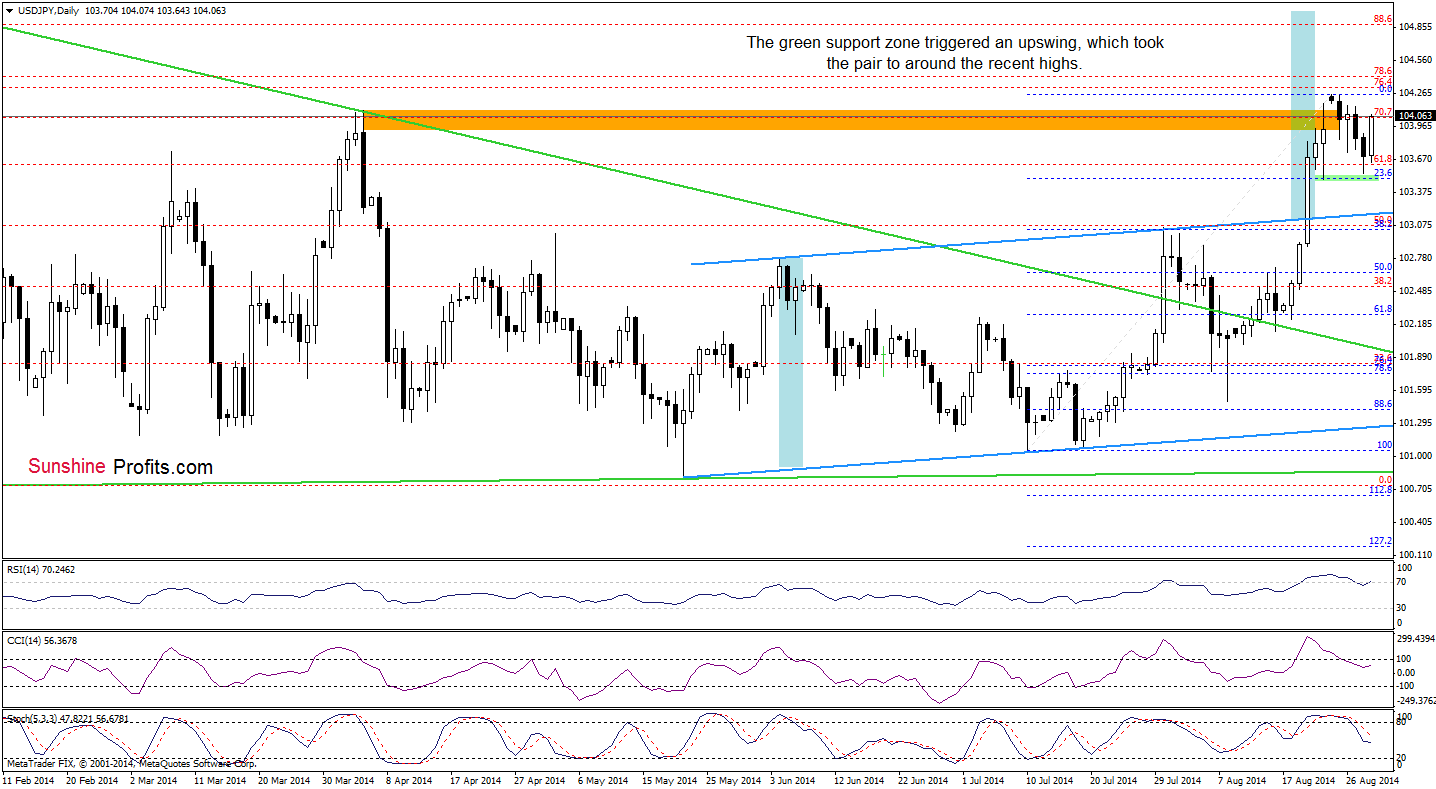
(…) USD/JPY extended losses and reached its first support area created by the bottom of the previous pullback and the 23.6% Fibonacci retracement based on the Jul-Aug rally. (…) if it holds, we’ll see a rebound and a comeback to around the recent highs.
Looking at the above chart, we see that the situation developed in line with the above-mentioned scenario and the exchange rate reversed. Despite today’s increase, the pair still remains below the orange resistance zone and the recent high. Therefore, if currency bulls do not give up and push USD/JPY above these resistance levels, we’ll see further improvement and attempt to break above the next resistance area (created by the 76.4% and 78.6% Fibonacci retracements). Nevertheless, taking into account negative divergences between the exchange rate and the indicators (and also sell signals), it seems to us that another test of the strength of the green support zone is more likely at the moment.
Very short-term outlook: mixed with bearish bias
Short-term outlook: mixed with bearish bias
MT outlook: mixed
LT outlook: bearish
Trading position (short-term): In our opinion no positions are justified from the risk/reward perspective at the moment. We will keep you informed should anything change, or should we see a confirmation/invalidation of the above.
USD/CAD
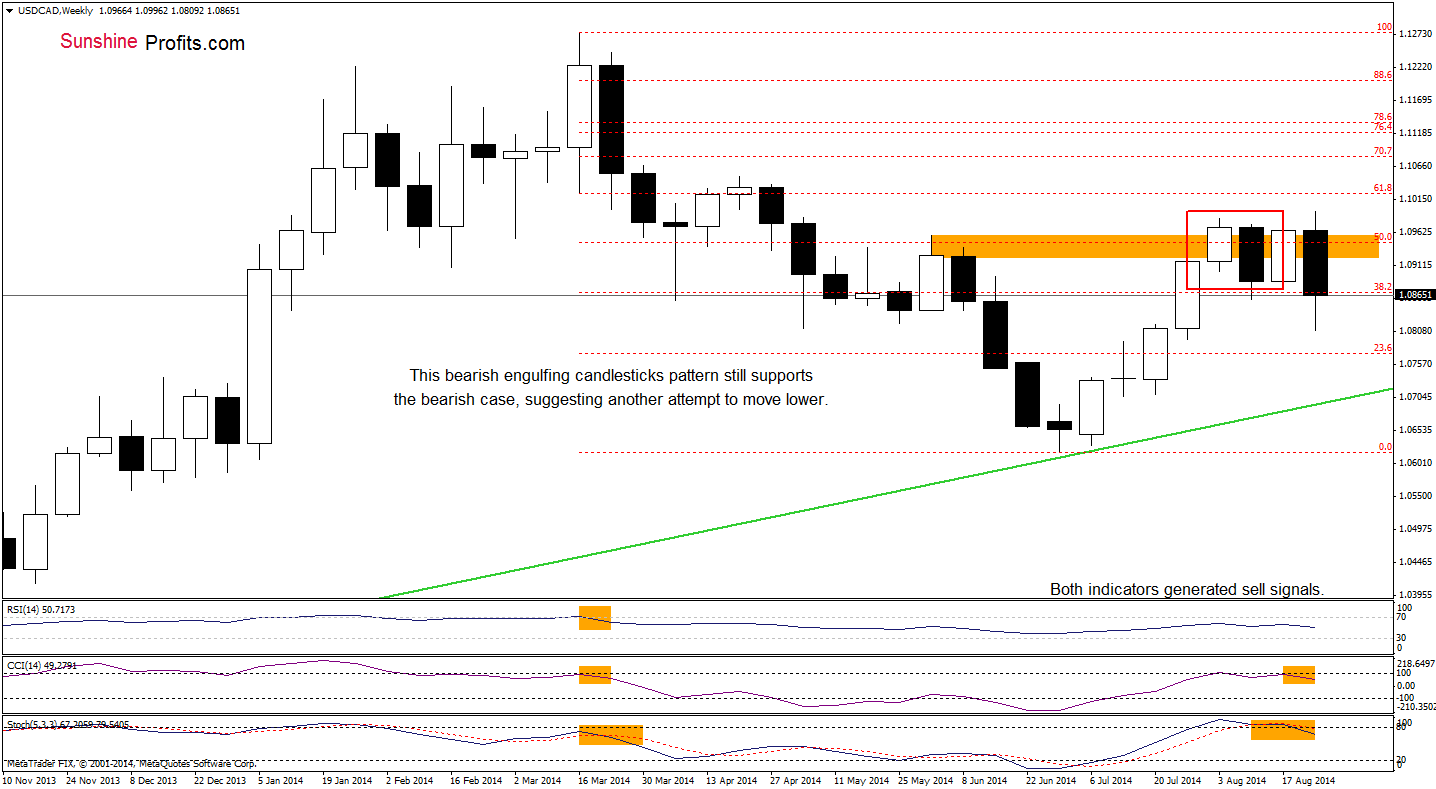
The medium-term outlook has deteriorated as USD/CAD extended losses and dropped below the previous lows. Although the pair rebounded slightly, a bearish engulfing candlesticks pattern in combination with sell signals generated by the indicators still supports currency bears, suggesting another attempt to move lower in the coming week (or even weeks).
Are there any short-term signas that could stop further deterioration? Let’s take a closer look at the daily chart.
In our last commentary on this currency pair, we wrote the following:
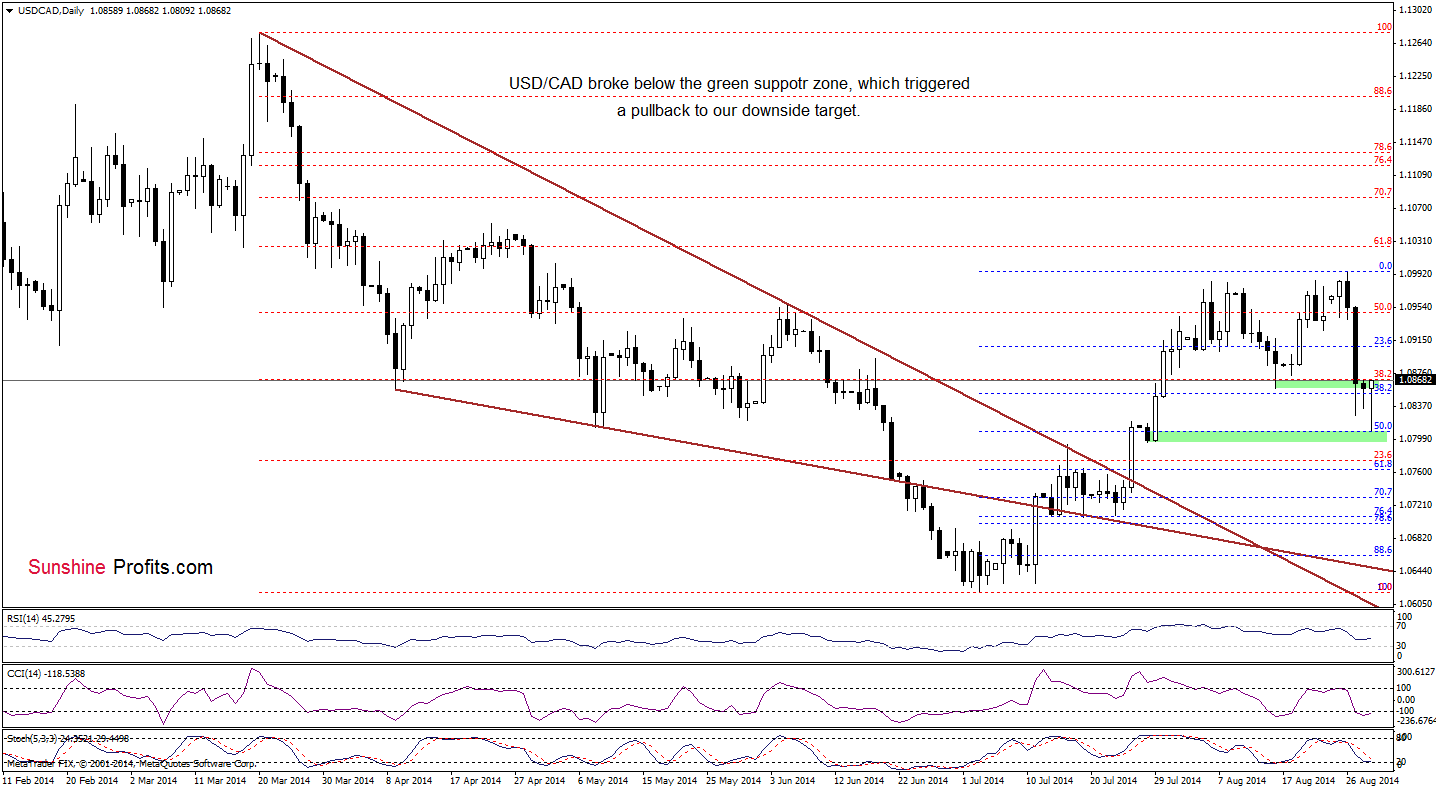
(…) How low could the exchange rate go? Taking into account the current situation in the very short-term (sell signals, which are still in play and another invalidation of the breakout ), we think that (…) the first downside target will be the bottom of the recent correction (around 1.0860). At this point, it’s worth noting that the CCI and Stochastic Oscillator generated sell signals, which supports the bearish case at the moment. Please note that if this support area (...) is broken, the next downside target will be the 50% Fibonacci retracement based on the entire Jul-Aug rally (around 1.0807) reinforced by the bottom of a small correction that we saw at the end of July.
Earlier today, currency bears realized the above-mentioned scenario as we expected. The above chart clearly shows that the lower green support zone triggered a corrective upswing that took the pair to the previous lows. If this area stops further rally, we’ll see a comeback to the 50% Fibonacci retracement. However, if it is broken, the next upside target will be around 1.0954, where the Aug 27 high and the 76.4% and 78.6% Fibonacci retracements (based on the recent decline) is. Which scenario is more likely? Looking at the current position of the indicators, it seems that as long as there are no buy signals, another attempt to move lower can’t be ruled out.
Very short-term outlook: mixed
Short-term outlook: mixed
MT outlook: mixed
LT outlook: bearish
Trading position (short-term): In our opinion no positions are justified from the risk/reward perspective. We will keep you informed should anything change, or should we see a confirmation/invalidation of the above.
USD/CHF
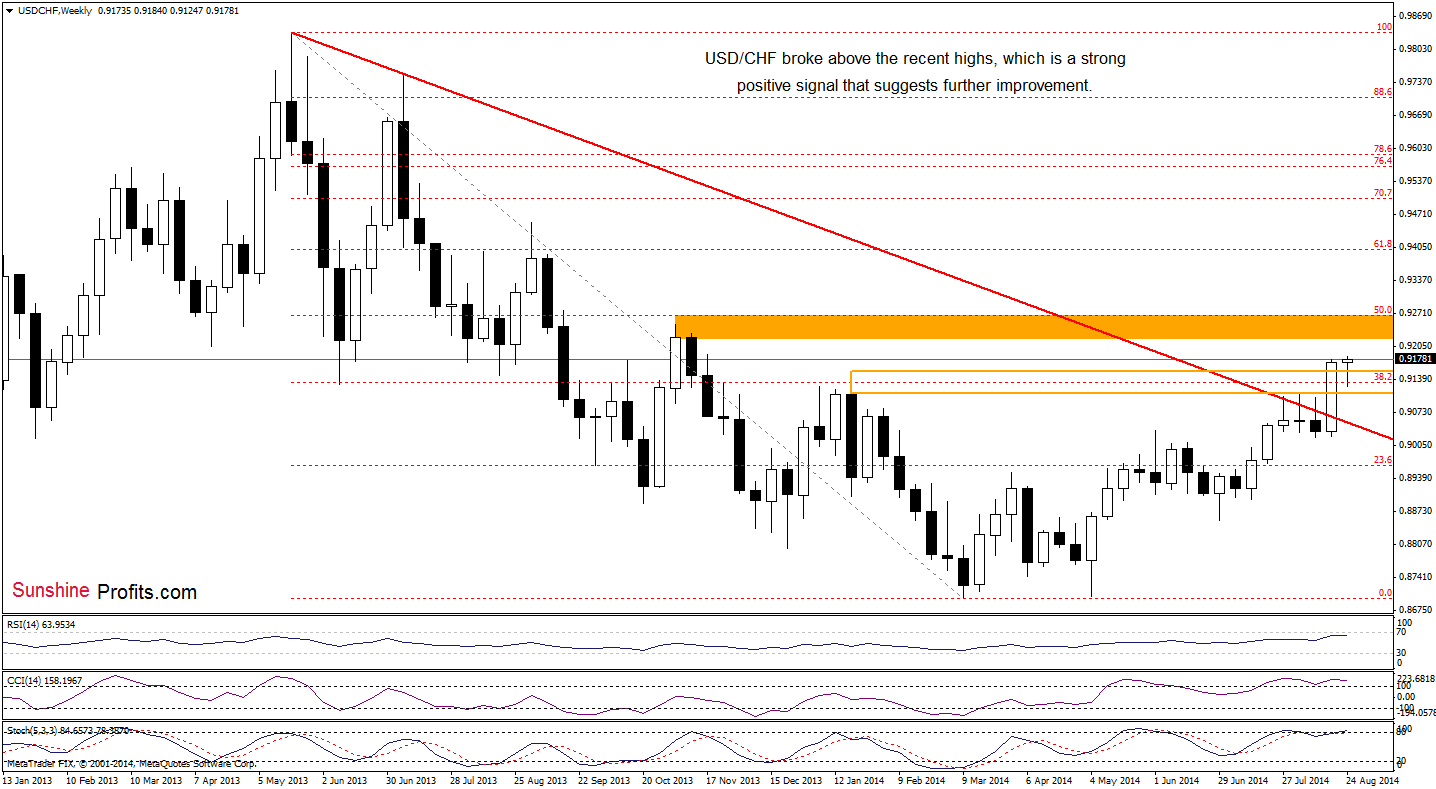
The medium-term outlook has improved as USD/CHF climbed above the last week’s high. This is a bullish signal, which suggests further improvement. Nevertheless, we should keep an eye on the indicators, which are overbought and suggest that a trend reversal is just around the corner.
Once we know the medium-term picture, let’s examine the daily chart.
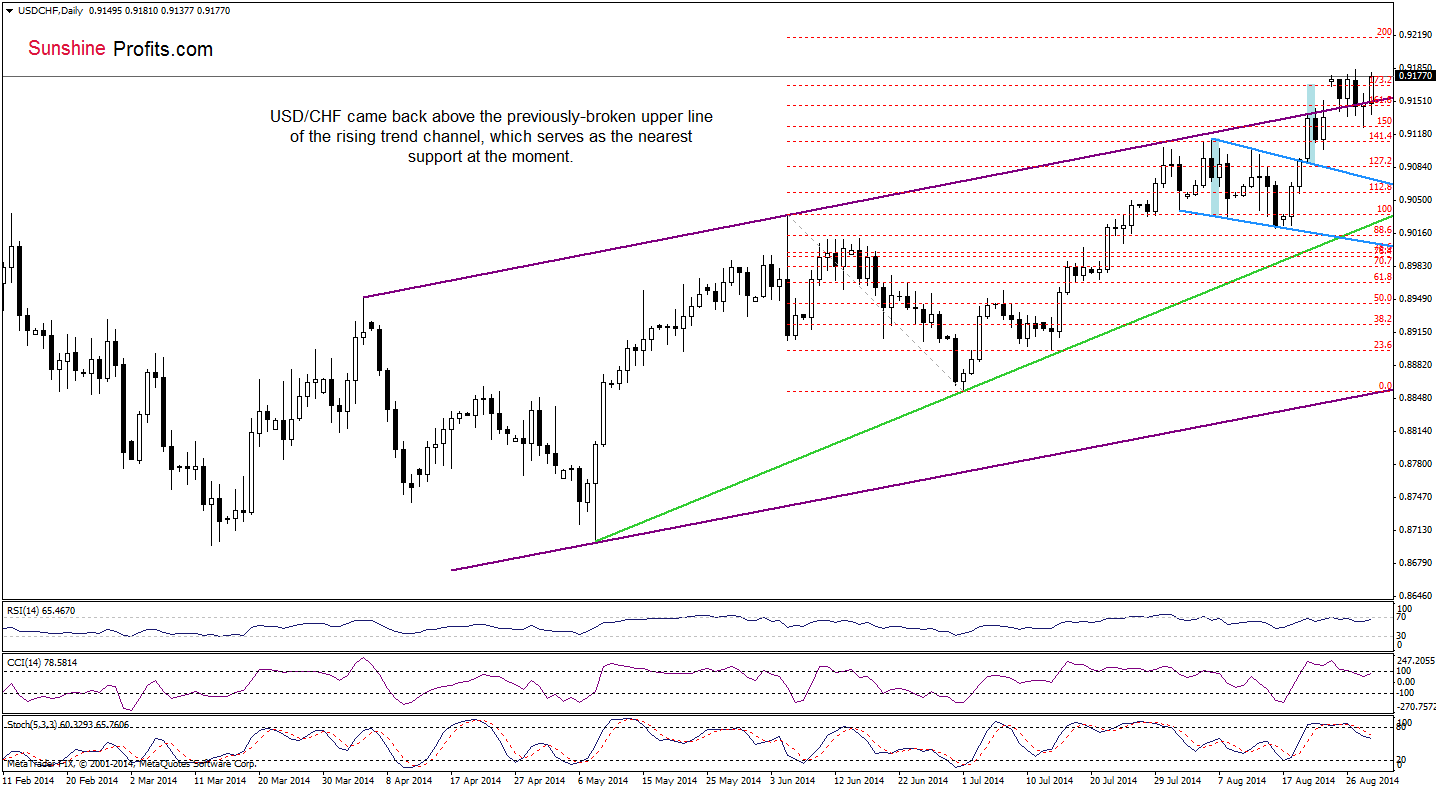
From this perspective, we see that although USD/CHF slipped below the upper line of the purple trend channel, invalidating earlier breakout, currency bulls didn’t give up and pushed the pair above it once again. This positive signal triggered further improvement and the exchange rate came back to the recent high. As a reminder, this area is reinforced by the 173.2% Fibonacci extension, which could initiate another correction. In this case, if the pair drops below yesterday’s low, we may see a post double top decline and a drop to the upper line of the blue declining trend channel (currently around 0.9072. However, if USD/CHF moves higher, the next upside target will be around 0.9216, where the 200% Fibonacci extension is.
Very short-term outlook: mixed with bearish bias
Short-term outlook: mixed
MT outlook: mixed with bullish bias
LT outlook: bearish
Trading position (short-term): In our opinion no positions are justified from the risk/reward perspective. We will keep you informed should anything change, or should we see a confirmation/invalidation of the above.
AUD/USD
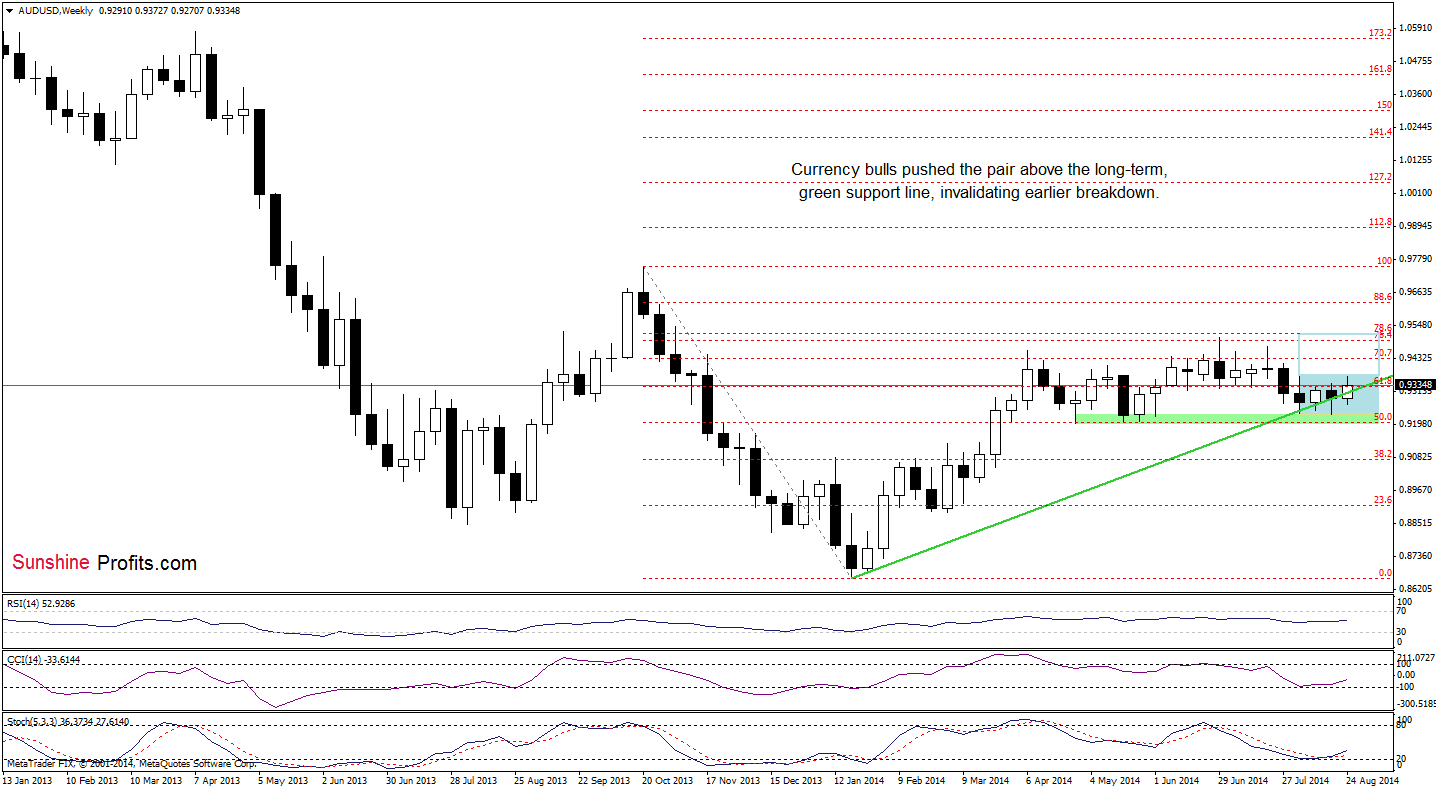
The medium-term picture hasn’t chaged much as AUD/USD is still trading in the consolidation (marked with blue), slightly above the long-term green support line. Therefore, we think that as long as there is no breakout above the upper line of the formation, another sizable move to the upside is not likely to be seen (despite the fact that buy signals generated by the CCI and Stochastic Oscillator remain in place).
Will we see such price action in the coming week? Let’s examine the daily chart and look for more clues about future moves.
Quoting our last Forex Trading Alert:
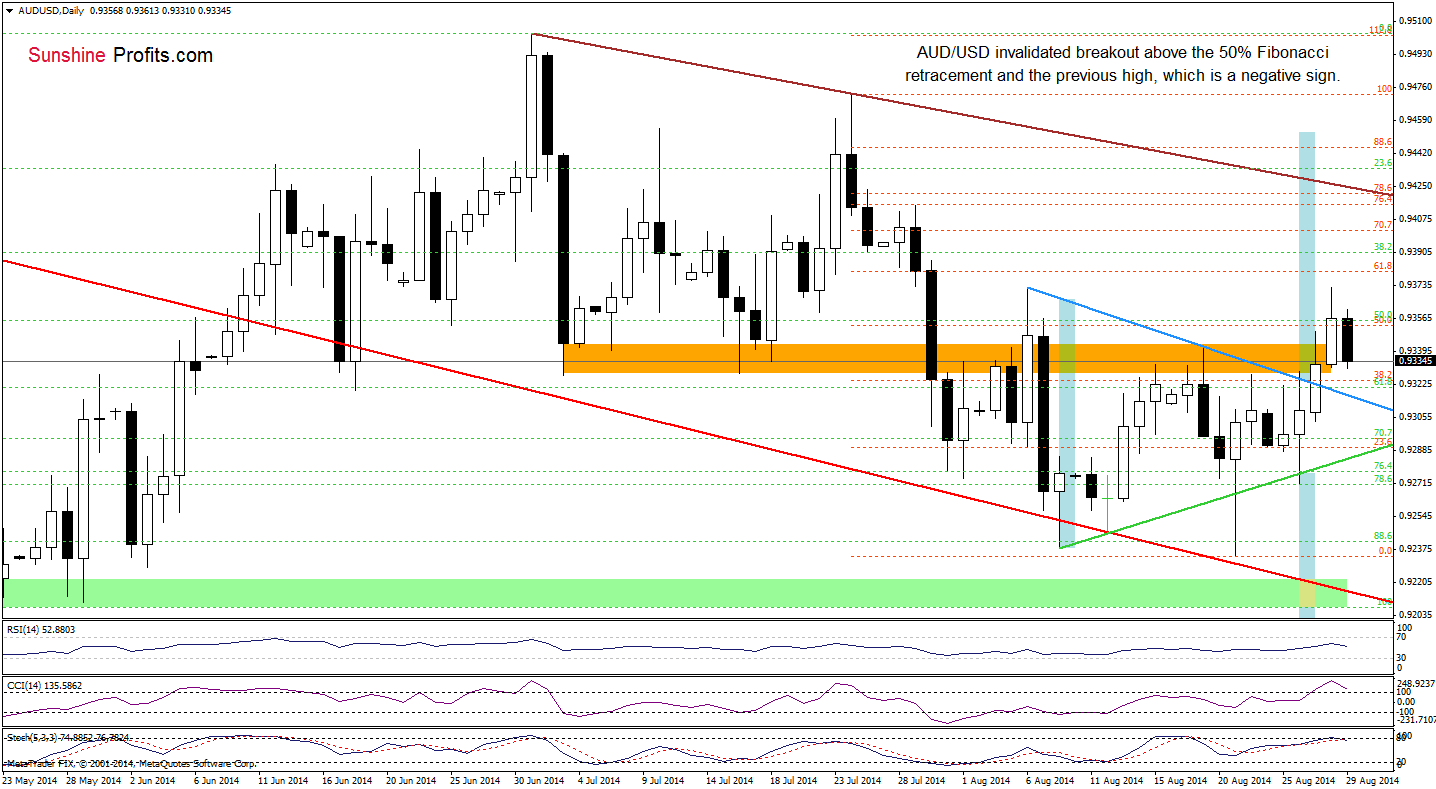
(…) If the exchange rate breaks above the orange resistance zone, we may see an increase to at least the brown declining resistance line (…) we should keep an eye on the current position of the indicators. As you see, the CCI and Stochastic Oscillator are quite high, which suggests that if they generate sell signals, currency bulls may have a problem with a realization of the above-mentioned scenario.
From this perspective, we see that AUD/USD moved lower and invalidated a breakout above the 50% Fibonacci retracement, which is a strong bearish signal. Taking this fact into account and combining it with the current position of the indicators (they are very close to generate sell signals), it seems to us that the exchange rate will extend a pullback and test the strength of the previously-broken upper line of the blue triangle.
Very short-term outlook: bearish
Short-term outlook: mixed
MT outlook: mixed
LT outlook: bearish
Trading position (short-term): In our opinion, no positions are justified from the risk/reward perspective. We will keep you informed should anything change, or should we see a confirmation/invalidation of the above.
Thank you.
Nadia Simmons
Forex & Oil Trading Strategist
Przemyslaw Radomski, CFA
Founder, Editor-in-chief
Gold & Silver Trading Alerts
Forex Trading Alerts
Oil Investment Updates
Oil Trading Alerts

