
Earlier today, data showed that the Gfk German consumer climate index dropped to 8.6 this month, while analysts had expected the index to remain unchanged in August. This disappointing data pushed the common currency to a fresh 11-month lows against the U.S. dollar. Is the worst for EUR/USD behind us?
In our opinion the following forex trading positions are justified - summary:
EUR/USD
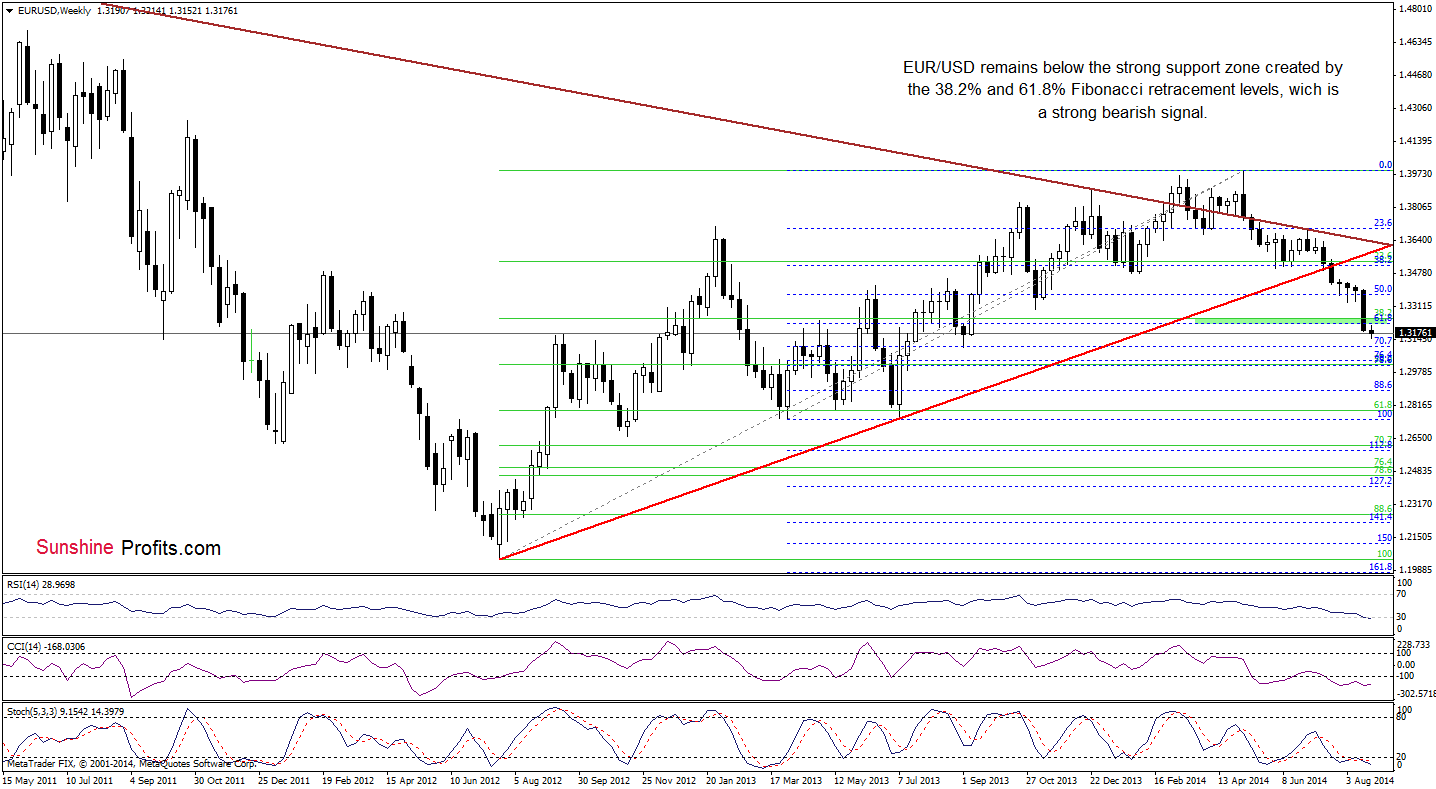
The medium-term picture has deteriorated slightly as EUR/USD extended losses below the strong support zone created by the 38.2% and 61.8% Fibonacci retracement levels. Therefore, what we wrote on Monday is up-to-date:
(…) This is a strong bearish signal, which suggests further deterioration and a drop to around 1.3104-1.3109, were the 70.7% Fibonacci retracement meets the September low. (…) although the RSI declined to its lowest level since July 2012 (while the CCI and Stochastic Oscillator are oversold) suggesting a pause or corrective upswing, we should keep in mind that as long as there is no invalidation of the breakdown below the green area, another attempt to move lower can’t be ruled out.
What can we infer from the very short-term picture? Let’s check.
Quoting our previous Forex Trading Alert:
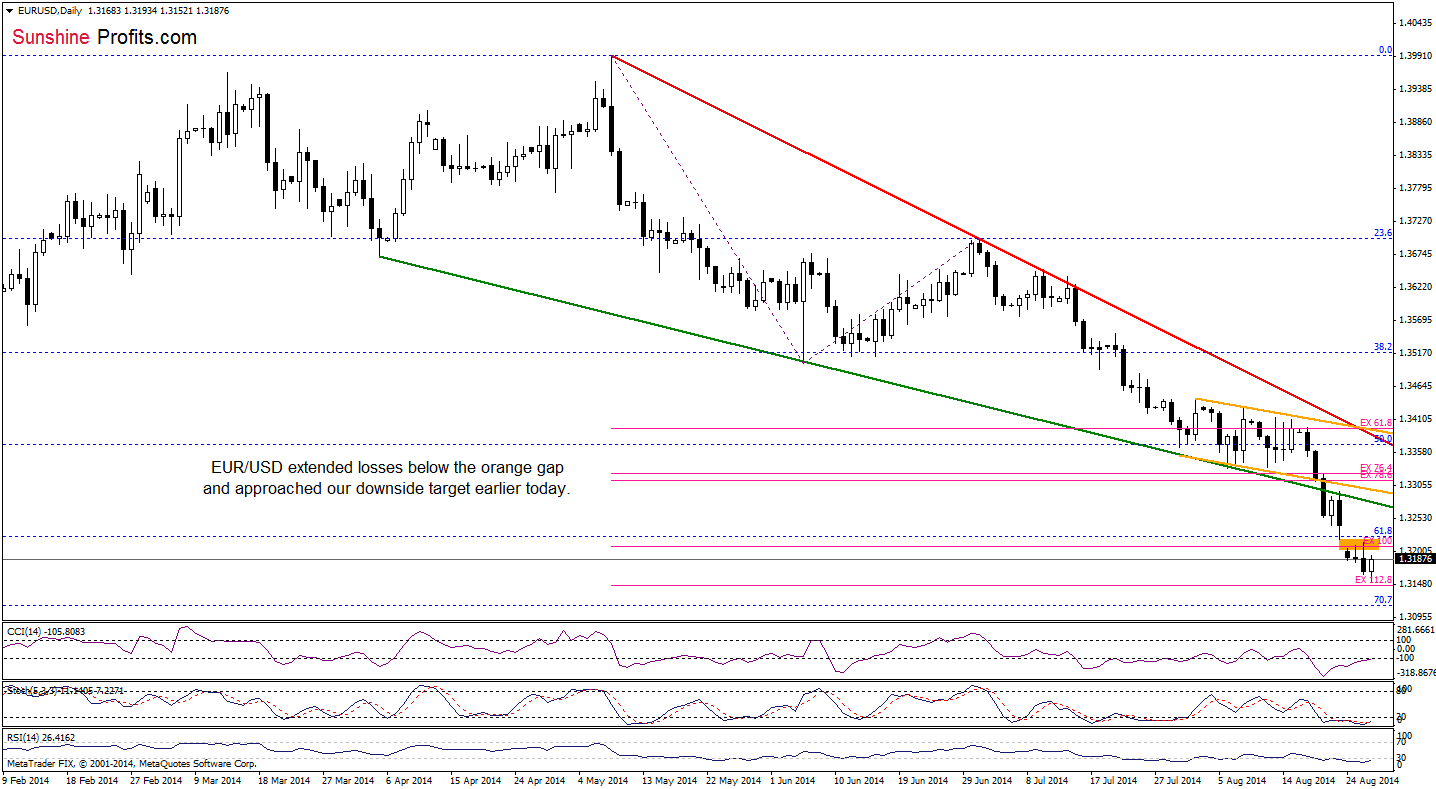
(…) the exchange rate still remains well below the previously-broken lower border of the declining wedge and also under the orange gap (reinforced by the 61.8% Fibonacci retracement and the 100% Fibonacci price projections). All the above provides us with bearish implications and means that as long as there is no invalidation of the breakdown below these levels, another downswing is quite likely. If this is the case, the initial downside target for currency bears will be 112.8% Fibonacci price projections (based on the May and July highs and the June low) around 1.3146.
Earlier today, EUR/USD moved lower and approached our downside target. As you see on the above chart, the proximity to the above-mentioned support level encouraged currency bulls to act, which resulted in a corrective upswing. Despite this move, the pair still remains below its nearest resistance - the orange gap and the key resistance line – the lower border of the declining wedge. Taking this fact into account, we still think that as long as there is no invalidation of the breakdown below these levels, another attempt to move lower should not surprise us.
Very short-term outlook: mixed
Short-term outlook: mixed
MT outlook: mixed
LT outlook: bearish
Trading position (short-term): In our opinion no positions are justified from the risk/reward perspective. We will keep you informed should anything change, or should we see a confirmation/invalidation of the above.
USD/CAD
On Friday, we wrote the following:
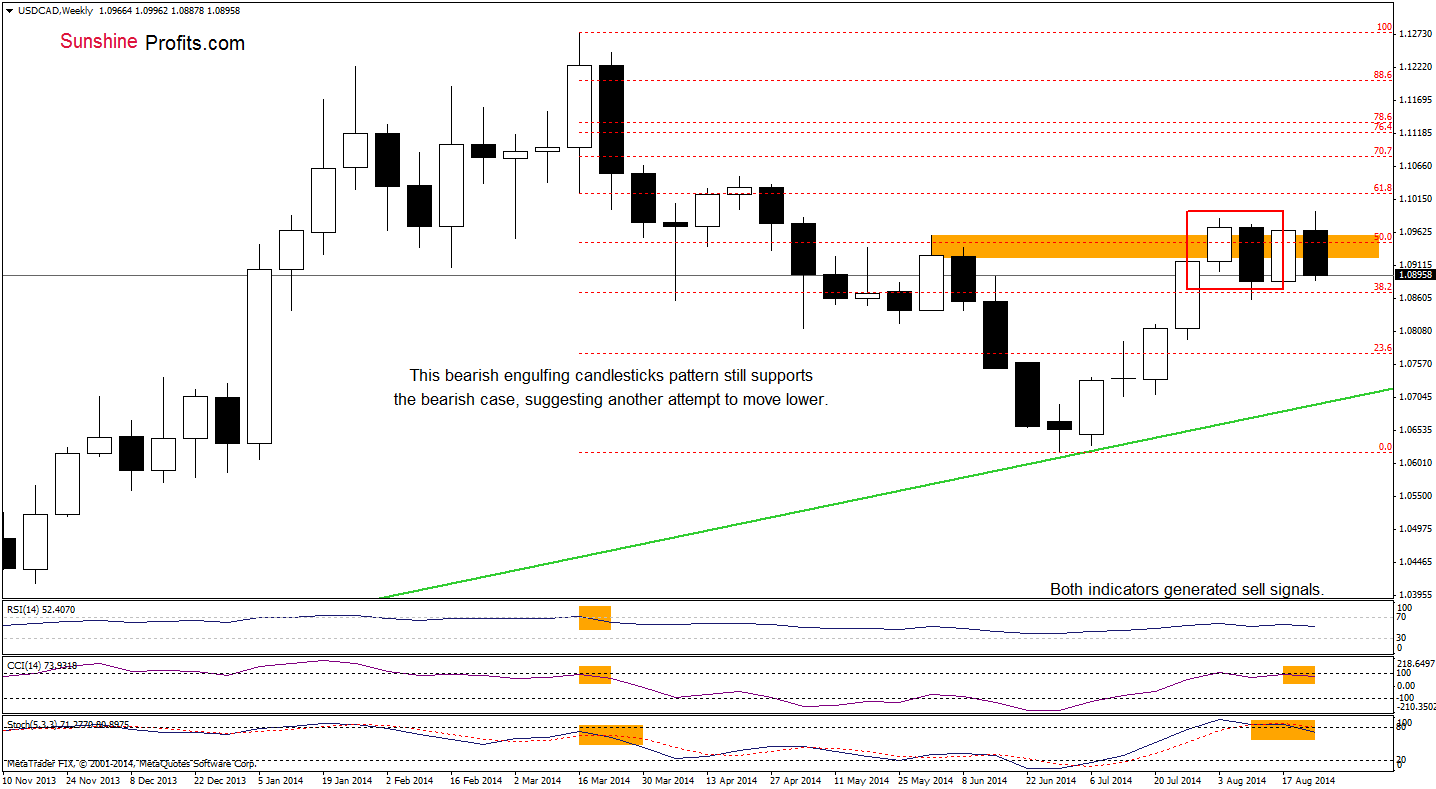
Although USD/CAD rebounded in the recent week, the situation in the medium term hasn’t changed much as a bearish engulfing candlesticks pattern still supports currency bears, suggesting another attempt to move lower in the coming week (or even weeks).
As you see on the weekly chart, the above-mentioned bearish candlesticks pattern in combination with sell signals generated by the indicators triggered a pullback in the recent days. How low could the exchange rate go?
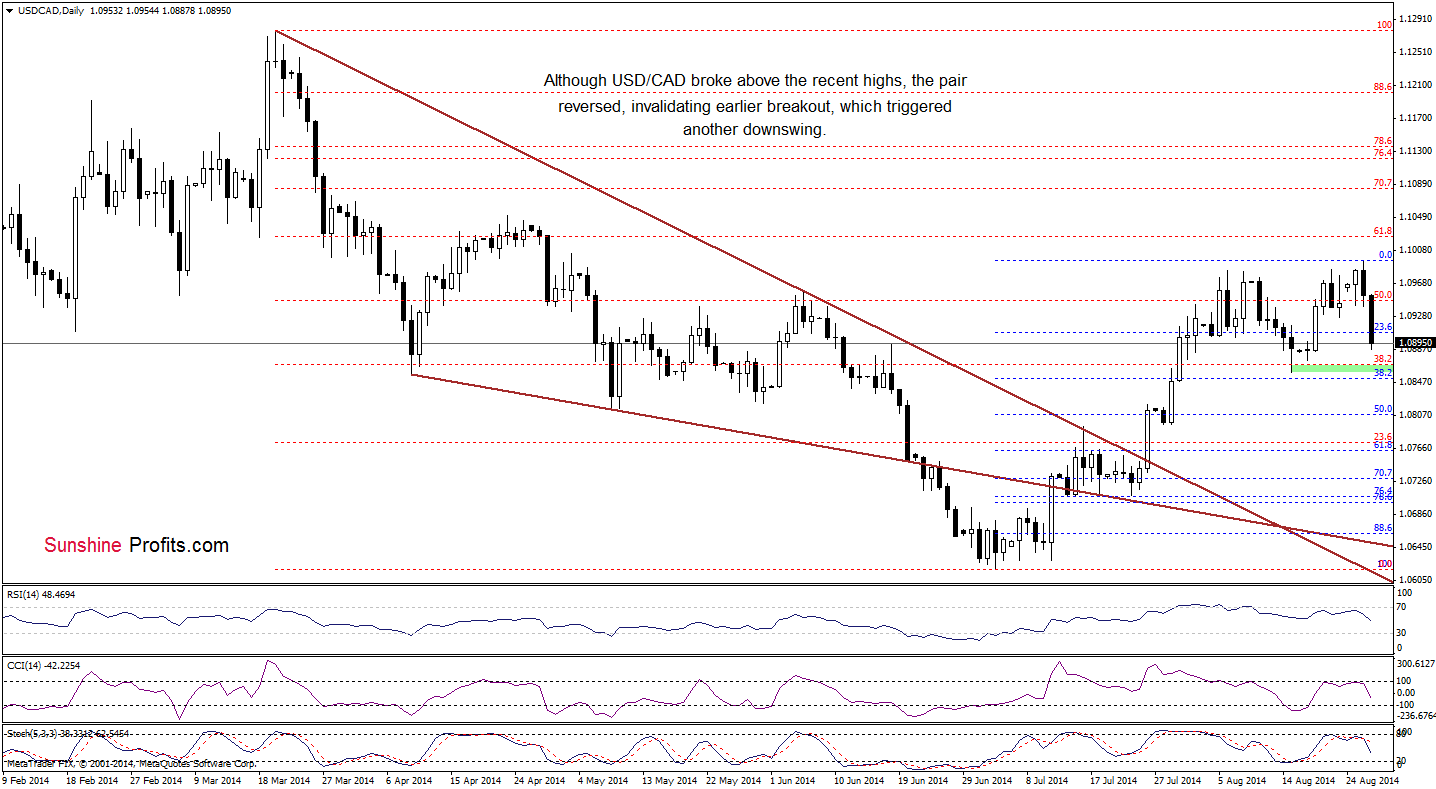
Taking into account the current situation in the very short-term (sell signals, which are still in play and another invalidation of the breakout ), we think that the best answer to this question is our last commentary on this currency pair:
(…) the first downside target will be the bottom of the recent correction (around 1.0860). At this point, it’s worth noting that the CCI and Stochastic Oscillator generated sell signals, which supports the bearish case at the moment.
Please note that if this support area holds, we’ll see a comeback to around the recent highs. However, if it is broken, the next downside target will be the 50% Fibonacci retracement based on the entire Jul-Aug rally (around 1.0807) reinforced by the bottom of a small correction that we saw at the end of July.
Very short-term outlook: bearish
Short-term outlook: mixed with bearish bias
MT outlook: mixed
LT outlook: bearish
Trading position (short-term): In our opinion no positions are justified from the risk/reward perspective. We will keep you informed should anything change, or should we see a confirmation/invalidation of the above.
AUD/USD
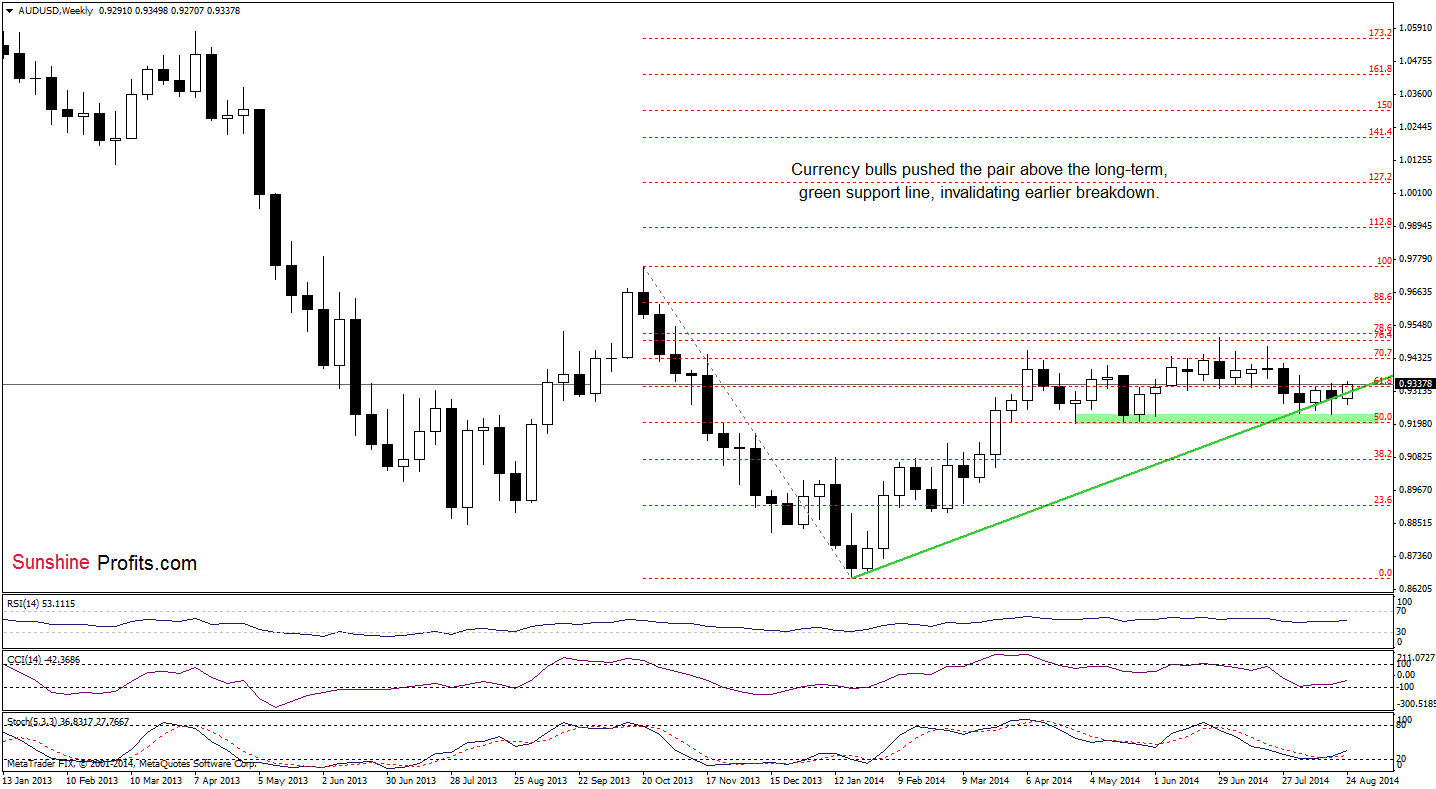
The medium-term picture has improved as AUD/USD invalidated the breakdown below the long-term green line. This is a bullish signal (especially when we factor in buy signals generated by the CCI and Stochastic Oscillator), which suggests futher rally. Will the daily chart give us more clues about the size of the upswing? Let’s check.
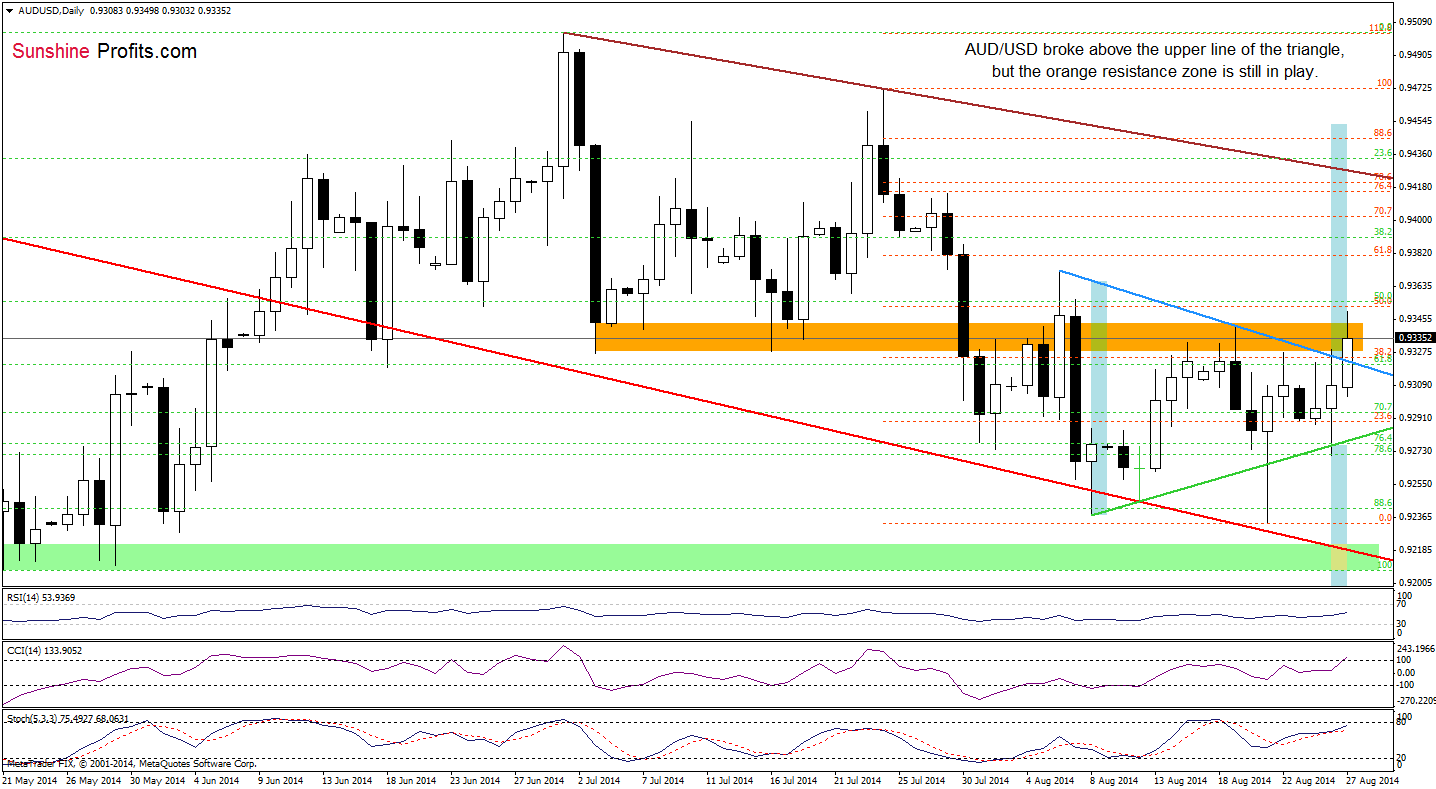
From this perspective, we see that AUD/USD broke above the upper line of the short-term triangle. Therefore, what we wrote yesterday is up-to-date:
(…) What could happen if currency bulls win? If the exchange rate breaks above the orange resistance line, we may see an increase to at least the brown declining resistance line (which is currently reinforced by the 76.4% and 78.6% Fibonacci retracements).
Please note that despite this improvement, we should keep an eye on the current position of the indicators. As you see, the CCI and Stochastic Oscillator are quite high, which suggests that if they generate sell signals, currency bulls may have a problem with a realization of the above-mentioned scenario.
Very short-term outlook: bullish
Short-term outlook: mixed with bullish bias
MT outlook: mixed
LT outlook: bearish
Trading position (short-term): In our opinion, no positions are justified from the risk/reward perspective. We will keep you informed should anything change, or should we see a confirmation/invalidation of the above.
Thank you.
Nadia Simmons
Forex & Oil Trading Strategist
Przemyslaw Radomski, CFA
Founder, Editor-in-chief
Gold & Silver Trading Alerts
Forex Trading Alerts
Oil Investment Updates
Oil Trading Alerts

