
Earlier today, the U.S. Commerce Department showed that total durable goods orders (with transportation items) rose by 22.6% last month, well above expectations for an increase of 7.5%. Despie this bullish data, core durable goods orders (wihout volatile transportation items) declined by 0.8% in July, missing forecasts for a 0.5% gain. As a result, the U.S. dollar moved lower against major currency pairs. Did this drop change the USD/CHF outlook?
In our opinion the following forex trading positions are justified - summary:
EUR/USD
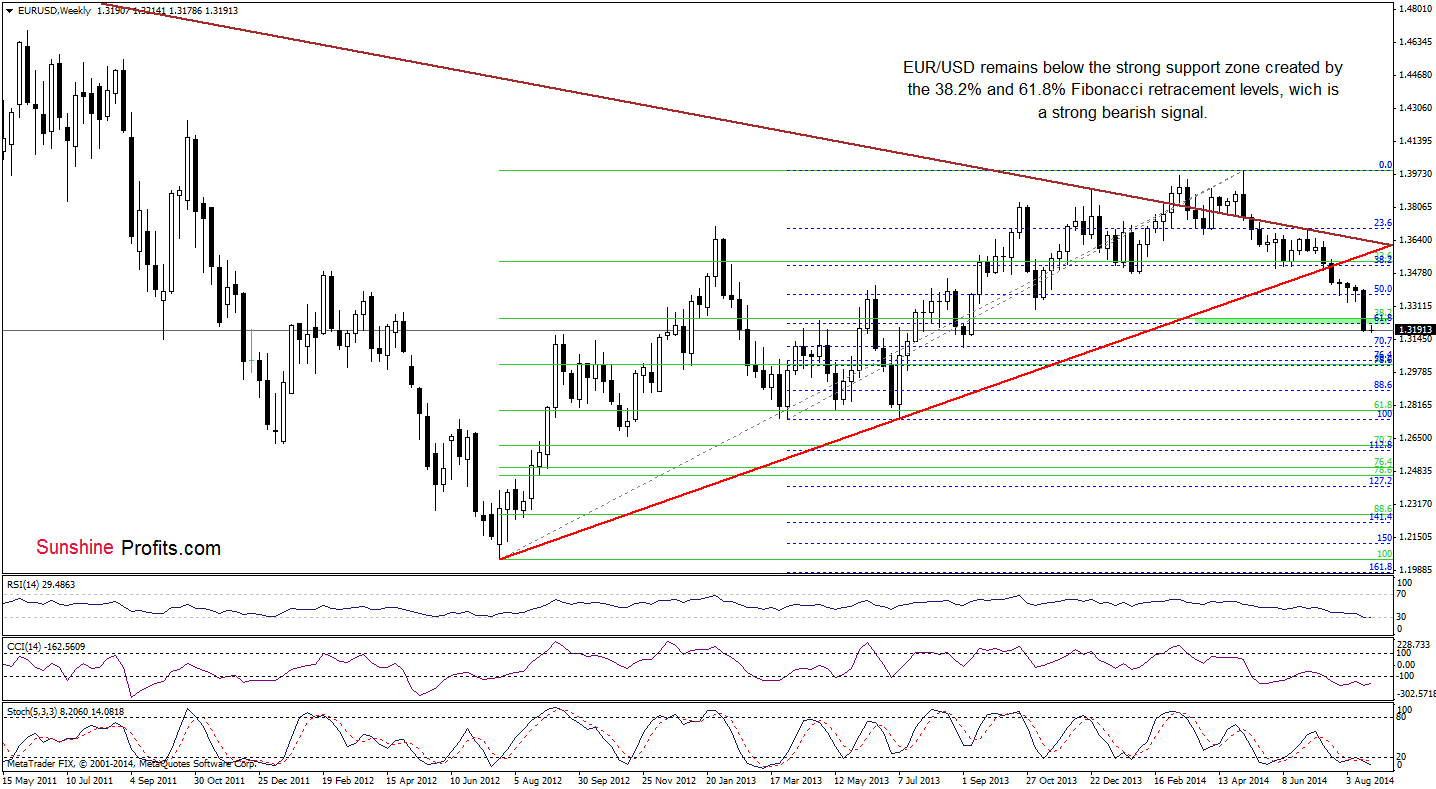
The medium-term picture hasn’t changed as EUR/USD is still trading slightly below the strong support zone created by the 38.2% and 61.8% Fibonacci retracement levels. Therefore, what we wrote yesterday is up-to-date:
(…) This is a strong bearish signal, which suggests further deterioration and a drop to around 1.3104-1.3109, were the 70.7% Fibonacci retracement meets the September low. (…) although the RSI declined to its lowest level since July 2012 (while the CCI and Stochastic Oscillator are oversold) suggesting a pause or corrective upswing, we should keep in mind that as long as there is no invalidation of the breakdown below the green area, another attempt to move lower can’t be ruled out.
Did the very short-term picture change? Let’s check.
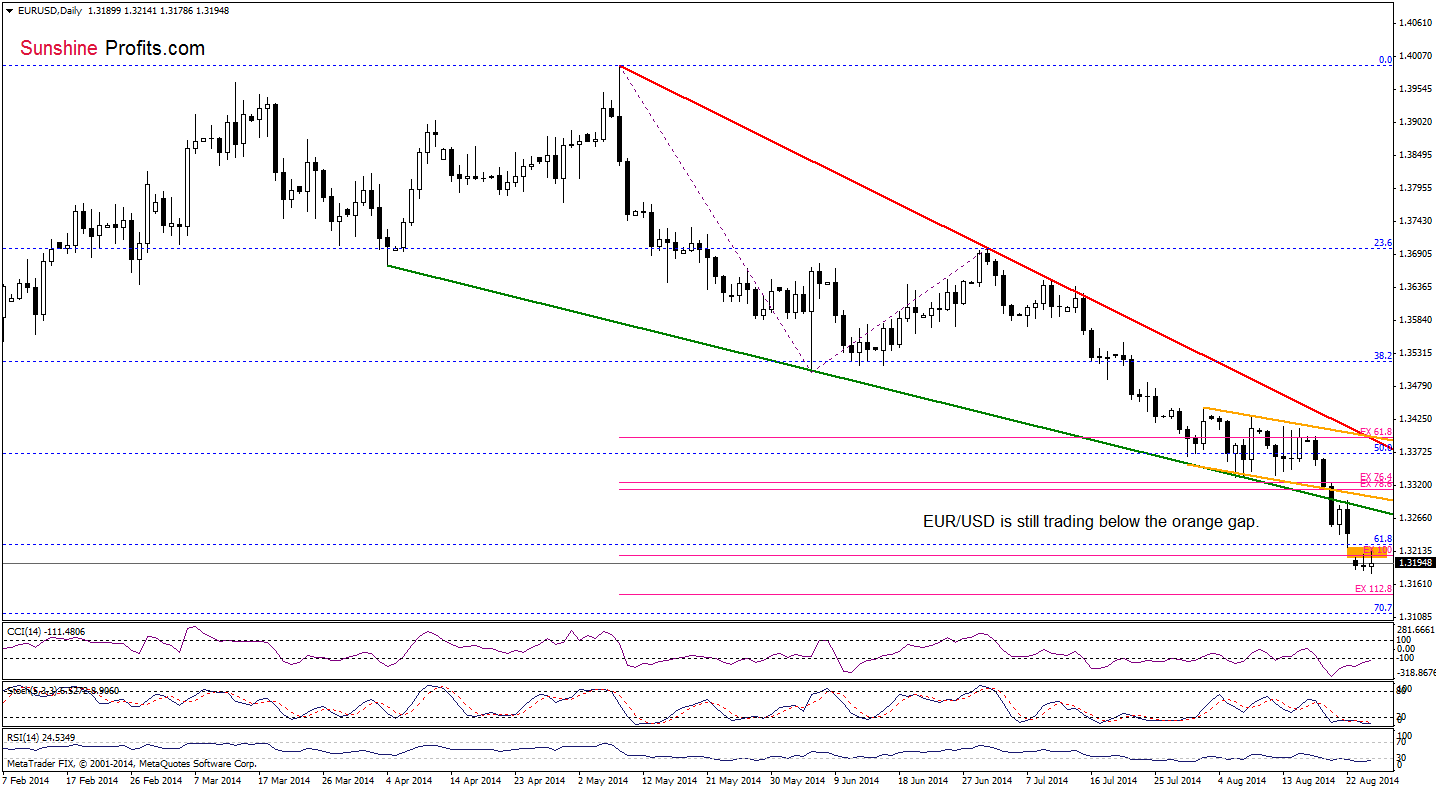
From this perspective, we see that EUR/USD moved lower and hit a fresh multi-month low. Although the pair rebounded in the following ours, the exchange rate still remains well below the previously-broken lower border of the declining wedge and also under the orange gap (reinforced by the 61.8% Fibonacci retracement and the 100% Fibonacci price projections). All the above provides us with bearish implications and means that as long as there is no invalidation of the breakdown below these levels, another downswing is quite likely. If this is the case, the initial downside target for currency bears will be 112.8% Fibonacci price projections (based on the May and July highs and the June low) around 1.3146. Nevertheless, we should keep in mind that all indicators are oversold and very close to generate buy signals, which suggests that the space for further might be limited and a corrective upswing is just around the corner.
Very short-term outlook: mixed
Short-term outlook: mixed
MT outlook: mixed
LT outlook: bearish
Trading position (short-term): In our opinion no positions are justified from the risk/reward perspective. We will keep you informed should anything change, or should we see a confirmation/invalidation of the above.
USD/CHF
The medium-term outlook hasn’t changed much as USD/CHF still remains above the reviously-broken 38.2% Fibonacci retracement (based on the entire May 2013-March 2014 decline) and the recent highs. Today, we’ll focus on the very short-term changes.
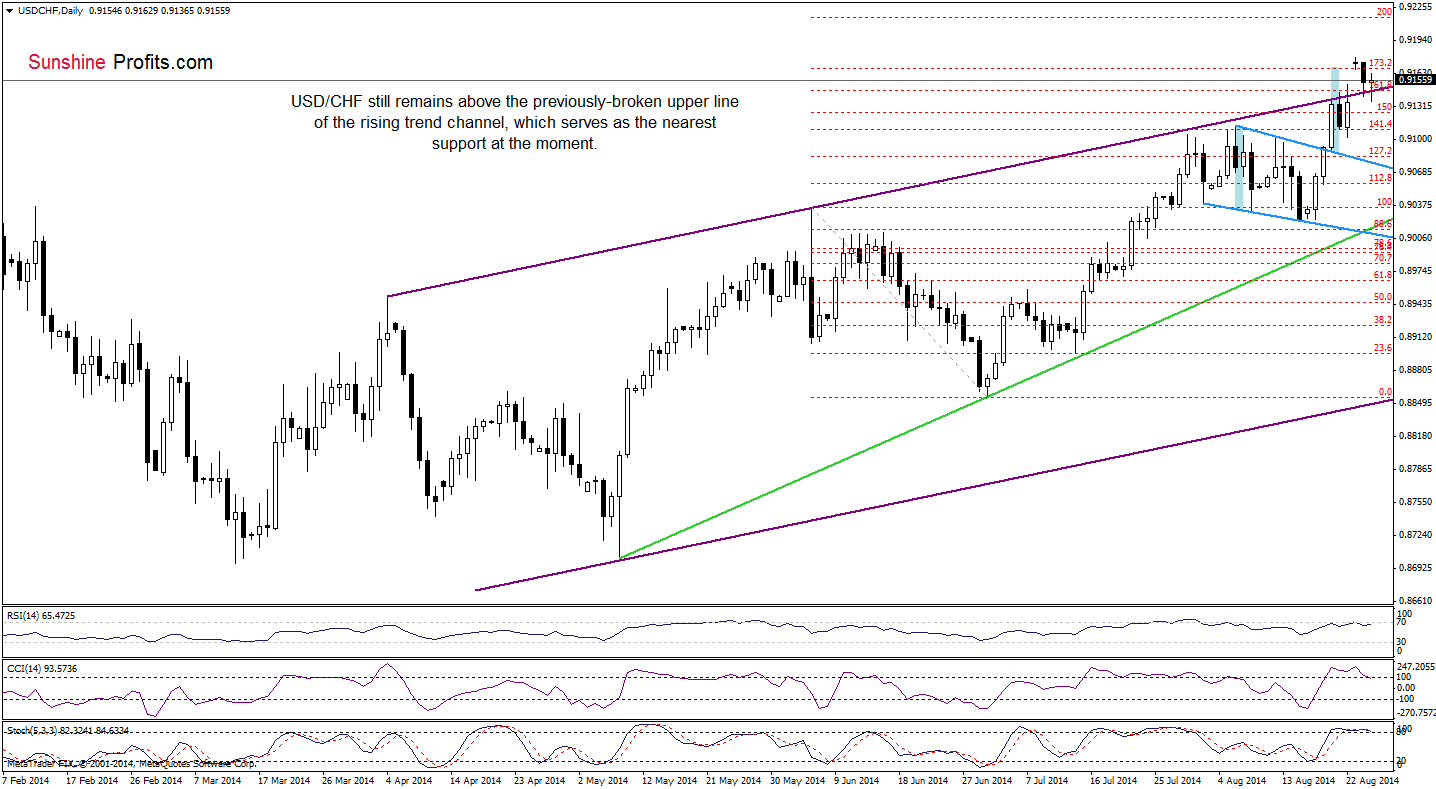
The first thing that catches the eye on the daily chart is a breakout above the upper line of the purple trend channel. This is a strong bullish signal, which suggests further improvement and an increase to the next Fibonacci extension around 0.9216. Nevertheless, we should keep in mind that the RSI approached the level of 70, while the CCI and Stochastic Oscillator are overbought and very close to generate sell signals. Additionally, the recent upswing took the pair to the 173.2% Fibonacci extension (which serves as a strong resistance) and the size of the move corresponds to the height of the blue declining trend channel, which may reduce a buying pressure. What does it mean for USD/CHF? If the pair closes the day above its major support line, we’ll read today’s earlier decline as a verification of the breakout. In this case, the exchange rate will move higher and currency bulls will likely realize their pro-growth scenario. On the other hand, if the pair invalidates the breakout, it will be a strong bearish signal, which will trigger further deterioration and a drop to at least 0.9081, where the previously-broken upper line of the declining blue trend channel is.
Very short-term outlook: mixed with bearish bias
Short-term outlook: mixed
MT outlook: mixed with bullish bias
LT outlook: bearish
Trading position (short-term): In our opinion no positions are justified from the risk/reward perspective. We will keep you informed should anything change, or should we see a confirmation/invalidation of the above.
AUD/USD
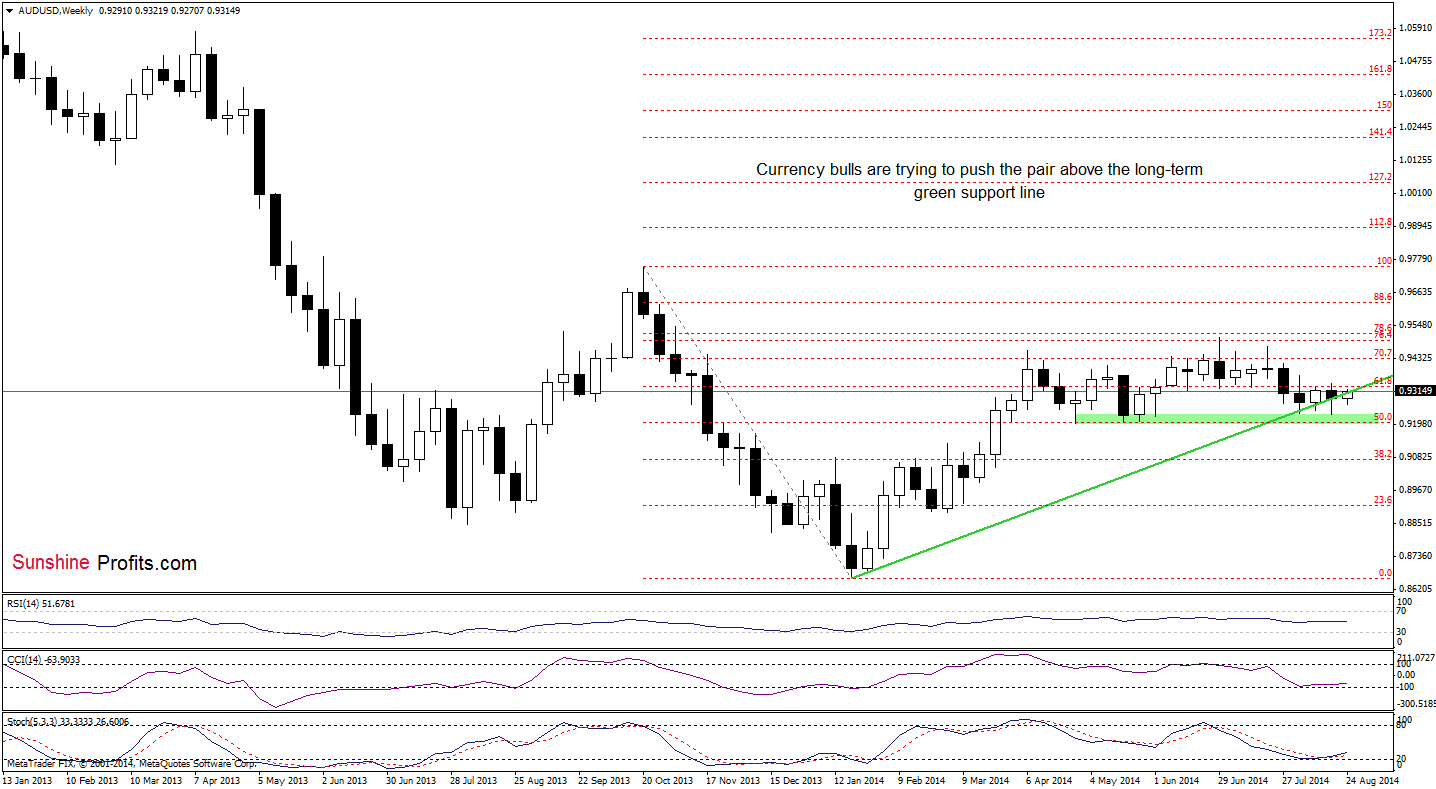
Although the medium-term picture has deteriorated in the previous week as AUD/USD declined below the long-term green line, currency bulls are trying to invalidate the breakdown and come back above the key support/resistance line. Will they succeed? Let’s move on to the daily chart and look for clues about the next move.
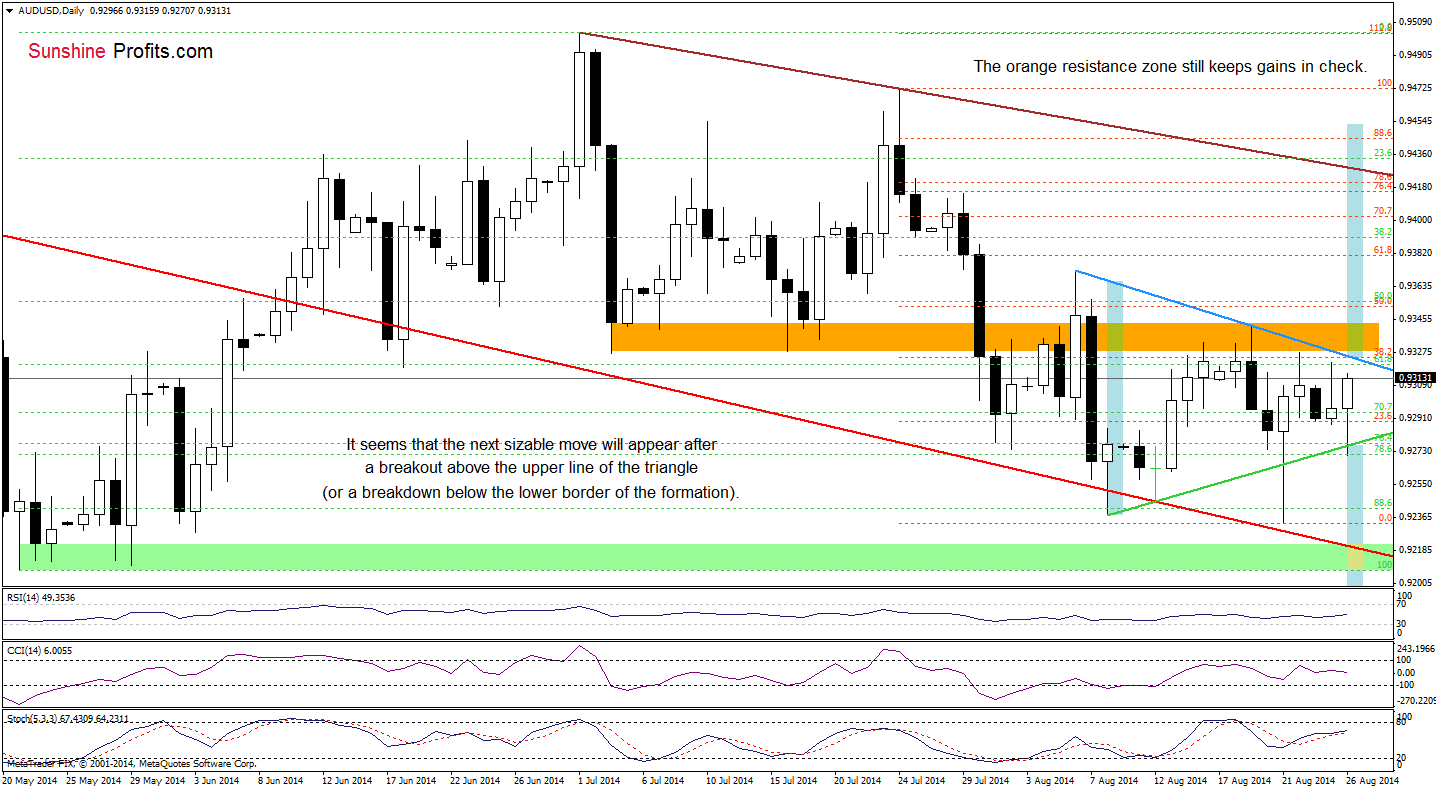
On Friday, we wrote the following:
(…) the exchange rate rebounded sharply and came back to slightly below the orange resistance zone (…) If this area holds, we’ll see another downswing and a test of the strength of the green support line (or even the recent low).
Looking at the daily chart, we see that the situation developed in line with the above-mentioned scenario and AUD/USD slipped to our downside target. Despite this move, the green support line withstood the selling pressure and the pair rebounded. As you see on the above chart, the exchange rate is trading in the short-term triangle. In our opinion, as long as there is no breakout above the upper line of the formation (or a successful breakdown below the lower border) another sizable move is not likely to be seen. What could happen if currency bulls win? If the exchange rate breaks above the orange resistance line, we may see an increase to at least the brown declining resistance line (which is currently reinforced by the 76.4% and 78.6% Fibonacci retracements). On the other hand, if currency bears show their claws and push the pair below the green support line, we’ll see a test of the strength of the red support line (currently around 0.9220).
Very short-term outlook: mixed
Short-term outlook: mixed
MT outlook: mixed
LT outlook: bearish
Trading position (short-term): In our opinion, no positions are justified from the risk/reward perspective. We will keep you informed should anything change, or should we see a confirmation/invalidation of the above.
Thank you.
Nadia Simmons
Forex & Oil Trading Strategist
Przemyslaw Radomski, CFA
Founder, Editor-in-chief
Gold & Silver Trading Alerts
Forex Trading Alerts
Oil Investment Updates
Oil Trading Alerts

