
Earlier today, the U.K. Office for National Statistics showed that the rate of CPI slowed to 1.6% last month, missing expectations for a reading of 1.8%. Additionally, month-over-month, CPI declined 0.3% in July, compared to expectations for a 0.2% decline. On top of that, core CPI (without food, energy, alcohol, and tobacco costs) rose by 1.8% last month, down from 2% in June, while analysts had expected a rise to 1.9% in July. Because of these disappointing numbers, GBP/USD declined to over a four month low and reached an important support level. Will it will be strong enough to stop currency bears’ charge?
In our opinion the following forex trading positions are justified - summary:
EUR/USD
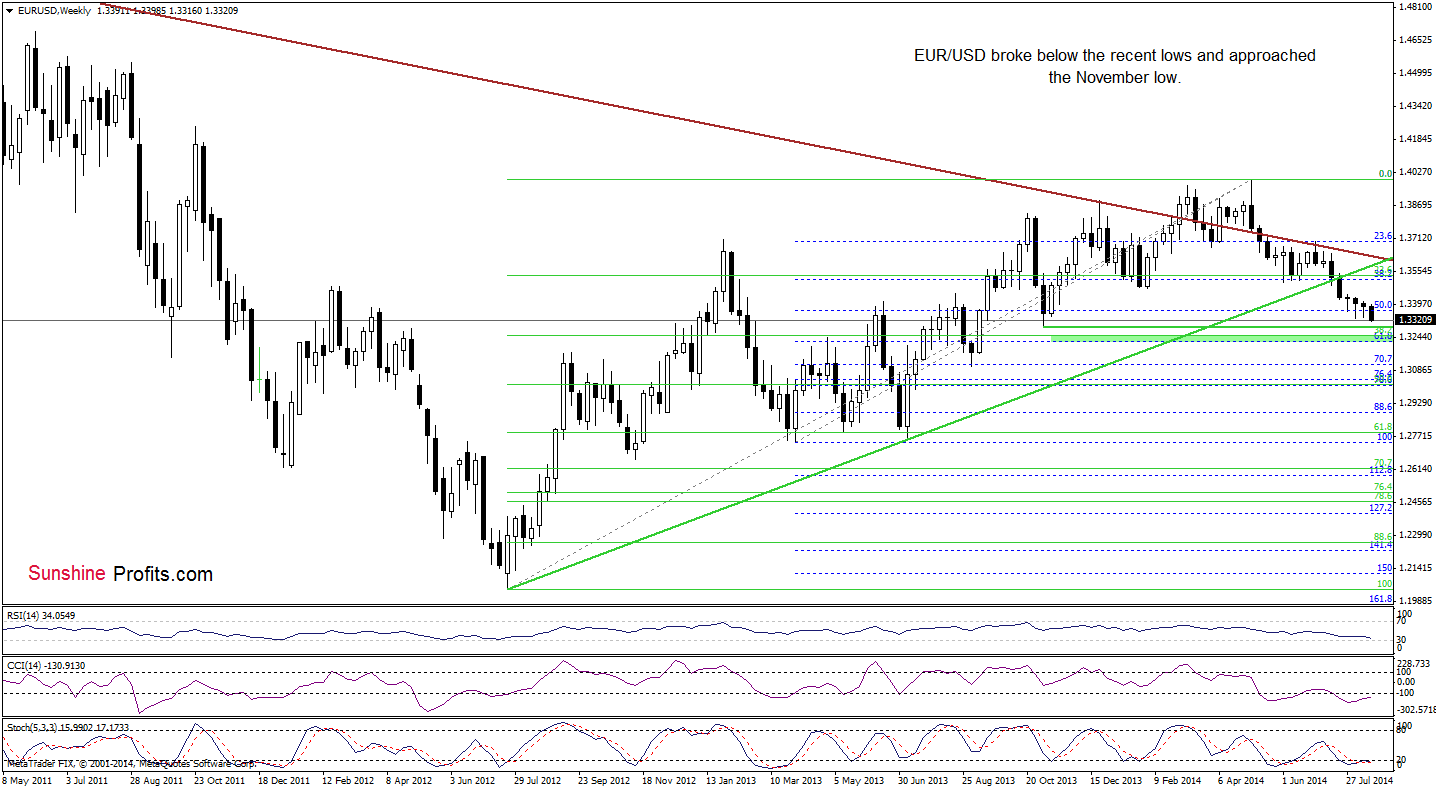
The situation in the medium term has deteriorated as EUR/USD extended losses and dropped below the recent lows. Despite this decline, the exchange rate still remains above the November low of 1.3295. If this support level withstand the selling pressure, we’ll see a rebound in the coming week or weeks. However, if currency bears show their claws and push the pair below it, EUR/USD will test the strength of the strong support zone created by the 38.2% Fibonacci retracement based on the entire 2012-2014 rally and 61.8% the next Fibonacci retracement (based on the March 2013-May 2014 increase) around 1.3222-1.3250.
Will the daily chart give us more clues about future moves? Let’s check.
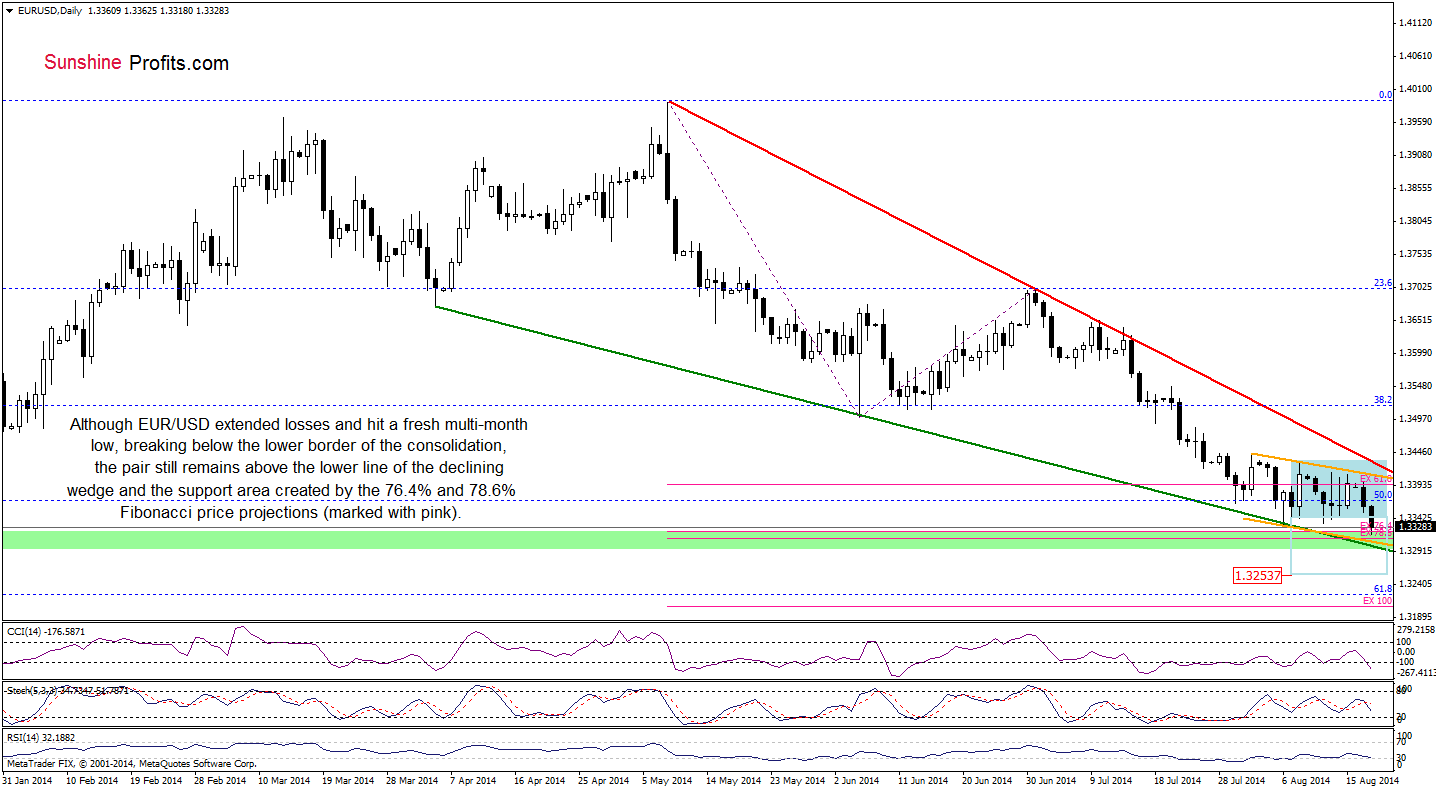
Earlier today, EUR/USD moved lower and broke below the lower border of the consolidation. With this downswing, the exchange rate also declined under the recent lows, hitting a fresh multi-month low. Although this is a bearish signal, it seems that the space for further declines might be limited by the strong support zone created by the lower border of the declining wedge, the 76.4% and 78.6% Fibonacci price projections (based on the May and July highs and the June low) and also the November low. If the combination of these support lines holds, the exchange rate will rebound in the coming days and the first upside target will be the orange resistance line based on the recent highs (currently around 1.3410). At this point, it’s worth noting that this area is also reinforced by the upper line of the declining wedge at the moment. Nevertheless, if the pair drops below its major support zone, this will be a very strong bearish signal that will trigger further deterioration and another sizable downward move.
Very short-term outlook: mixed
Short-term outlook: mixed
MT outlook: mixed
LT outlook: bearish
Trading position (short-term): In our opinion no positions are justified from the risk/reward perspective. We will keep you informed should anything change, or should we see a confirmation/invalidation of the above.
GBP/USD
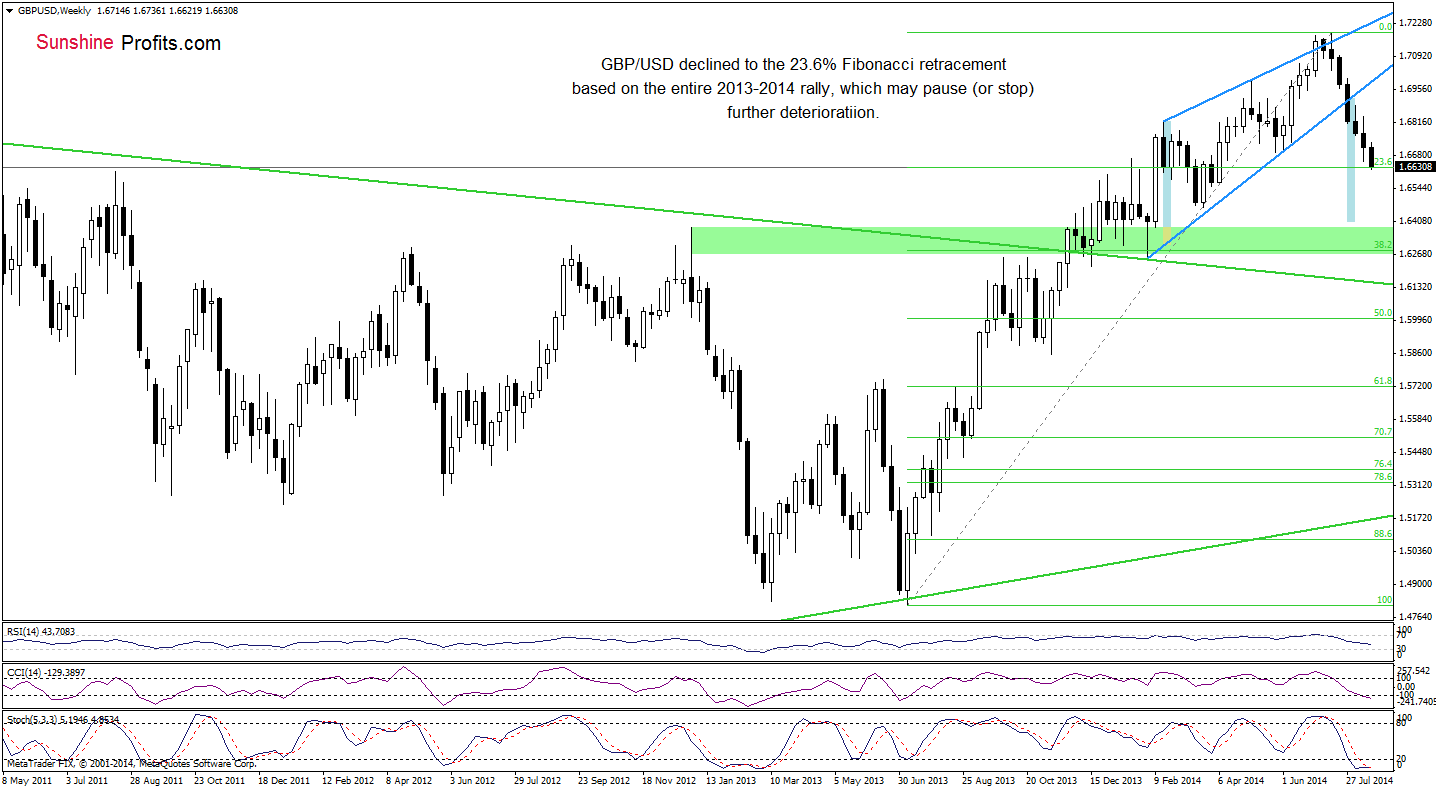
On the above chart, we see that the medium-term situation has deteriorated as GBP/USD came back below the support zone (which currently serves as the nearest resistance) created by the May and July lows. With this downward move, the pair reached the 23.6% Fibonacci retracement level based on the entire 2013-2014 rally. This is the point where we should consider two scenarios. On one hand, if the exchange rate breaks below it, we’ll further deterioration and a drop to around 1.6408, were the size of the correction will correspond to the height of the rising wedge. On the other hand, if the support level encourages forex traders to push the buy button, the pair will rebound from here and we’ll see an increase to at least the nearest resistance zone (around 1.6691-1.6737).
Can we infer something more from the daily chart? Let’s check.
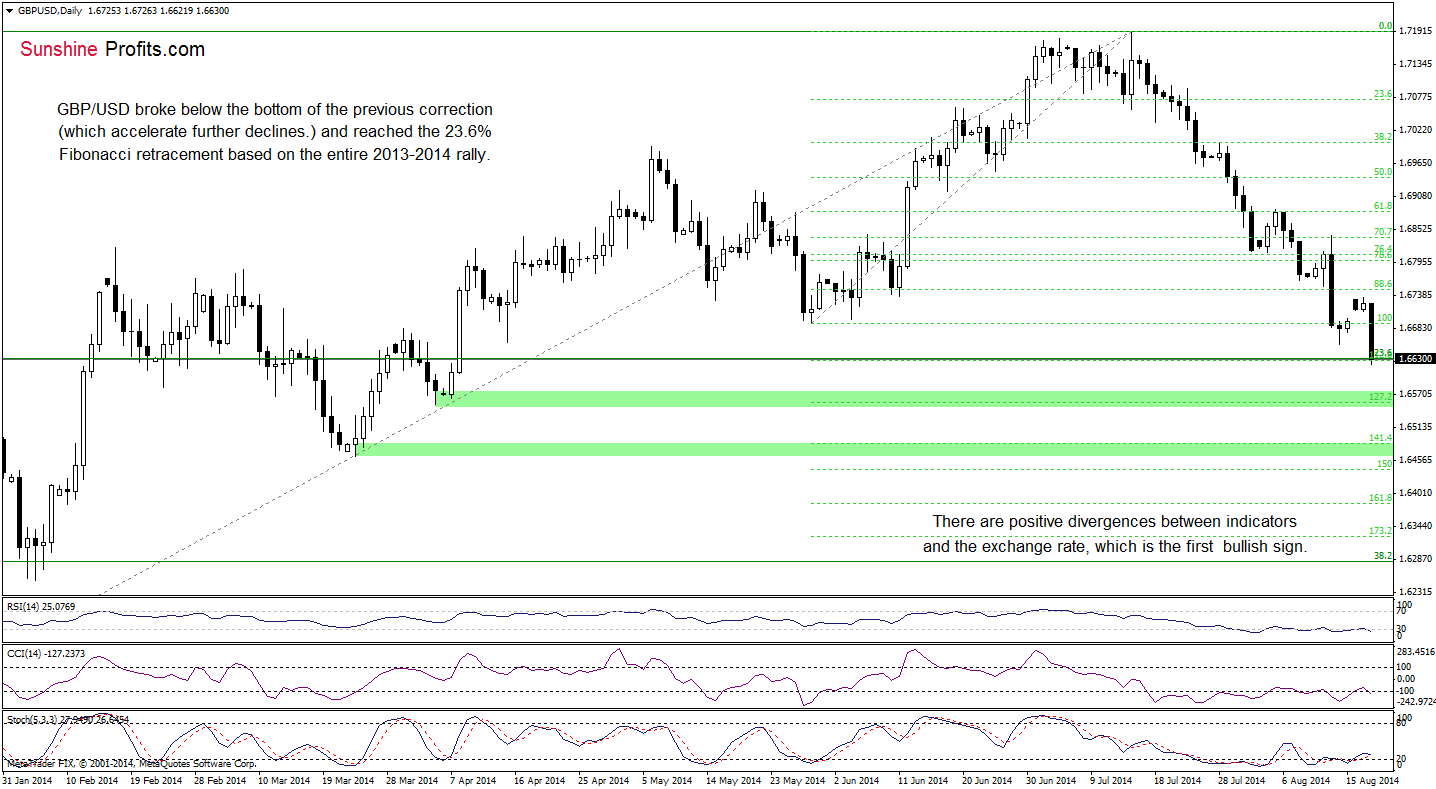
From this perspective, we see that the very short-term situation has deteriorated once again as GBP/USD broke below the support level created the May low. As we have pointed out before, the recent downswing took the pair to the 23.6% Fibonacci retracement, which suggests that the pair could go both north and south from here. If currency bulls win, we’ll see an increase to at least the last week’s high of 1.6842. However, if this important support level is broken, the next downside target will be the support zone created by the April low and the 127.2% Fibonacci extension (based on the May-July rally) or even the March low, which corresponds to the next Fibonacci extension. Please note that there are positive divergences between the indicators and the exchange rate, which suggests that corrective upswing is just around the corner.
Very short-term outlook: mixed
Short-term outlook: mixed
MT outlook: bearish
LT outlook: mixed
Trading position (short-term): In our opinion, no positions are justified from the risk/reward perspective. We will keep you informed should anything change, or should we see a confirmation/invalidation of the above.
USD/CHF
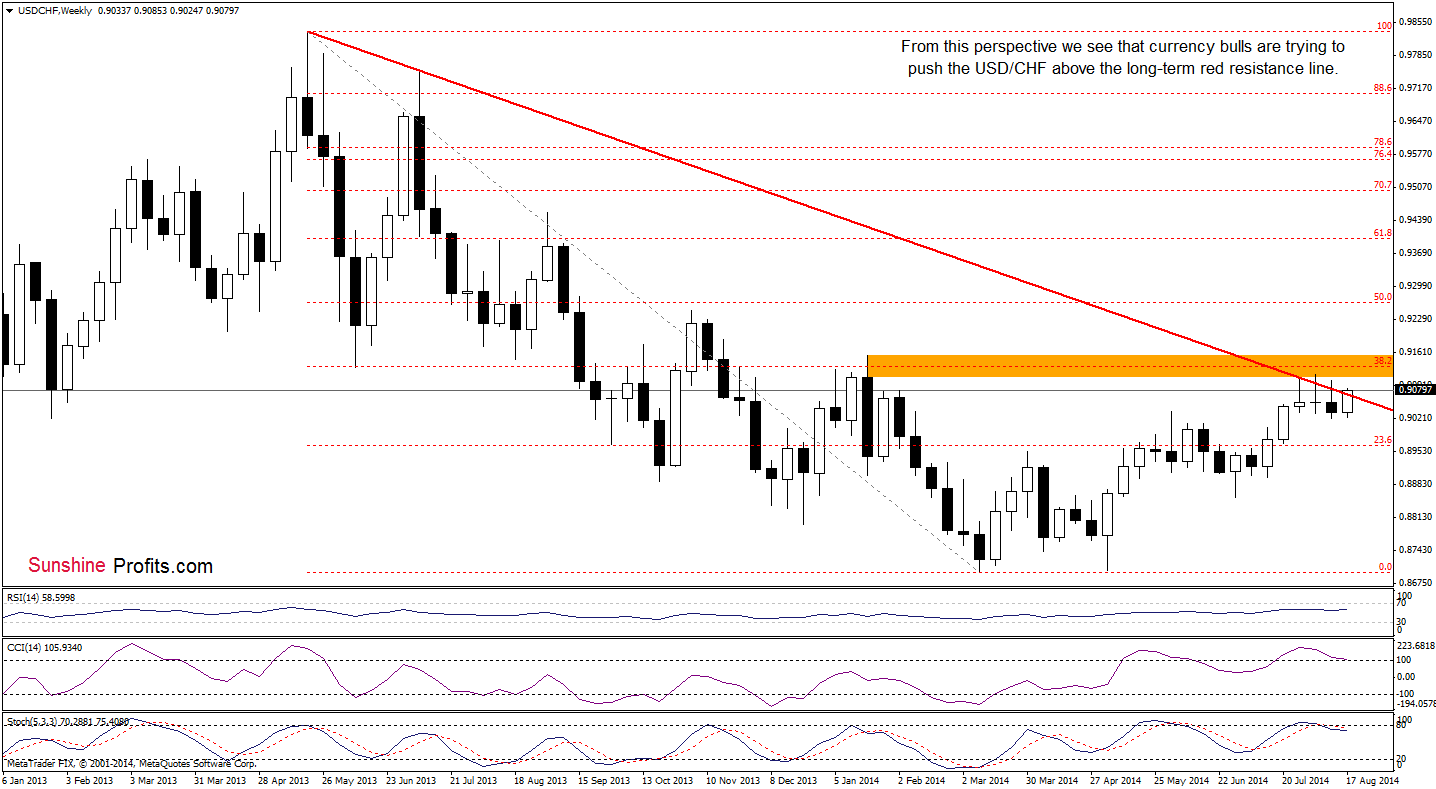
The medium-term picture remains unchanged as USD/CHF is still trading near July and August highs, slightly below the 38.2% Fibonacci retracement based on the entire May 2013-March 2014 decline. As you see on the above chart, this area is also reinforced by the long-term declining resistance line. In the previous months, this key-resistance line successfully stopped further improvement, which suggests that we may see similar price action in the coming week (especially when we factor in the current position of the indicators – the Stochastic Oscillator generated a sell signal, while the CCI is very close to doing it). Nevertheless, if currency bulls do not give up and USD/CHF moves higher, the next upside target will be the 38.2% Fibonacci retracement or even the 2014 high of 0.9155.
Having say that, let’s focus on the very short-term changes.
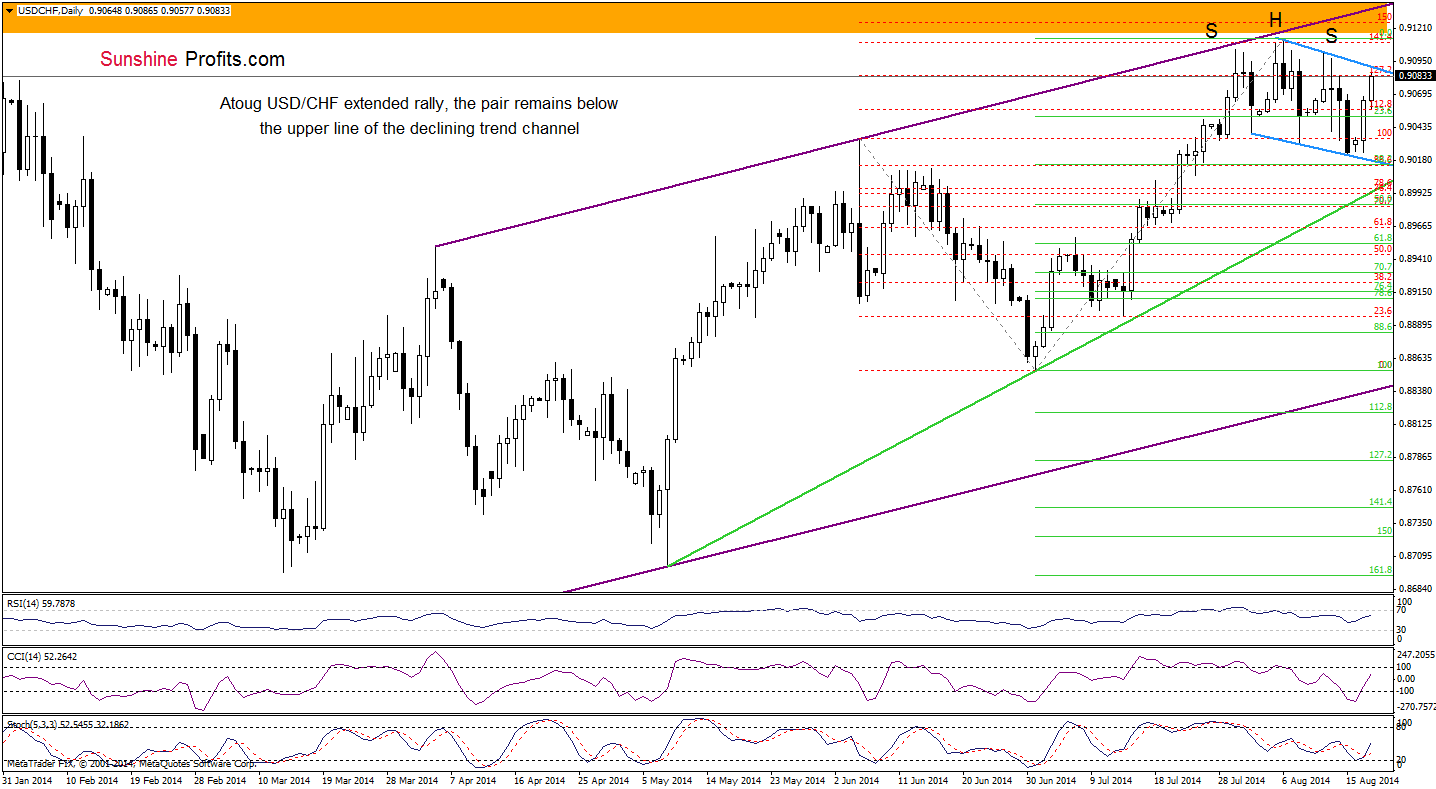
Looking at the above chart, we see that although USD/CHF bounced off the lower border of the declining trend channel (which is also the neck line of a potential head and shoulders formation), the pair still remains below the upper line of the formation (this area is also reinforced by the 127.2% Fibonacci extension and the recent highs). Taking this fact into account, we think that as long as there is no breakout or a breakdown above/below one of these lines, another sizable move is not likely to be seen. At this point you may wonder what could happen if we see a breakout as buy signals generated by the CCI and Stochastic Oscillator remain in place. In our opinion, even if the pair moves higher, the upper line of the medium-term rising trend channel (marked in purple) will likely stop further improvement – similarly to what we saw at the beginning of the month. And what if currency bears win? In this case, they will have to push the pair below the medium-term green support line before we see further deterioration.
Very short-term outlook: mixed
Short-term outlook: mixed
MT outlook: mixed with bullish bias
LT outlook: bearish
Trading position (short-term): In our opinion no positions are justified from the risk/reward perspective. We will keep you informed should anything change, or should we see a confirmation/invalidation of the above.
Thank you.
Nadia Simmons
Forex & Oil Trading Strategist
Przemyslaw Radomski, CFA
Founder, Editor-in-chief
Gold & Silver Trading Alerts
Forex Trading Alerts
Oil Investment Updates
Oil Trading Alerts

