
Earlier today, official data showed that Canada's foreign securities purchases dropped by C$1.07 billion in June, missing expectations for a C$14.68 billion increase. As a result, USD/CAD bounced of the recent lows, but did this upswing change anything in the short-term outlook?
In our opinion the following forex trading positions are justified - summary:
EUR/USD
The situation in the medium term hasn’t change much as EUR/USD is still trading slightly above the green support zone. Today, we’ll focus on the daily chart once again.
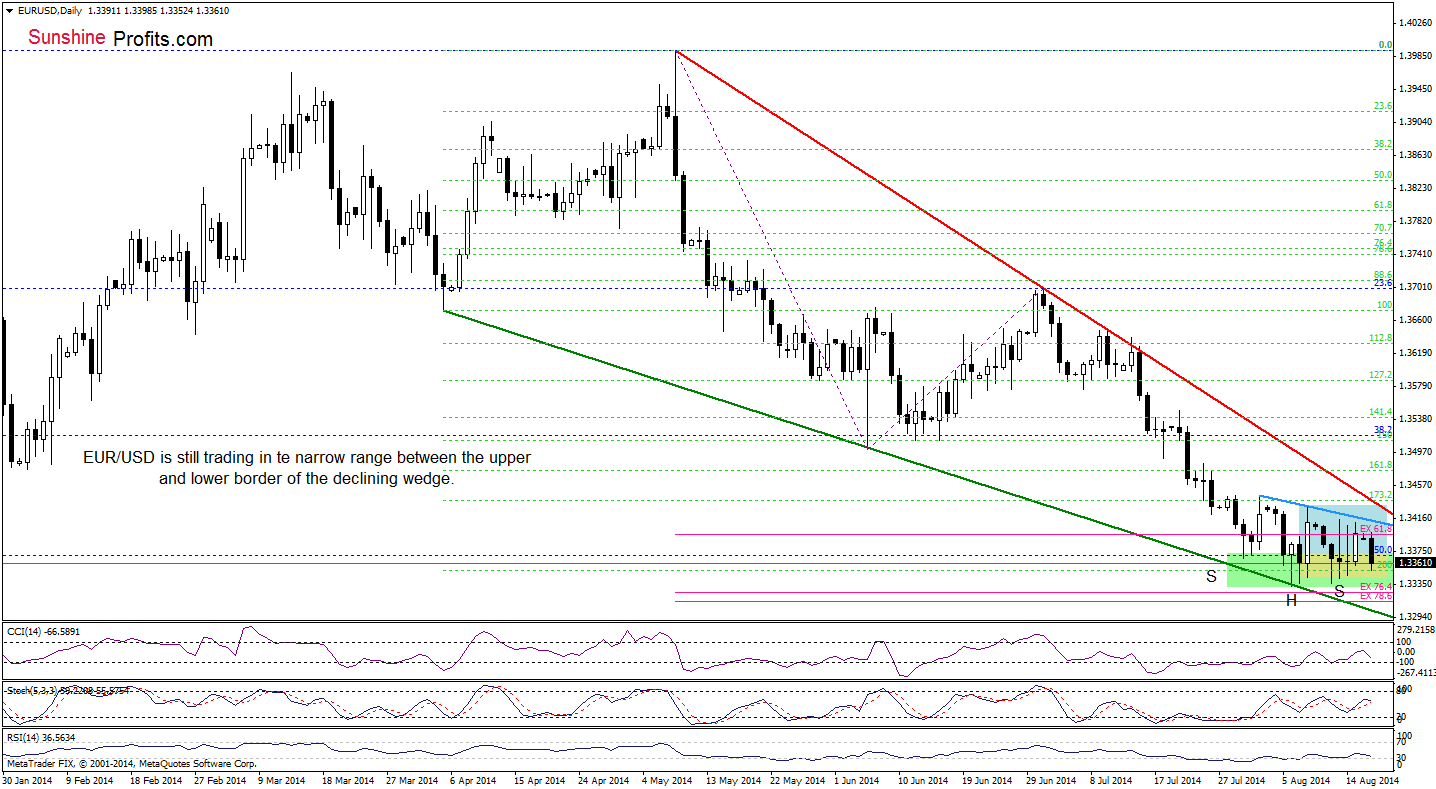
Although EUR/USD moved lower earlier today, the situation in the very short term remains unchanged as the exchange rate is still trading in the consolidation range. Therefore, our commentary from last Monday is up-to-date:
The first thing that catches the eye on the above chart is a declining wedge created by the red resistance (based on the May and July highs) and green support lines. (…) the upper line of the formation is reinforced by the 38.2% Fibonacci retracement based on the recent declines and the lower border intersects the green support zone. Therefore, even if we see a breakout above the upper line of the consolidation (or a breakdown below the lower border), the space for further moves will be limited by one of these lines. Taking this fact into account, we are convinced that as long as there is no breakout or breakdown above/below one of these areas, another sizable move is not likely to be seen.
Before we take a closer look at the next currency pair, we would like to draw your attention to a potential reverse head and shoulders formation. If this is the case, and the pair is building a right shoulder at the moment, we may see a trend reversal in the near future.
Very short-term outlook: mixed
Short-term outlook: mixed
MT outlook: mixed
LT outlook: bearish
Trading position (short-term): In our opinion no positions are justified from the risk/reward perspective. We will keep you informed should anything change, or should we see a confirmation/invalidation of the above.
USD/CAD
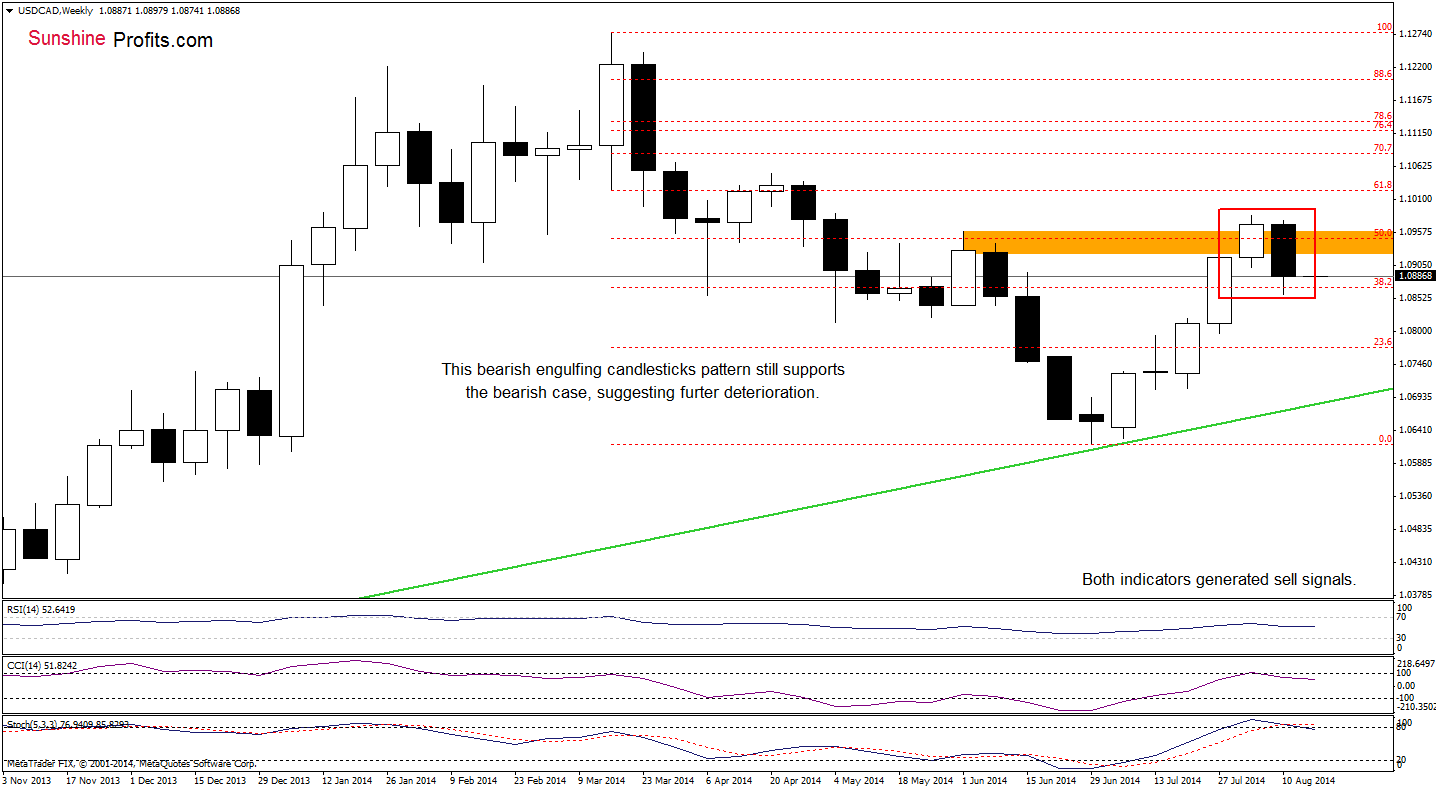
The situation in the medium term remains unchanged as USD/CAD is trading slightly above the last week’s low. Nevertheless, we should keep in mind that the previous candlesticks formed a bearish engulfing pattern,which supports currency bears, suggesting further deterioration in the coming week (or even weeks). Will the daily chart give us more clues about future moves? Let’s check.
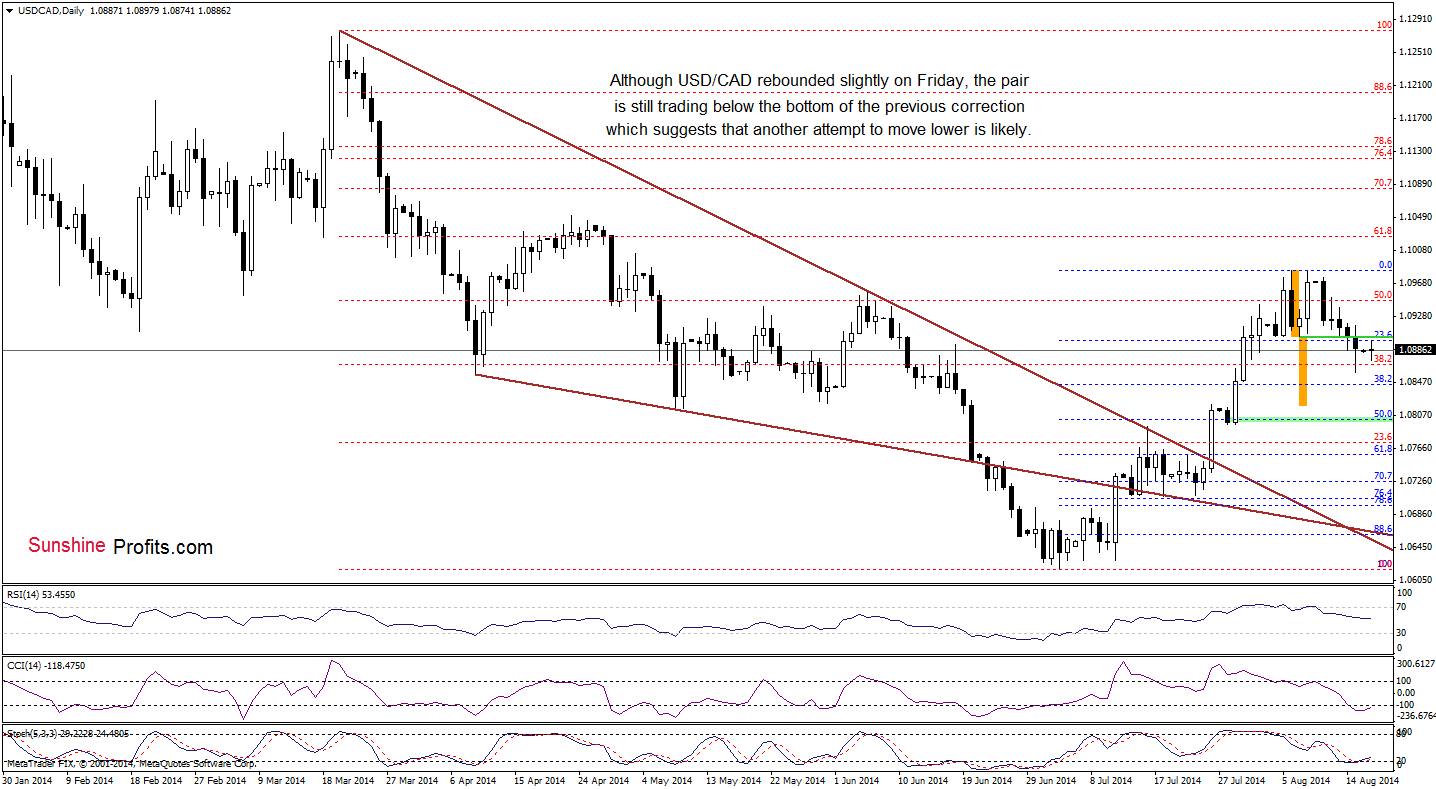
Looking at the above chart, we see that USD/CAD rebounded slightly on Friday, but despite this move, the exchange rate remains below the resistance level created by the bottom of the recent correction at 1.0902. In our opinion, as long as there is no invalidation of the breakdown below this line, another attempt to move lower is likely. Therefore, our last commentary on this currency pair is up-to-date:
(…) we may see a double top formation (…). If this is the case, we’ll see further deterioration and a decline to around 1.0820, where the size of the downswing will correspond to the height of the formation. At this point, it’s worth noting that before currency realize this scenario, they will have to push USD/CAD below the 38.2% Fibonacci retracement (around 1.0844) based on the entire June-Aug rally.
Very short-term outlook: mixed with bearish bias
Short-term outlook: mixed with bearish bias
MT outlook: mixed
LT outlook: bearish
Trading position (short-term): In our opinion no positions are justified from the risk/reward perspective. We will keep you informed should anything change, or should we see a confirmation/invalidation of the above.
AUD/USD
The medium-term picture hasn’t changed much as AUD/USD still remains between the long-term green line and the previously-broken lower border of the consolidation. Today, we’ll focus on the very short-term changes.
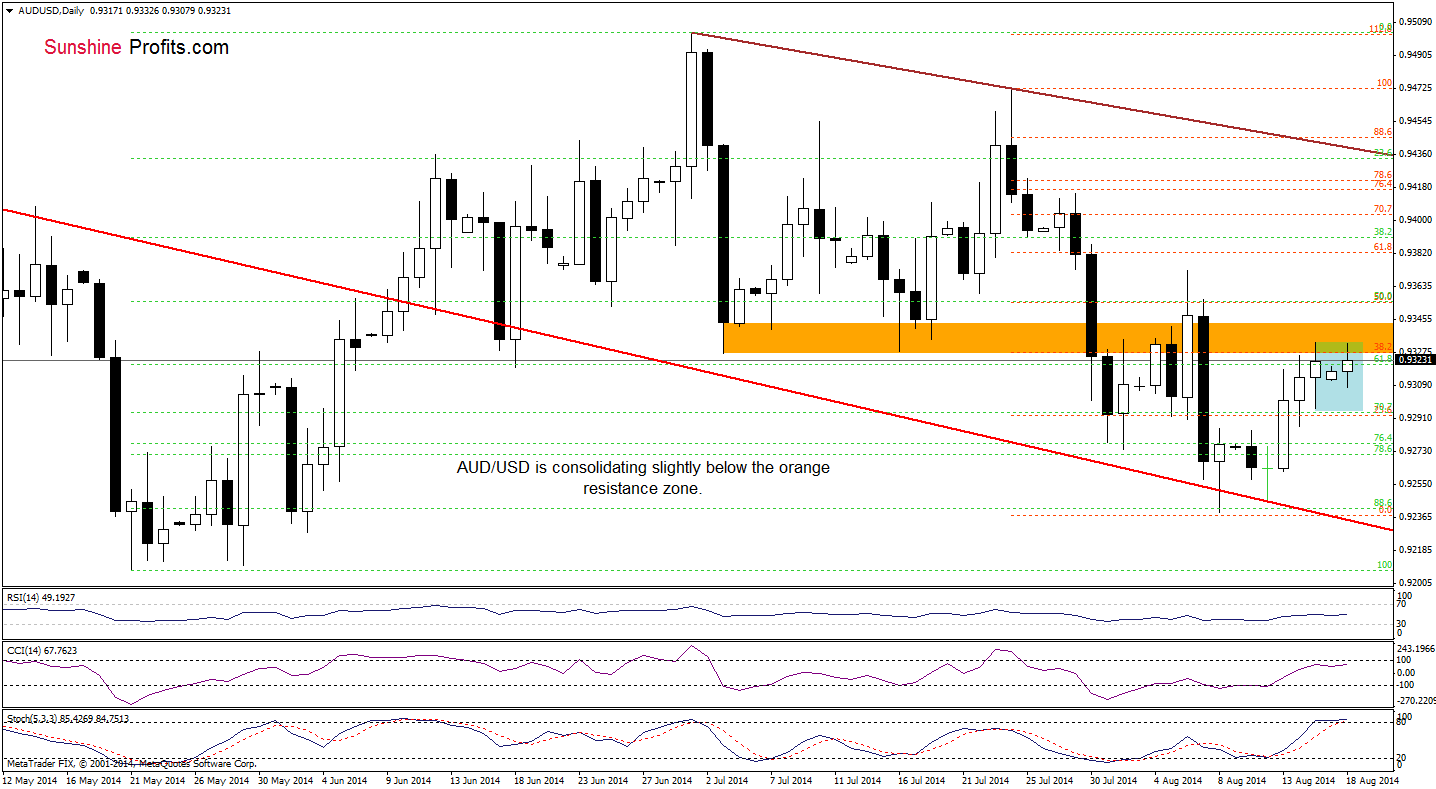
From this perspective, we see that although the situation has improved recently, the pair is still trading slightly below the orange resistance zone created by the 38.2% Fibonacci retracement level and the July lows. If it holds, the exchange rate will decline from here in the near future – especially if the indicators generate sell signals. In this case, the first downside target will be the Friday’s low of 0.9296, which is also the lower border of the consolidation. Nevertheless, if the resistance area is broken, the next upside target for currency bulls will be around 0.9350, where the next Fibonacci retracement level and the Aug 7 high are.
Very short-term outlook: mixed
Short-term outlook: mixed
MT outlook: mixed
LT outlook: bearish
Trading position (short-term): In our opinion, no positions are justified from the risk/reward perspective. We will keep you informed should anything change, or should we see a confirmation/invalidation of the above.
Thank you.
Nadia Simmons
Forex & Oil Trading Strategist
Przemyslaw Radomski, CFA
Founder, Editor-in-chief
Gold & Silver Trading Alerts
Forex Trading Alerts
Oil Investment Updates
Oil Trading Alerts

