
Earlier today, the Bank of England cut its forecast for U.K. wage growth in half, which pushed the British pound to a ten-week low against the greenback. With this downward move the pair reached another support zone. Will it manage to stop currency bears’ charge?
In our opinion the following forex trading positions are justified - summary:
EUR/USD
The situation in the medium term hasn’t change much as EUR/USD is still trading slightly above the green support zone. Today, we’ll take a closer look at the daily chart.
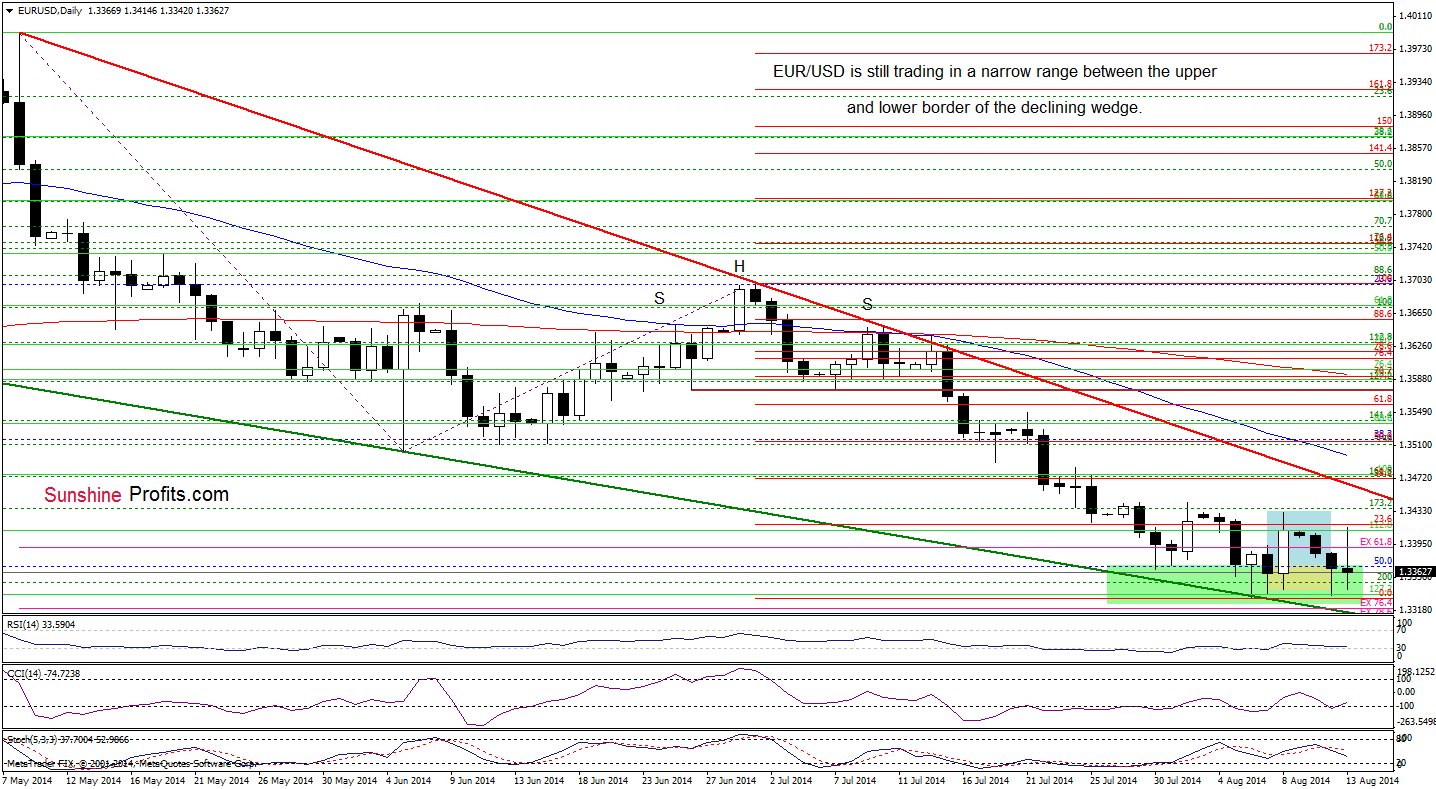
Looking at the above chart, we see that the situation in the very short term also hasn’t changed much as EUR/USD remains in the consolidation range. Therefore, our commentary from Monday is up-to-date:
The first thing that catches the eye on the above chart is a declining wedge created by the red resistance (based on the May and July highs) and green support lines. (…) the upper line of the formation is reinforced by the 38.2% Fibonacci retracement based on the recent declines and the lower border intersects the green support zone. Therefore, even if we see a breakout above the upper line of the consolidation (or a breakdown below the lower border), the space for further moves will be limited by one of these lines. Taking this fact into account, we are convinced that as long as there is no breakout or breakdown above/below one of these areas, another sizable move is not likely to be seen.
Very short-term outlook: mixed
Short-term outlook: mixed
MT outlook: mixed
LT outlook: bearish
Trading position (short-term): In our opinion no positions are justified from the risk/reward perspective. We will keep you informed should anything change, or should we see a confirmation/invalidation of the above.
GBP/USD
In our Forex Trading Alert posted on Friday, we wrote the following:
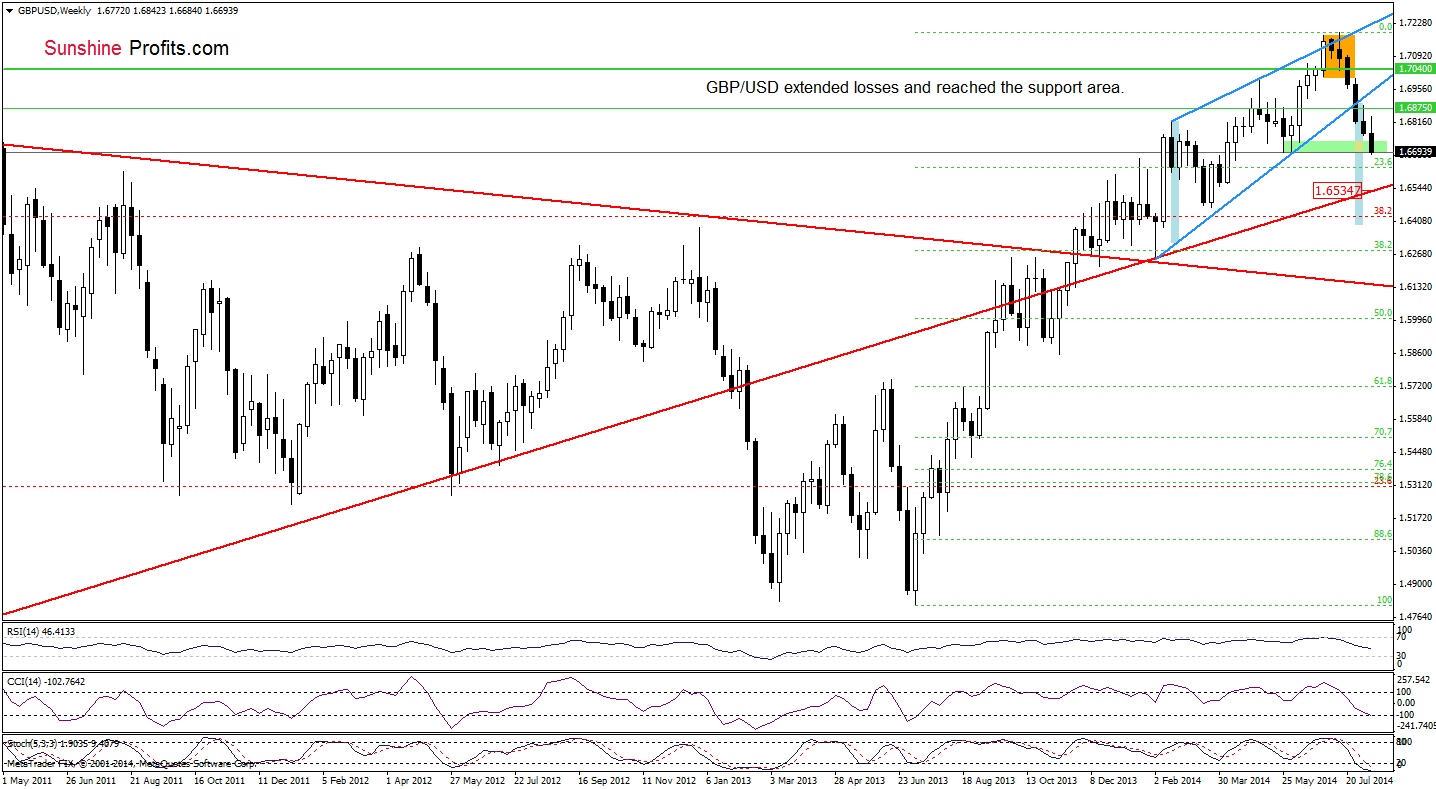
(…) the pair is still trading below the lower border of the rising wedge, which is a bearish signal that suggests further deterioration. (…) the next downside target will be the support zone created by the May and June lows (around 1.6692-1.6766).
On the above chart, we see that the situation developed in line with the above-mentioned bearish scenario as GBP/USD reached our downside target. What’s next for this currency pair? If the support area withstand the selling pressure, we’ll see a rebound from here and an attempt to comeback to the rising wedge. However, if currency bears show their claws once again and manage to push the exchange rate lower, the pair will test the strength of the long-term red support line (currently around 1.6535).
What can we infer from the daily chart? Let’s check.
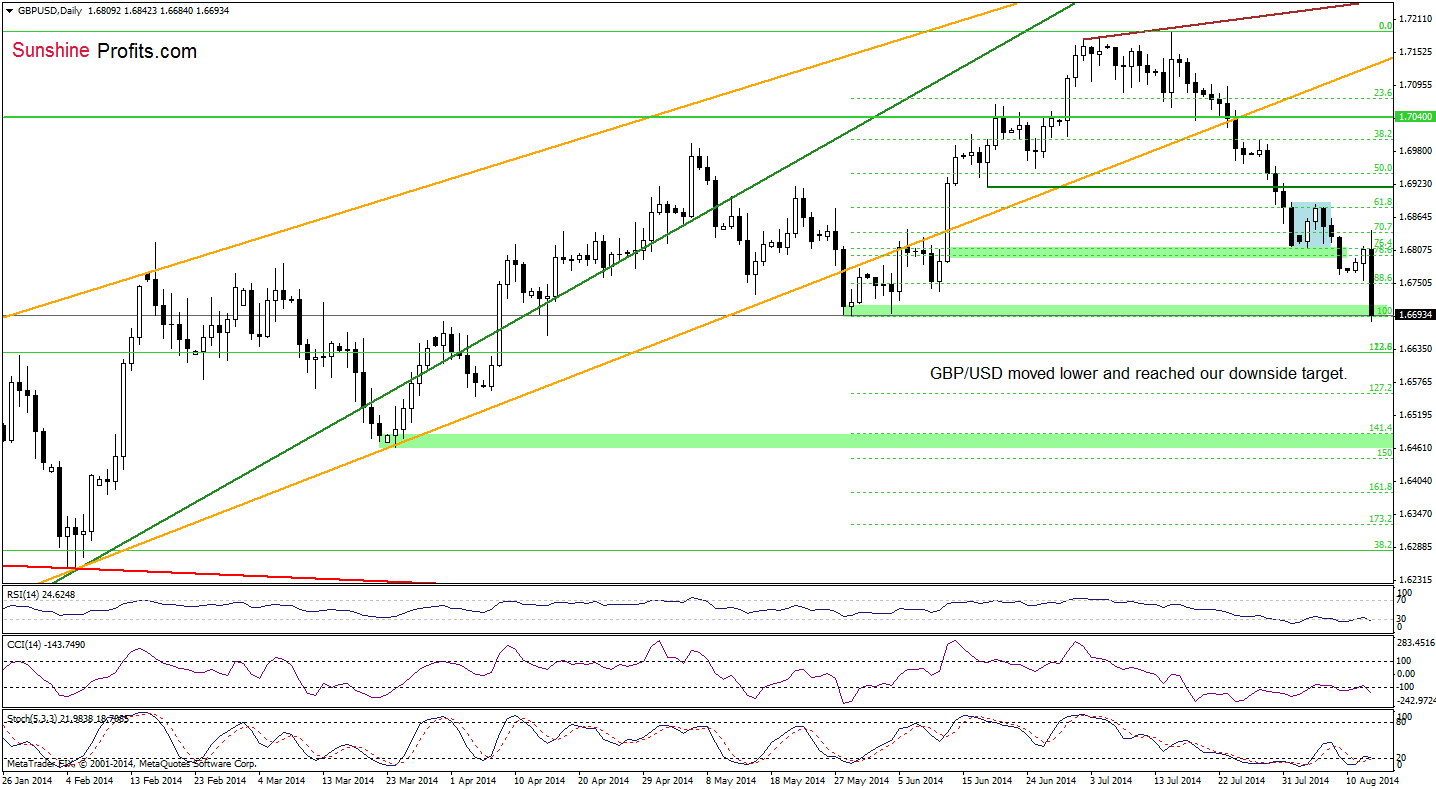
From this perspective, we see that the very short-term situation has deteriorated significantly as GBP/USD broke below the support zone created by the 76.4% and 78.6% Fibonacci retracement levels based on the May-July rally. This important breakdown triggered a sharp decline and a drop to the May low earlier today. If the support area encourages forex traders to push the buy button, we’ll see an increase to at least 1.6879, where the 38.2%Fibonacci retracement and recent highs are. Nevertheless, if it’s broken, the next downside target will be at 1.6628 or even around 1.6556, where the 127.2% Fibonacci extension (based on the May-July rally) and the April low are.
Very short-term outlook: mixed
Short-term outlook: mixed
MT outlook: bearish
LT outlook: mixed
Trading position (short-term): In our opinion, no positions are justified from the risk/reward perspective. We will keep you informed should anything change, or should we see a confirmation/invalidation of the above.
USD/CHF
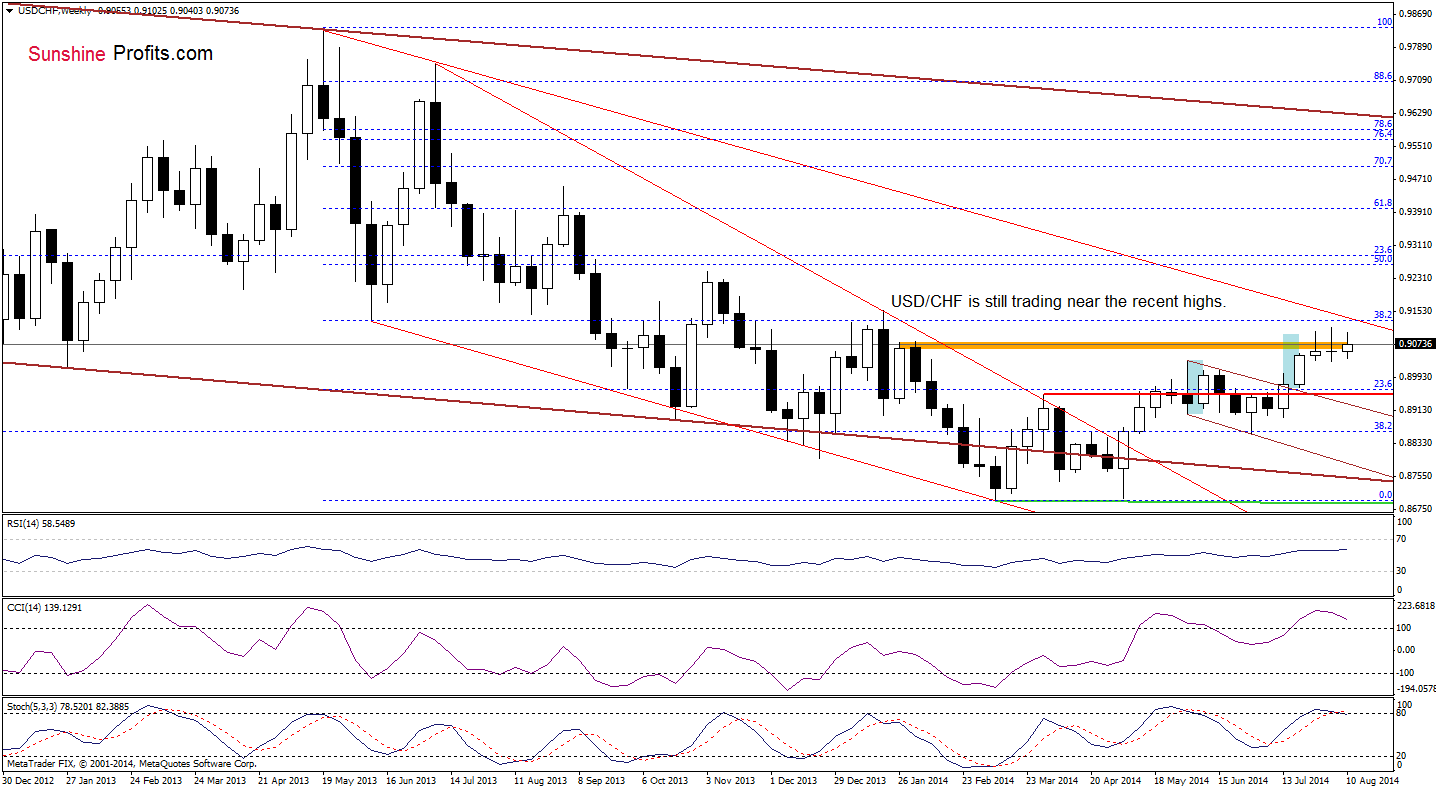
The medium term picture remains unchanged as USD/CHF is still trading near July and August highs, slightly below the 38.2% Fibonacci retracement based on the entire May 2013-March 2014 decline (this area is also reinforced by the long-term declining resistance line, which will likely stop further improvement). Please keep in mind that we should keep an eye on the current USD/CHF moves because the position of the indicators suggests that correction in the coming week (or weeks) is quite likely.
Having say that, let’s focus on the very short-term changes.
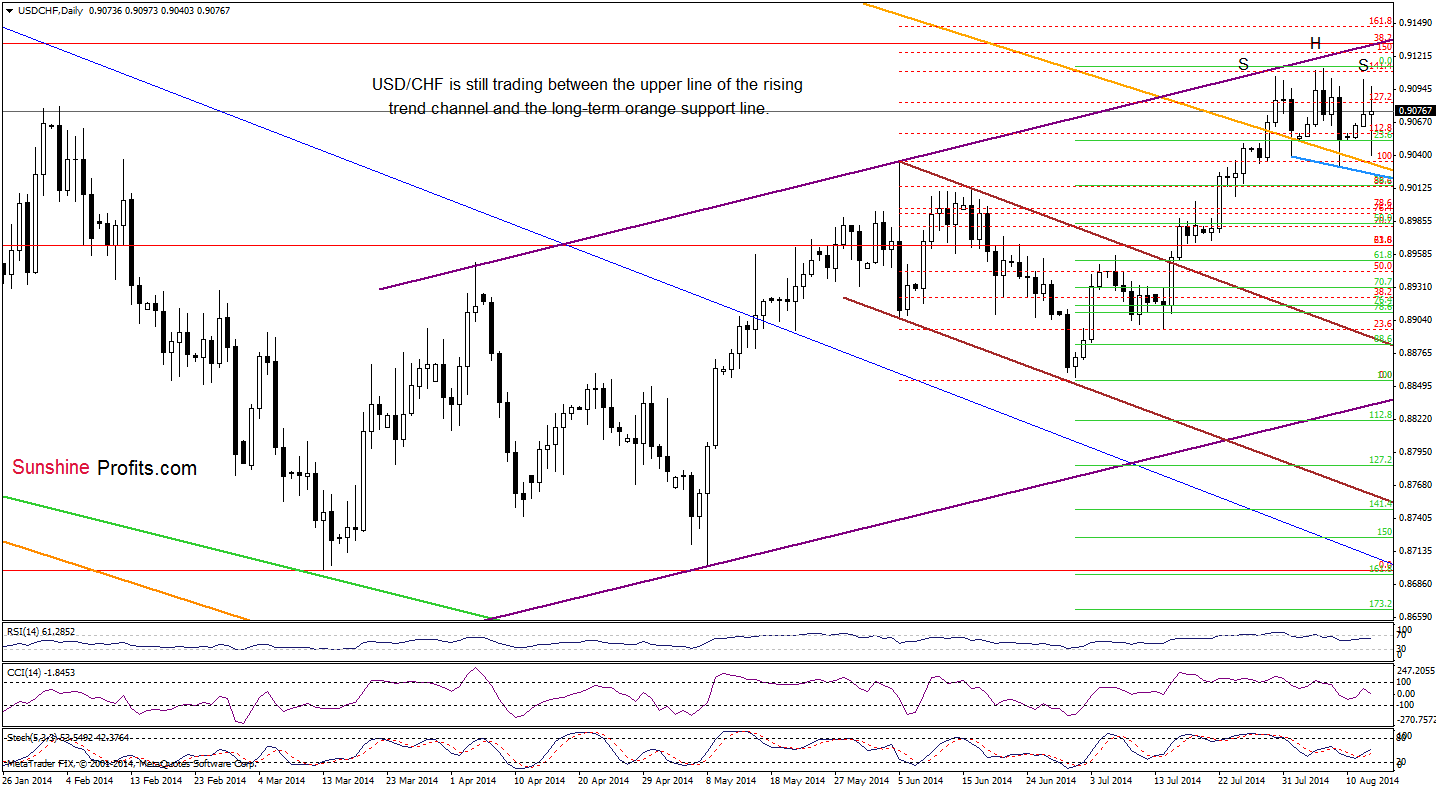
The first thing that catches the eye on the above chart is a potential head and shoulders formation. If this is the case, and the exchange rate is building a right shoulder at the moment, we’ll see a bigger downward move in the near future. Nevertheless, as long as there is no breakdown below the long-term orange support and neck line (marked with blue), we think that we won’t see further deterioration. Please note that the bearish scenario is currently reinforced by the resistance zone created by the upper line of the rising trend channel and the 141.4% Fibonacci extension, which still keep gains in check.
Very short-term outlook: mixed with bearish bias
Short-term outlook: mixed
MT outlook: mixed with bullish bias
LT outlook: bearish
Trading position (short-term): In our opinion no positions are justified from the risk/reward perspective. We will keep you informed should anything change, or should we see a confirmation/invalidation of the above.
On an administrative note, there will be no regular Forex Trading Alert on Friday - we will post the next one on Monday, Aug 18. Thank you for understanding.
Thank you.
Nadia Simmons
Forex & Oil Trading Strategist
Przemyslaw Radomski, CFA
Founder, Editor-in-chief
Gold & Silver Trading Alerts
Forex Trading Alerts
Oil Investment Updates
Oil Trading Alerts

