
Yesterday, the Labor Department said in its report that initial claims for jobless benefits in the week ending Aug. 2 fell by 14,000 to 289,000 from the previous week’s total of 303,000, beating analysts’ expectations for a 2,000 increase. Thanks to these bullish numbers, the U.S. dollar hit a fresh nine-month high against the common currency and a three-month high against the Swiss franc. What impact did the data have on other currency pairs? Did it change their short-term outlook?
In our opinion the following forex trading positions are justified - summary:
EUR/USD
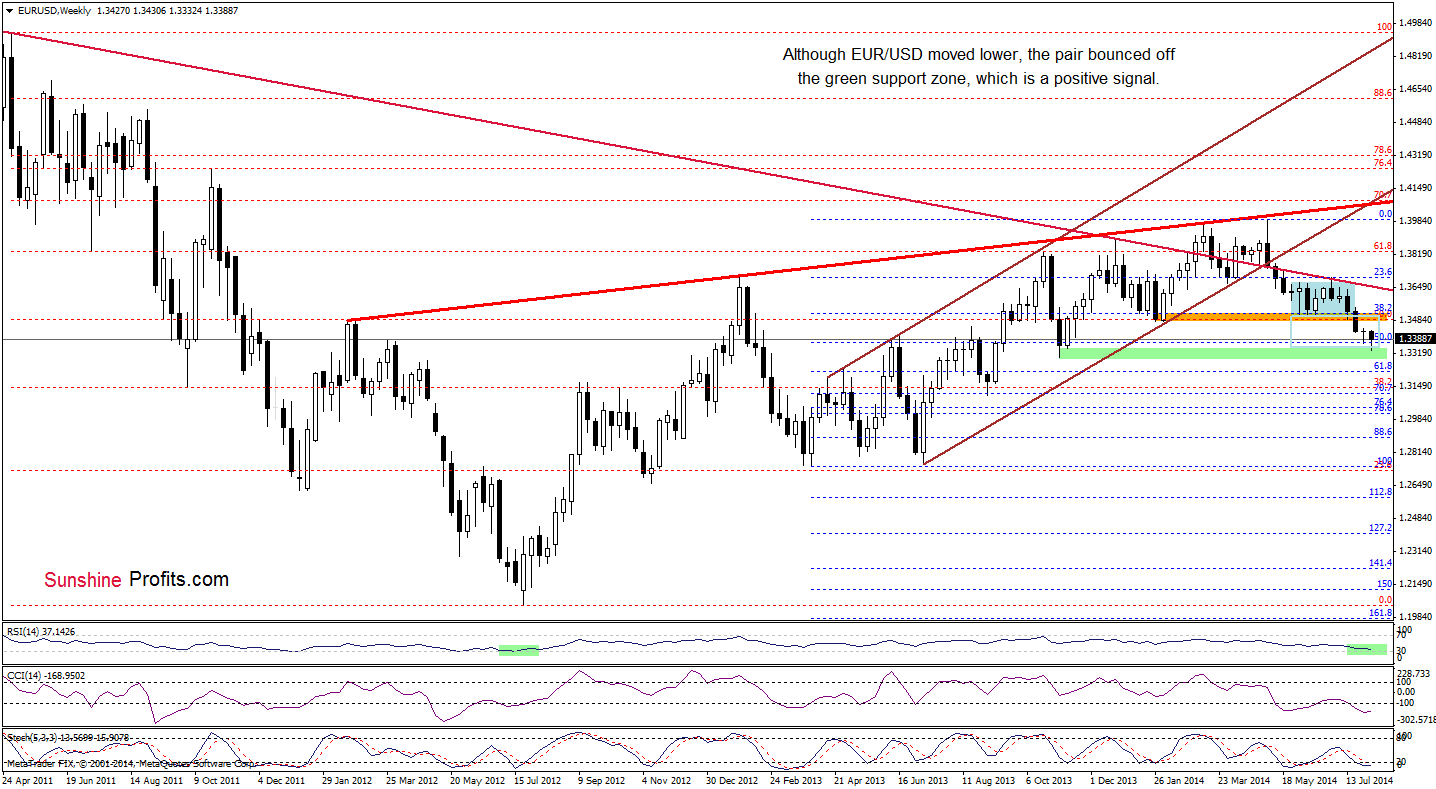
Although EUR/USD hit a fresh multi-month low, the medium-term outlook hasn’t changed much as the green support zone withstood the selling pressure. As you see on the above chart, the exchange rate bounced of this support area and came back above the previously-broken 50% Fibonacci retracement, which suggests that we may see further improvement in the coming week (or even weeks – especially if the CCI and Stochastic Oscillator generate buy signals).
Before we focus on the daily chart, we would like to draw your attention to the current position of the RSI. As you see, the indicator dropped to its lowest level since July 2012. Back then such low reading of the indicator in combination with buy signals generated by both other indicators preceded a sharp rally. Therefore, if history repeats itself once again, we think that we may see similar price action in the coming weeks.
Will the very short-term picture give us more clues about future moves? Let’s check.
On Wednesday, we wrote:
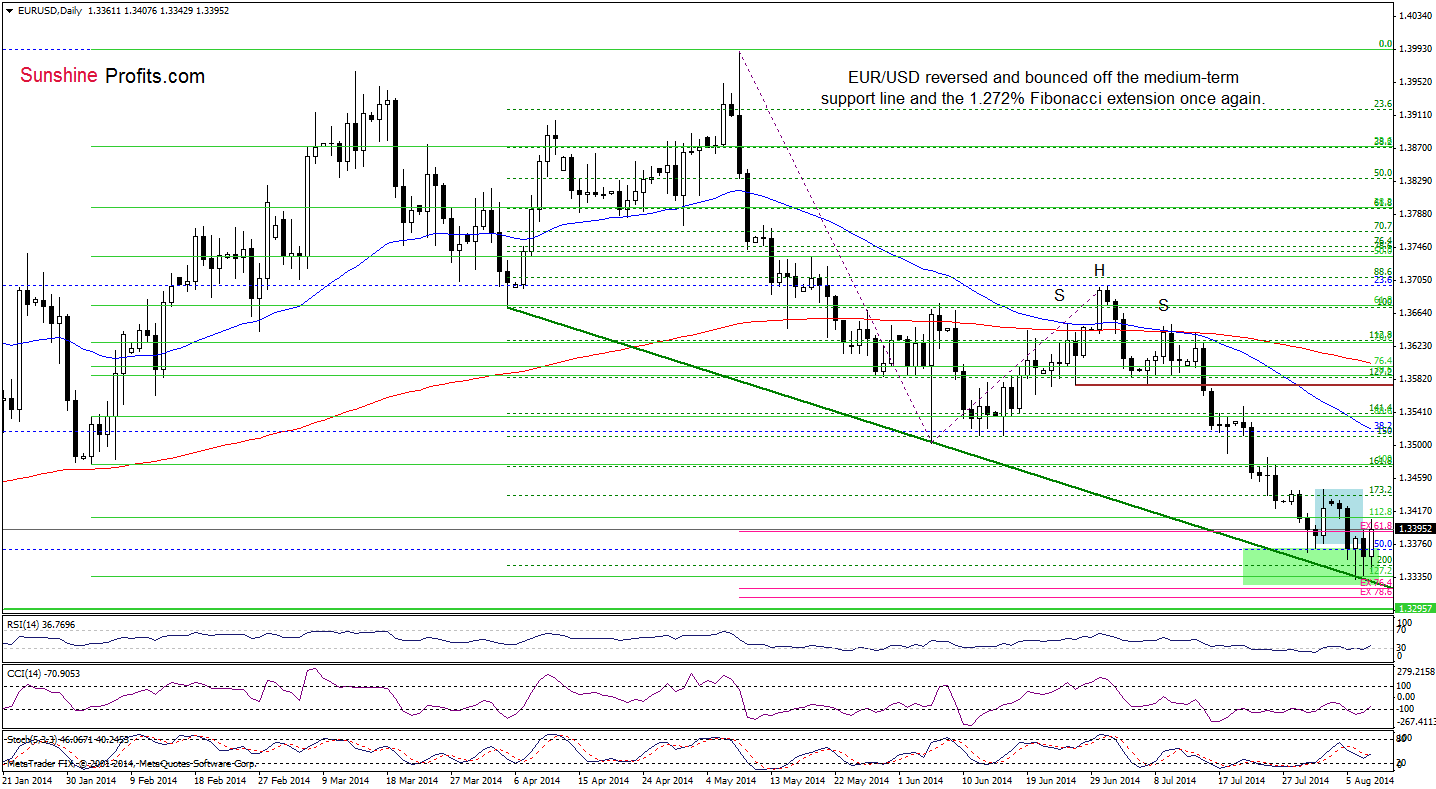
(…) the pair is trading in the green support zone (…) if this area holds, we’ll see another corrective upswing (similar to the one that we saw on Friday) in the near future.
Earlier today, we saw such price action as EUR/USD extended gains and came back above the level of 1.3400. Despite this improvement, both corrective upswings are similar (at least at the moment when these words are written), which means that another attempt to move lower should not surprise us. Nevertheless, taking into account buy signals generated by the indicators, we believe that the pair will extend gains in the coming days and increase to at least 1.3432-1.3444, where the previous highs are.
Very short-term outlook: mixed with bullish bias
Short-term outlook: bearish
MT outlook: bearish
LT outlook: bearish
Trading position (short-term): In our opinion no positions are justified from the risk/reward perspective. We will keep you informed should anything change, or should we see a confirmation/invalidation of the above.
GBP/USD
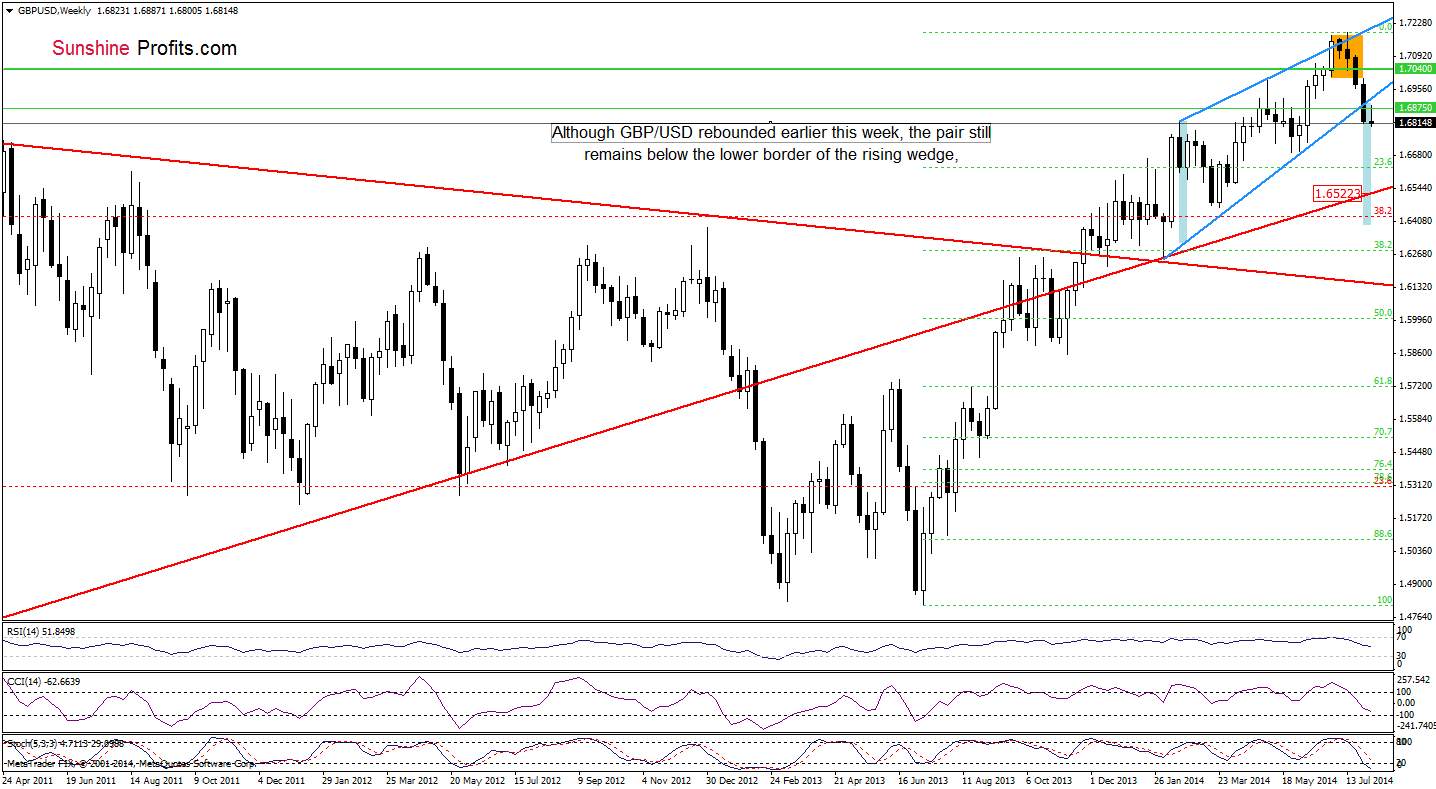
Although GBP/USD rebounded slightly earlier this week, the pair is still trading below the lower border of the rising wedge, which is a bearish signal that suggests further deterioration. Therefore, we believe that our last commentary on this currency pair is up-to-date:
(…) the next downside target will be the support zone created by the May and June lows (around 1.6692-1.6766).
Please note that if this support area is broken, the exchange rate will likely test the strength of the long-term red support line (currently around 1.6522).
What can we infer from the daily chart? Let’s check.
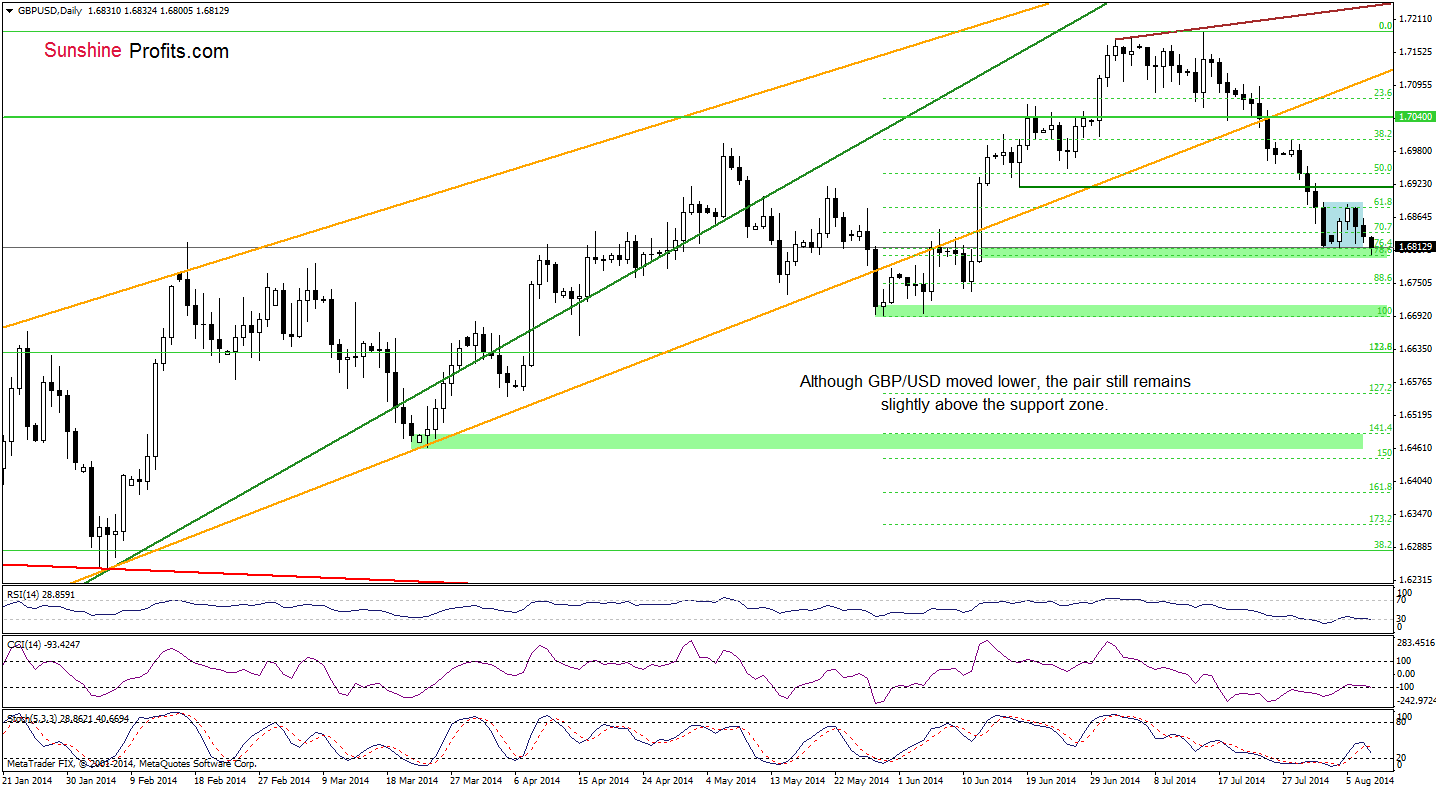
From this perspective, we see that the very short-term situation remains mixed as GBP/USD is trading in a consolidation (marked with blue). Although the pair moved lower earlier today, the support zone created by the 76.4% and 78.6% Fibonacci retracement levels based on the May-July rally still holds. Therefore, as long as there is no breakdown below this area, another sizable move is not likely to be seen. Nevertheless, we should keep in mind that if it is broken, the exchange rate, will extend declines and drop to 1.6753 or even to the May low of 1.6691.
Very short-term outlook: mixed
Short-term outlook: mixed
MT outlook: bearish
LT outlook: mixed
Trading position (short-term): In our opinion, no positions are justified from the risk/reward perspective. We will keep you informed should anything change, or should we see a confirmation/invalidation of the above.
USD/JPY
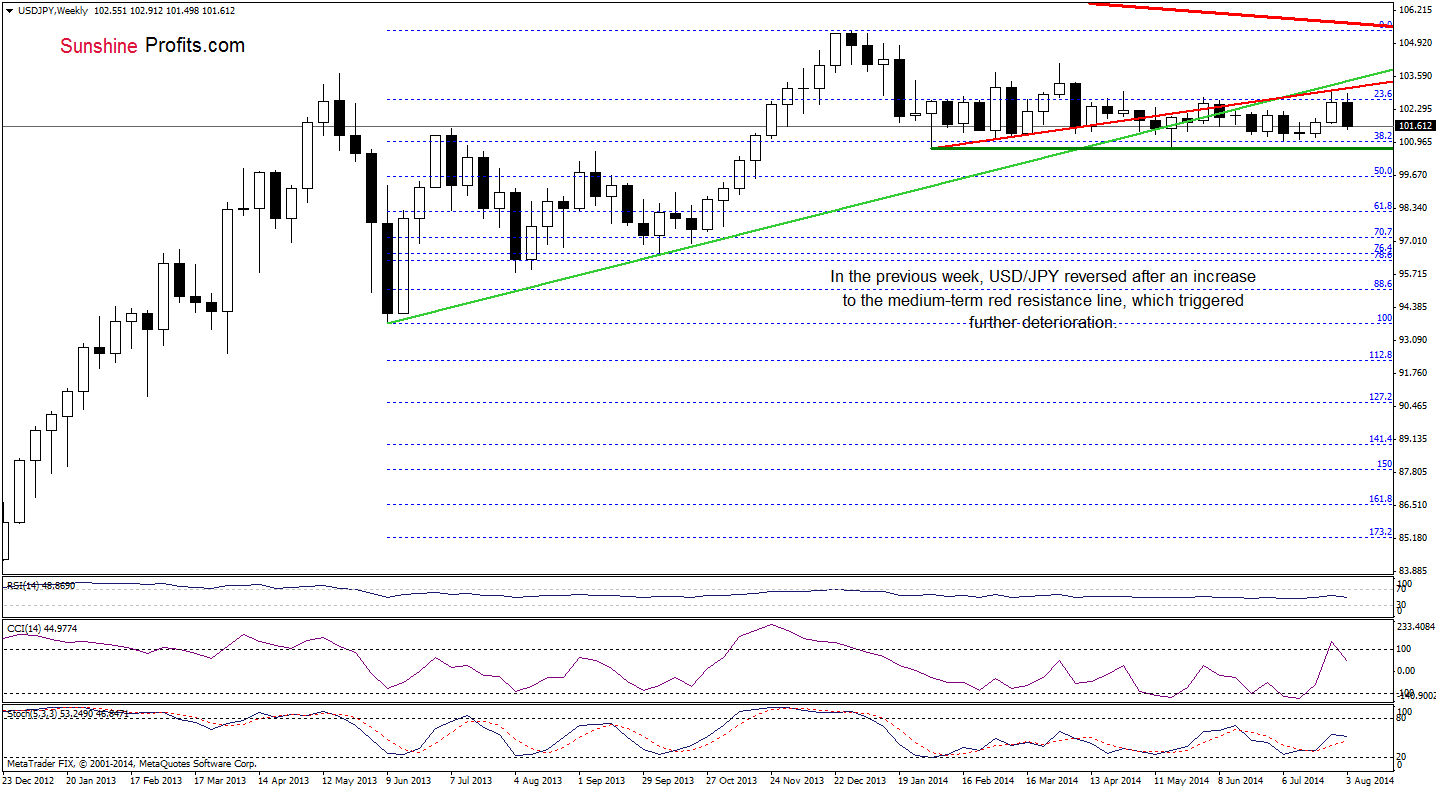
The medium-term picture has deteriorated slightly as USD/JPY reversed and declined after an increase to the medium-term red resistance line. With this downward move, the pair dropped below last week’s low, which suggests that we may see a drop even to the July lows (101.05-101.18). Are there any short-term support levels that could stop further deterioration? Let’s examine the daily chart and find out.
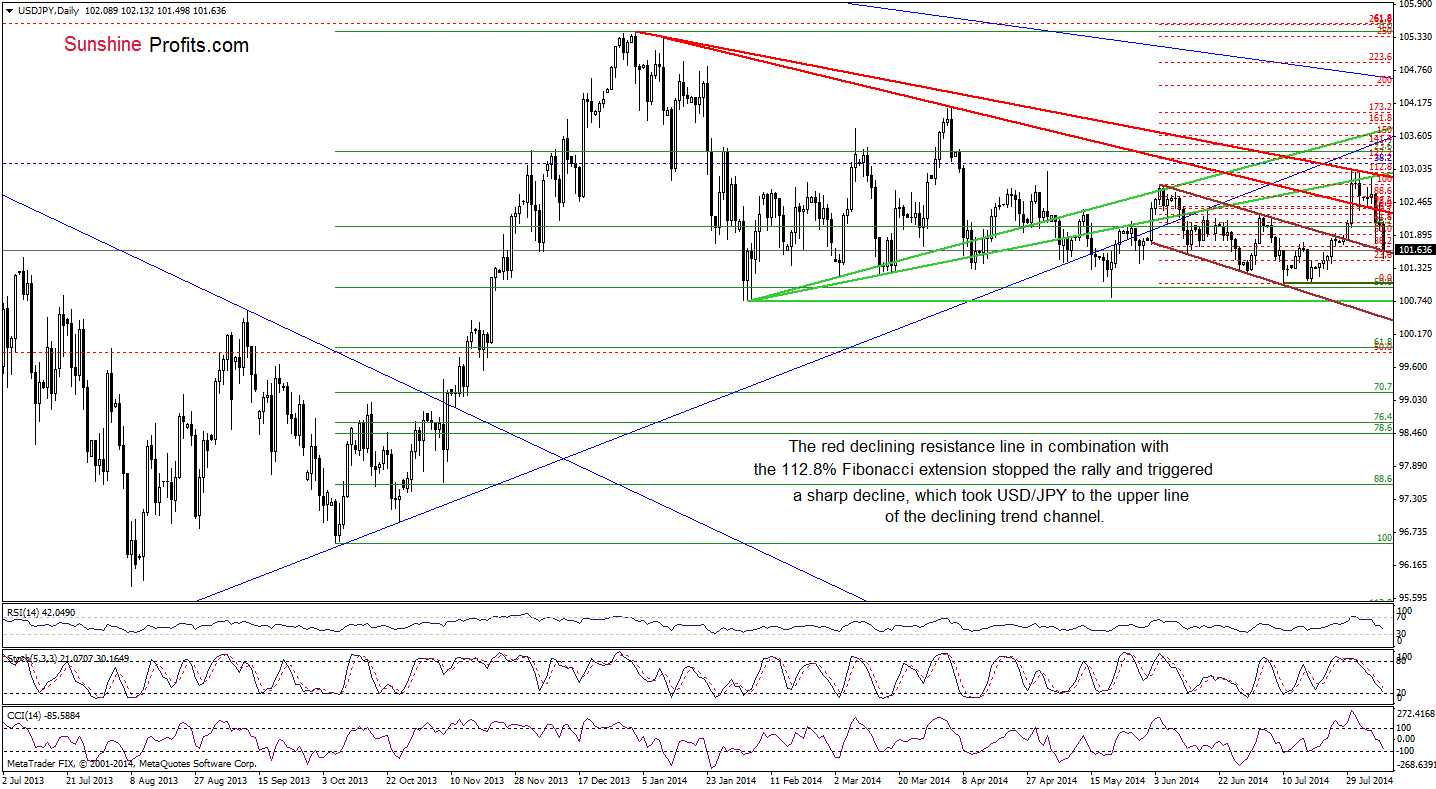
Looking at the above chart, we see that although USD/JPY moved higher in the previous week, the combination of the upper red declining resistance line and the 112.8% Fibonacci extension was strong enough to stop the rally and trigger a correction. From this perspective, we see that the exchange rate dropped to the previously-broken upper line of the declining trend channel, which may pause or even stop further deterioration. If this is the case, the pair will rebound from here in the coming day (or days)and the initial upside target will be the lower red declining resistance line (currently around 102.33). Nevertheless, taking into account sell signals generated by the indicators, we should also consider a bearish scenario. In this case, if the pair drops below its key support line, the correction will extend and the pair will drop to July lows.
Very short-term outlook: mixed
Short-term outlook: mixed
MT outlook: mixed
LT outlook: bearish
Trading position (short-term): In our opinion no positions are justified from the risk/reward perspective at the moment. We will keep you informed should anything change, or should we see a confirmation/invalidation of the above.
USD/CAD
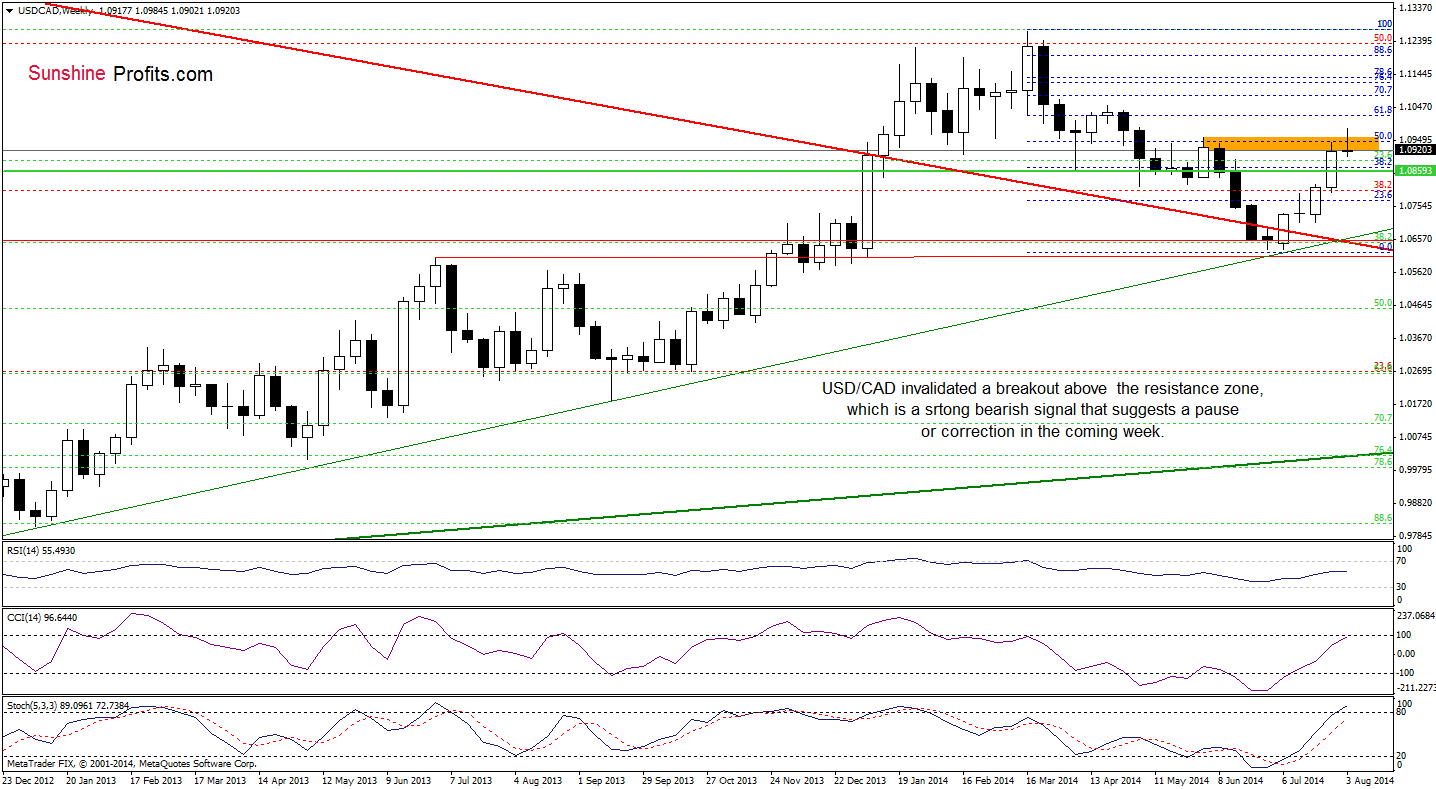
From this perspective, we see that the situation in the medium term has deteriorated slightly as USD/CAD invalidated a brekout above the resistance zone created by the June highs and the 50% Fibonacci retracement. Although this is a bearish signal, the exchange rate is still trading near the recent high and there are no sell signals, which suggests that currency bulls may try to push the pair higher once again. Nevertheless, if the pair closes the week below this area, we’ll see further deterioration in the coming week and the initial downside target will be around 1.0844, where the 38.2% Fibonacci retracement based on the recent rally is.
Will the daily chart give us any clearer clues where the pair head next? Let’s check.
Quoting our last commentary on this currency pair:
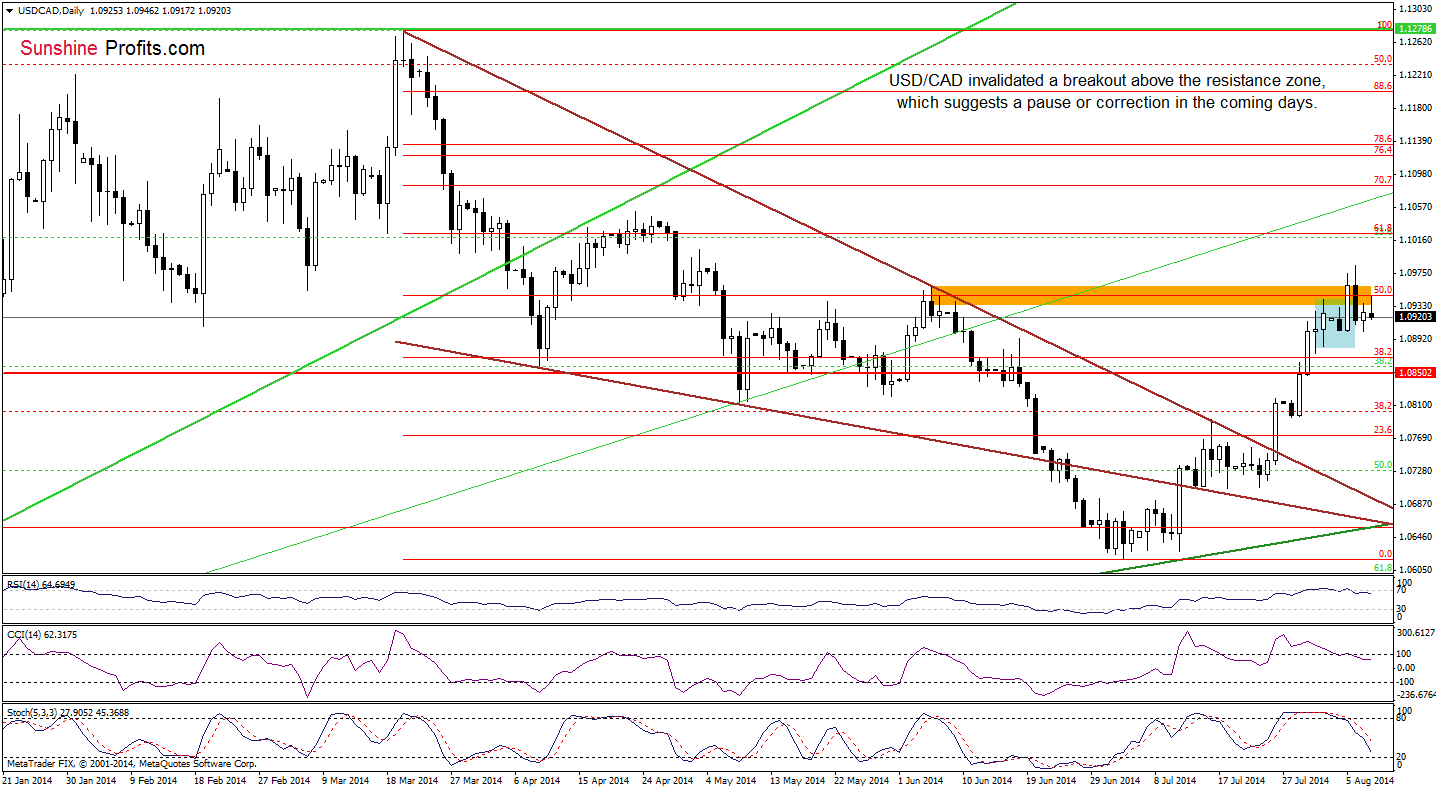
(…) the exchange rate reached the resistance zone created by the 50% Fibonacci retracement and June highs. (…) Looking at the current position of the indicators, we clearly see that the RSI increased above the level of 70, while the CCI and Stochastic Oscillator are overbought. On top of that, there are negative divergences between them and the exchange rate. What does it mean for USD/CAD? In our opinion, a pause or correction is just round the corner – especially if the indicators generate sell signals. Nevertheless, until this time another attempt to move higher can’t be ruled out.
Looking at the above chart, we see that although USD/CAD moved higher earlier this week, the pair reversed, invalidating earlier breakout. As we have pointed out before, this is a bearish sign, which in combination with sell signals generated by the indicators will likely trigger further deterioration in the coming days. If this is the case, we’ll see a drop to (at least) the lower border of the consolidation (marked with blue) at 1.0883. If this support is broken, the next downside target will be the above-mentioned 38.2% Fibonacci retracement based on the recent rally (around 1.0844).
Very short-term outlook: bearish
Short-term outlook: mixed
MT outlook: mixed
LT outlook: bearish
Trading position (short-term): In our opinion no positions are justified from the risk/reward perspective. We will keep you informed should anything change, or should we see a confirmation/invalidation of the above.
USD/CHF
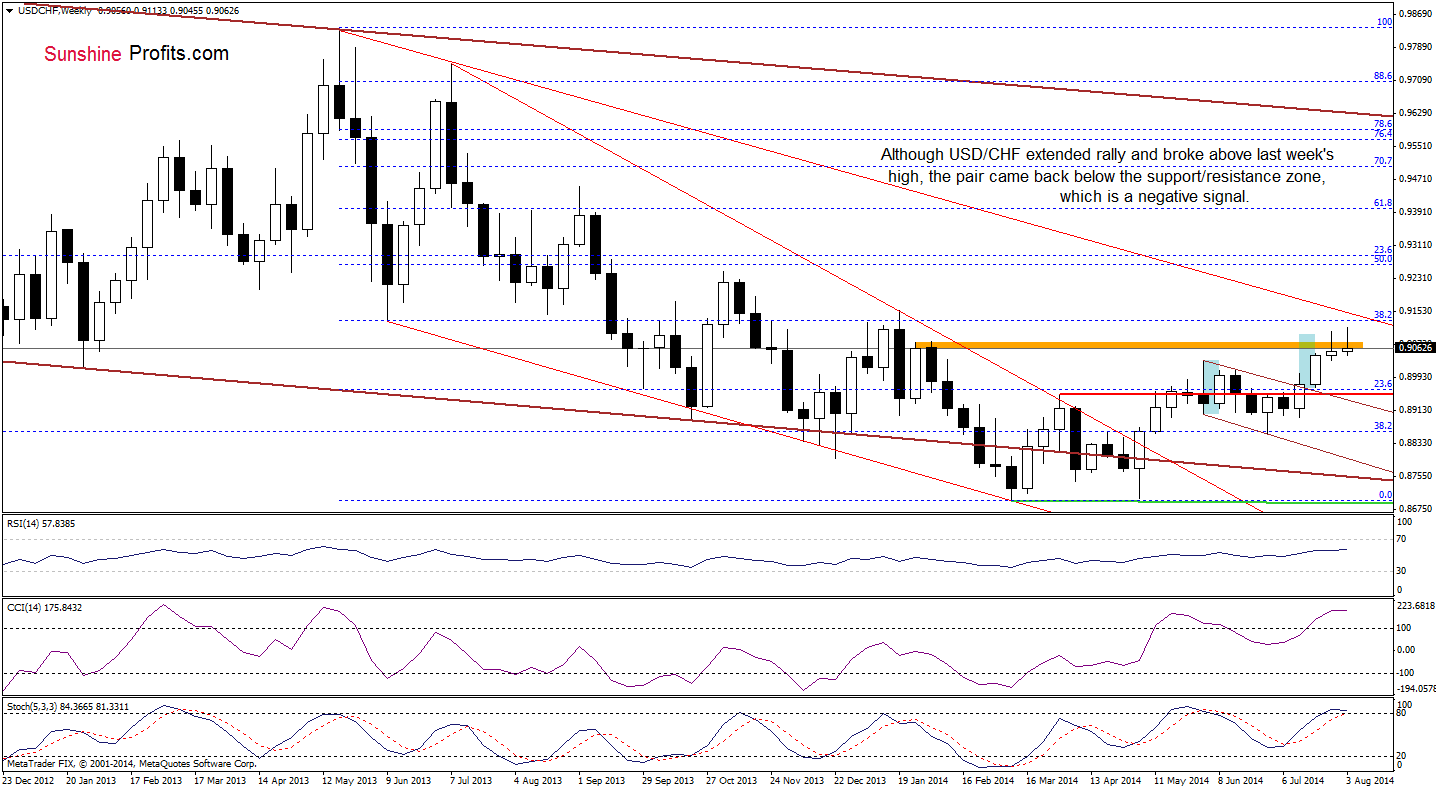
As you see on the above chart, USD/CHF extended rally and broke above last week’s high, but the pair reversed and gave up some gains, declining below the orange resistance zone. Although this is a bearish signal, the pair is still trading near the recent peak, which suggests that we may see another attempt to move higher – similarly to what we saw in the previous week. As a reminder, the next upside target is the 38.2% Fibonacci retracement based on the entire May 2013-March 2014 decline (this area is also reinforced by the long-term declining resistance line, which will likely stop further improvement). Please keep in mind that we should keep an eye on the current USD/CHF moves because the position of the indicators suggests that correction in the coming week (or weeks) is quite likely.
Having say that, let’s focus on the very short-term changes.
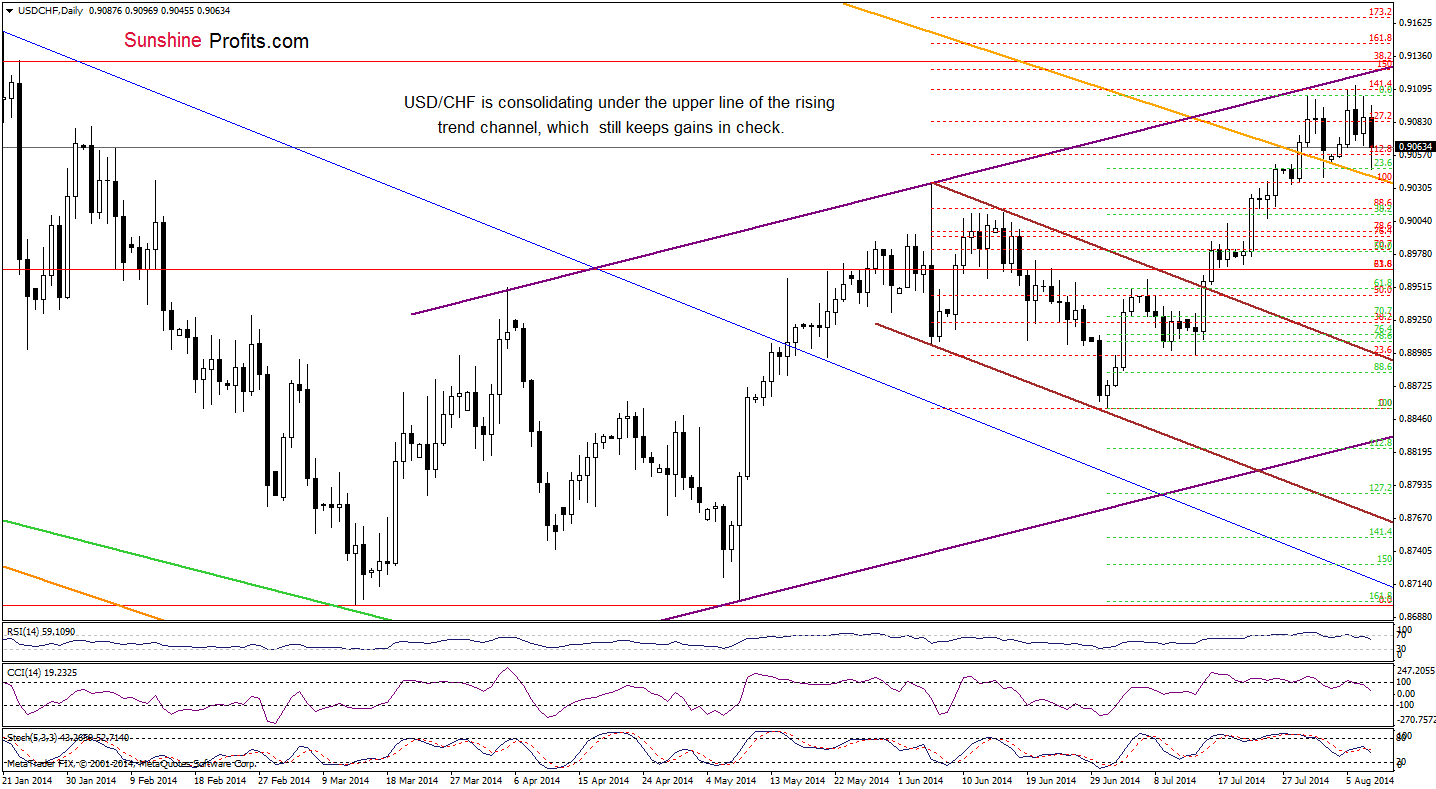
Looking at the above chart, we see that although USD/CHF moved lower earlier today, the pair is still trading in a narrow range between the resistance zone created by the upper line of the rising trend channel and the 141.4% Fibonacci extension and the long-term orange support line. Therefore, we believe that as long as there is no breakout above the nearest resistance or breakdown below the key support line another sizable move is not likely to be seen. Please keep in mind that the RSI and CCI generated sell signals (there are also negative divergences between them and the exchange rate), which suggest that a correction is just around the corner.
Very short-term outlook: mixed with bearish bias
Short-term outlook: mixed
MT outlook: mixed with bullish bias
LT outlook: bearish
Trading position (short-term): In our opinion no positions are justified from the risk/reward perspective. We will keep you informed should anything change, or should we see a confirmation/invalidation of the above.
AUD/USD
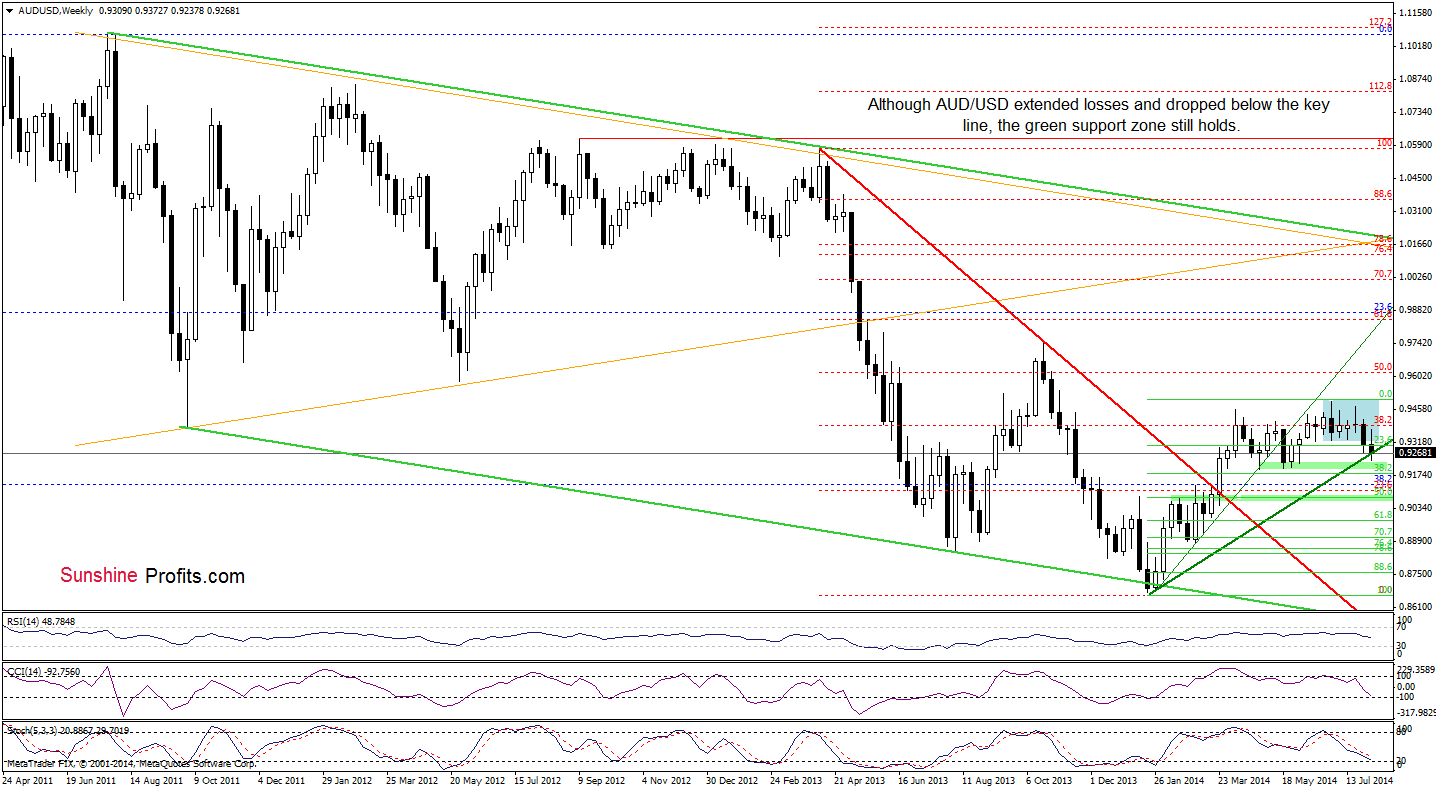
On the above chart, we see that although AUD/USD dropped below the long-term green line, the support zone created by the April, May and June lows triggered a corrective upswing. If this area encourage forex traders to push the buy button, we’ll see a rebound from here and a comeback to the consolidatiion range – similarly to what we saw in the previous months. Nevertheless, if the pair closes the week below this key support line and drops below the support zone, the medium-term outlook turns to bearish and we’ll see a drop to the 38.2% Fibonacci retracement (at 0.9180) or even to around 0.9081, where next support zone (created by February highs and the 50% Fibonacci retracement based on the entire 2014 rally) is.
Having say that, let’s take a closer look at the very short-term changes.
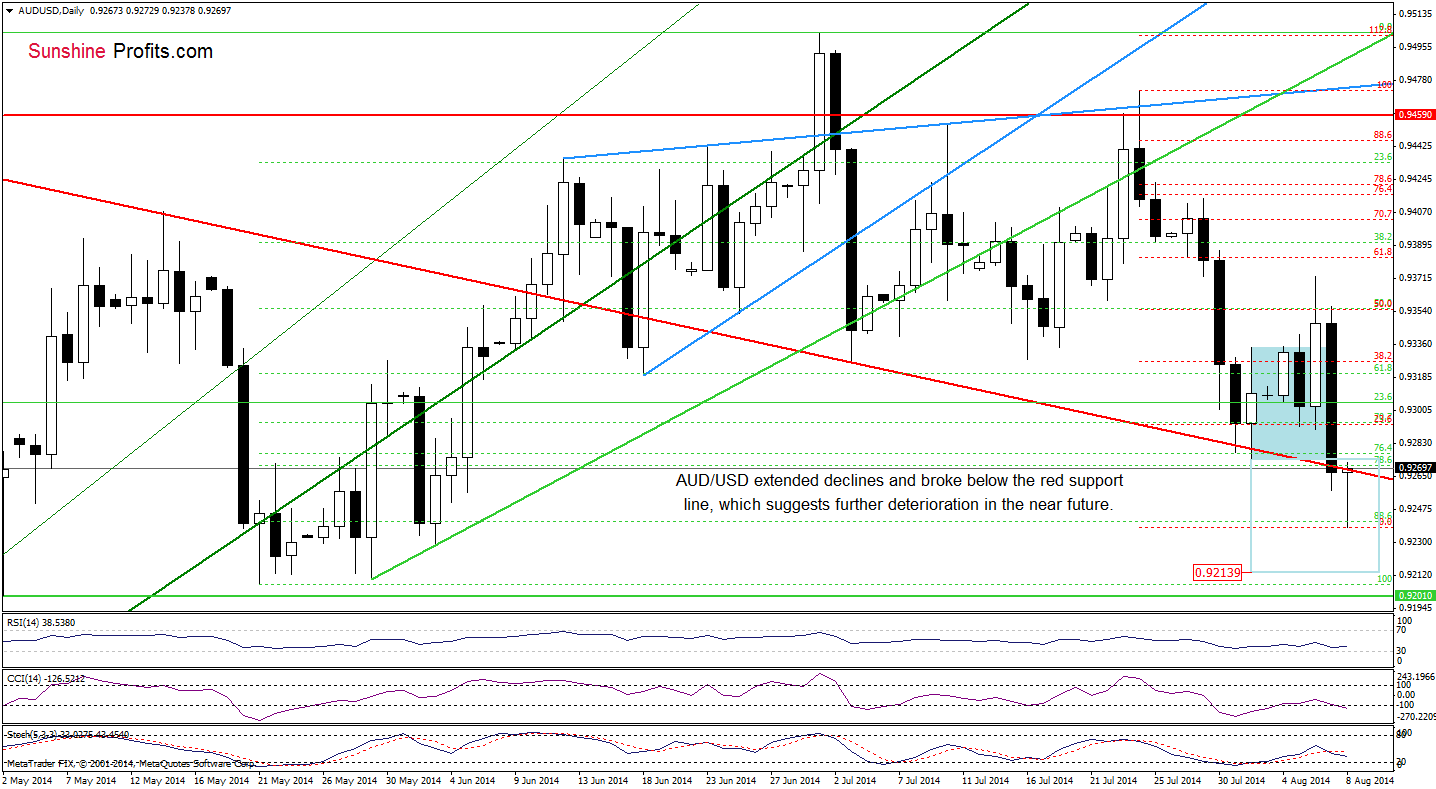
Yesterday, AUD/USD extended declines and closed the day below medium-term red support line, which was a strong negative signal that triggered further deterioration earlier today. As you see on the above chart, although the pair hit a fresh two-month low, AUD/USD reversed and came back to the previously-broken red support/resistance line. If it holds, we’ll likely see another downswing and the downside target will be around 0.9213 or even the bottom of the correction that we saw in May (around 0.9207-0.9210). However, if the exchange rate invalidates the breakdown, it will be a strong bullish signal that should trigger an increase to at least 0.9327, where the 38.2% Fibonacci retracement based on the recent decline is.
Very short-term outlook: bearish
Short-term outlook: bearish
MT outlook: mixed
LT outlook: bearish
Trading position (short-term): In our opinion, no positions are justified from the risk/reward perspective. We will keep you informed should anything change, or should we see a confirmation/invalidation of the above.
Thank you.
Nadia Simmons
Forex & Oil Trading Strategist
Przemyslaw Radomski, CFA
Founder, Editor-in-chief
Gold & Silver Trading Alerts
Forex Trading Alerts
Oil Investment Updates
Oil Trading Alerts

