
The Australian dollar declined to a two-month low against its U.S. counterpart after official data showed that the number of employed people in Australia fell by 300 in the previous month, missing expectations for an increase of 12,000. Additionally, Australia's unemployment rate rose to 6.4% last month, from 6.0% in June. Later in the day, AUD/USD extended losses after the Labor Department said in its report that initial claims for jobless benefits in the week ending Aug. 2 fell by 14,000, beating analysts’ expectations for a 2,000 increase. Because of these numbers, the pair declined to the long-term support line. Will it be strong enough to stop currency bears’ charge?
In our opinion the following forex trading positions are justified - summary:
EUR/USD
The medium-term outlook hasn’t changed much as EUR/USD still remains in the green support zone. Today, we’ll focus on the very short-term changes.
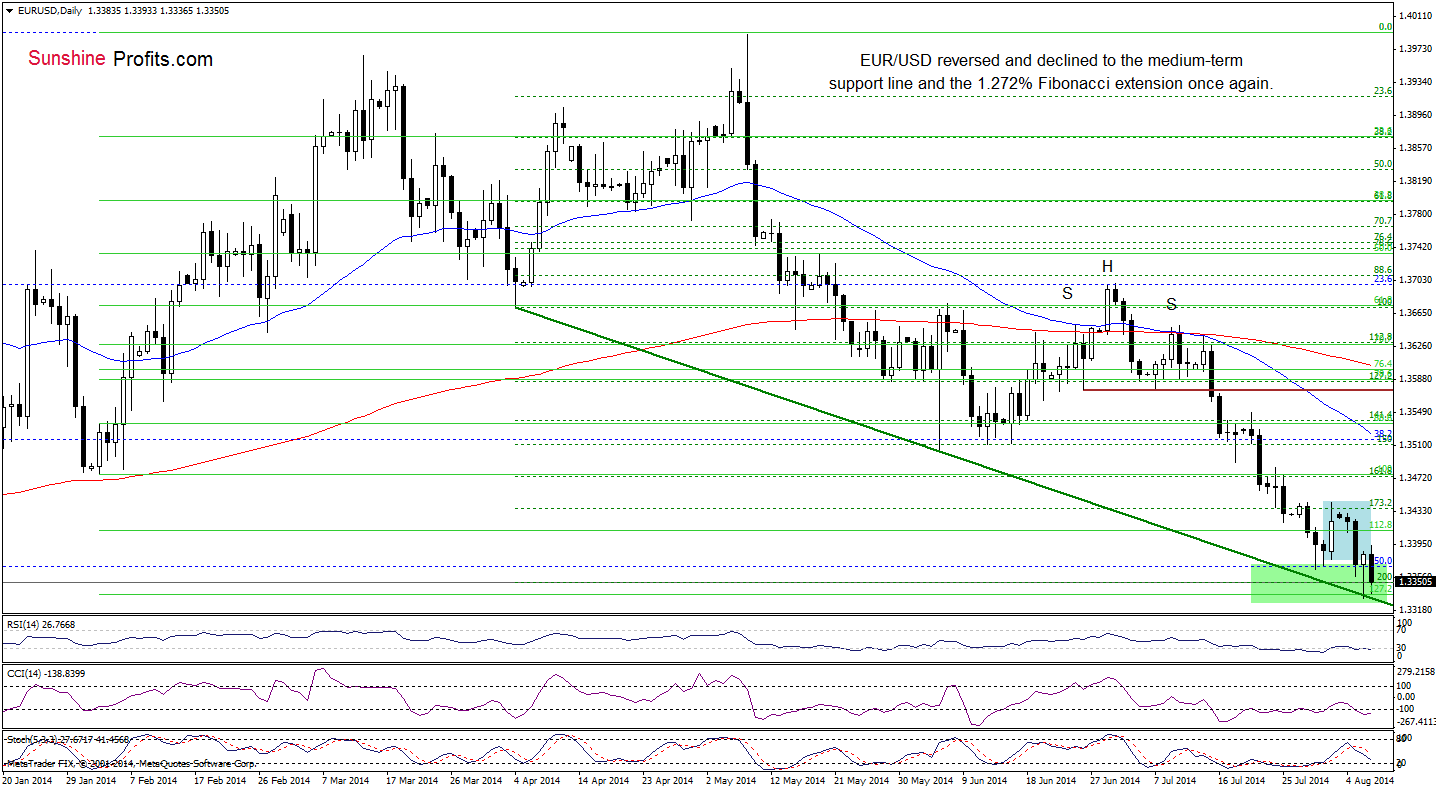
Looking at the above chart, we see that although EUR/USD rebounded slightly yesteday, the pair reversed and declined to the lower border of the green support zone. As you see on the above chart, this area still holds and the exchange rate is trading above the 127.2% Fibonacci extension based on the entire Feb-May rally and the medium-term green support line. Consequently, we believe that as long as there is no breakdown below these levels, another sizable downward move is not likely to be seen. Please note that if this area holds, we’ll see another corrective upswing in the near future.
Very short-term outlook: mixed
Short-term outlook: bearish
MT outlook: bearish
LT outlook: bearish
Trading position (short-term): In our opinion no positions are justified from the risk/reward perspective. We will keep you informed should anything change, or should we see a confirmation/invalidation of the above.
USD/CHF
In our last commentary on this currency pair, we wrote:
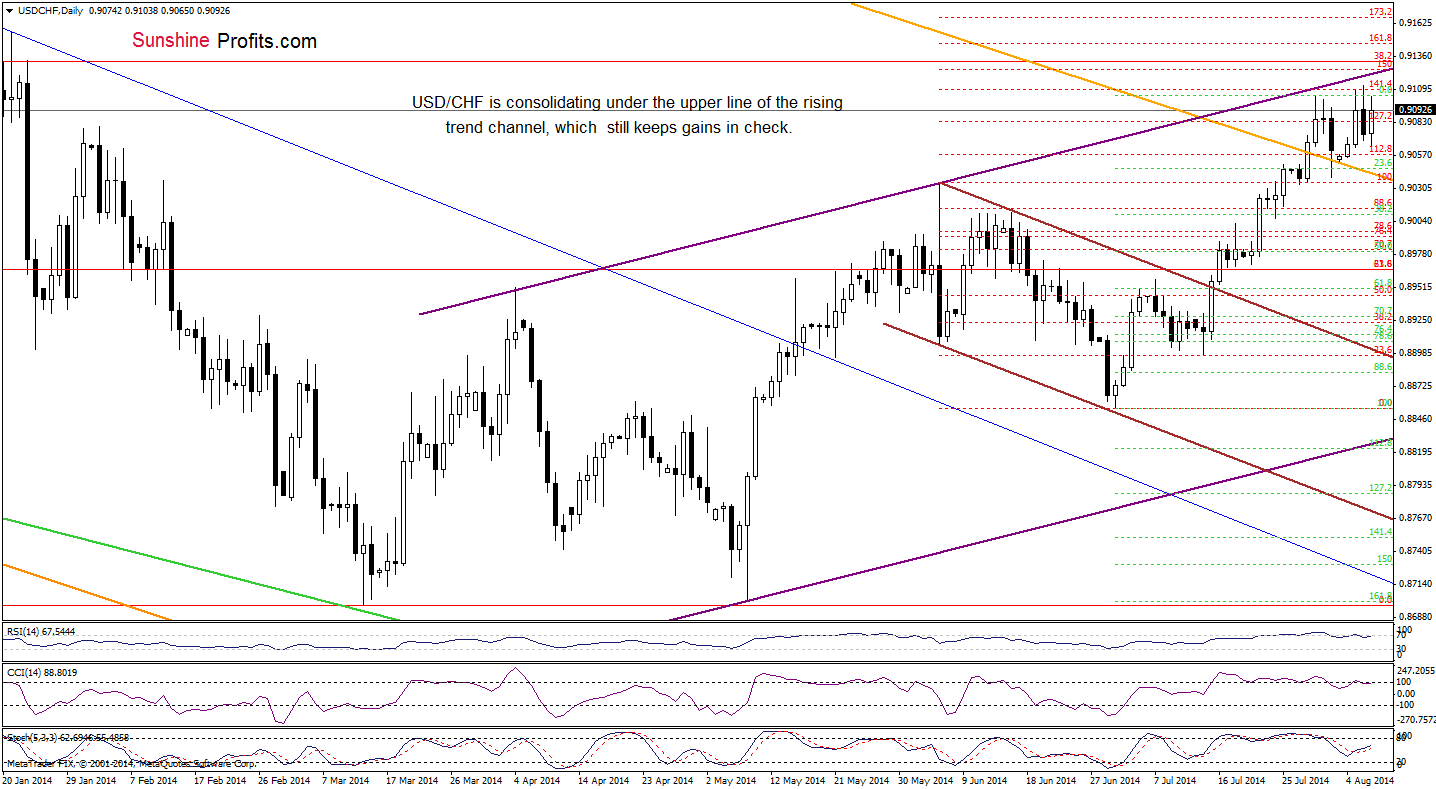
(…) the pair reached the 141.4% Fibonacci extension and approached the upper line of the rising trend channel once again. If history from the previous week repeats itself, we’ll see a pullback from here in the coming day (or days). Please note that this scenario is currently reinforced by the position of the RSI, which remains above the key level of 70 (…)
Looking at the above chart, we see that although USD/CHF corrected gains yesterday, the pair is still trading in a narrow range slightly below the resistance zone. In our opinion as long as there is no breakout above it or breakdown below the long-term orange support line another sizable move is not likely to be seen. Nevertheless, we should keep in mind that the RSI and CCI generated sell signals (there are also negative divergences between them and the exchange rate), which suggest that a pause or correction is just around the corner.
Very short-term outlook: mixed with bearish bias
Short-term outlook: mixed
MT outlook: mixed with bullish bias
LT outlook: bearish
Trading position (short-term): In our opinion no positions are justified from the risk/reward perspective. We will keep you informed should anything change, or should we see a confirmation/invalidation of the above.
AUD/USD
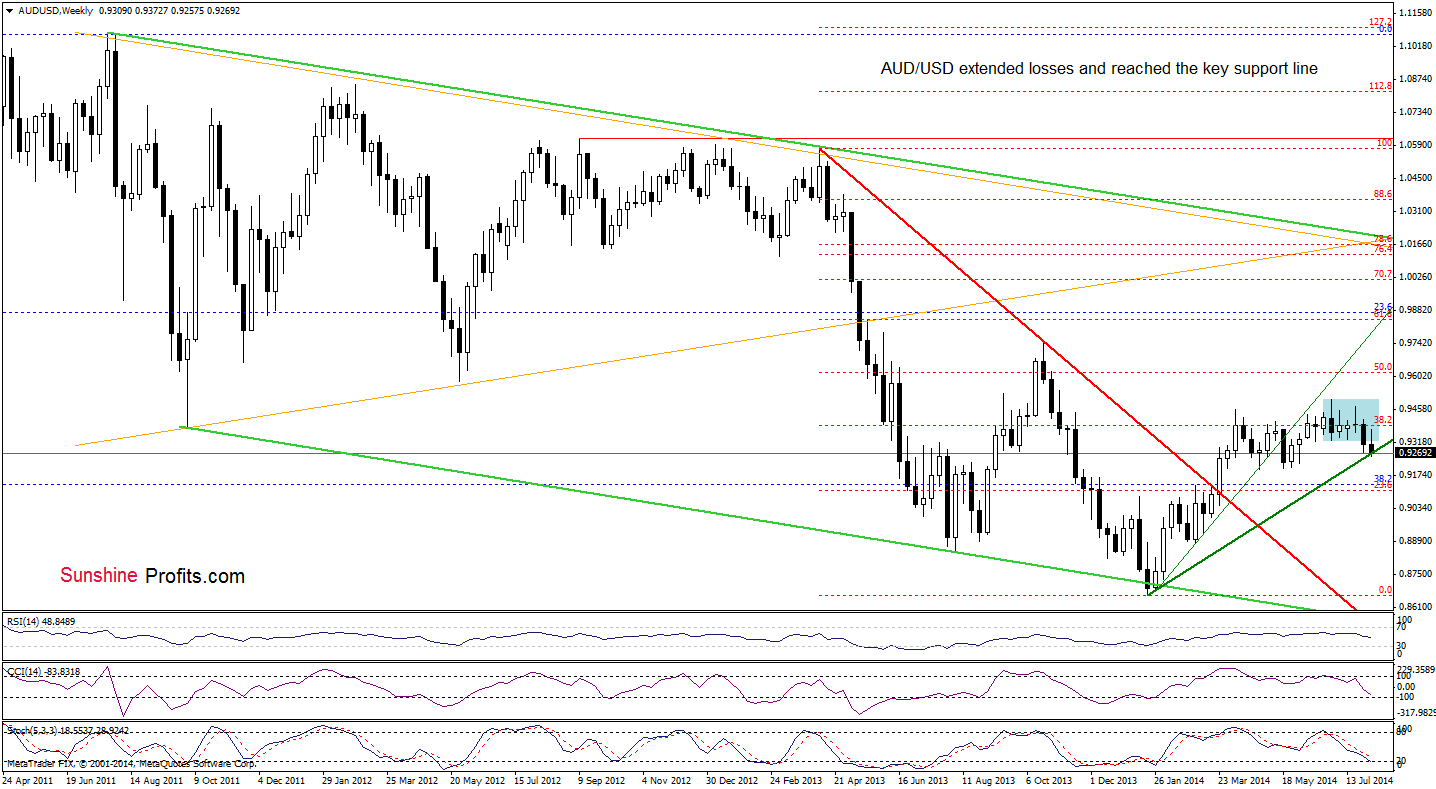
Although the medium-term picture has deteriorated as AUD/USD dropped to the long-term green line, this strong support still keeps further declines in check. Terefore, we still believe that as long as there is no breakdown below this key support, another sizable downward move is not likely to be seen.
Having say that, let’s take a closer look at the very short-term changes.
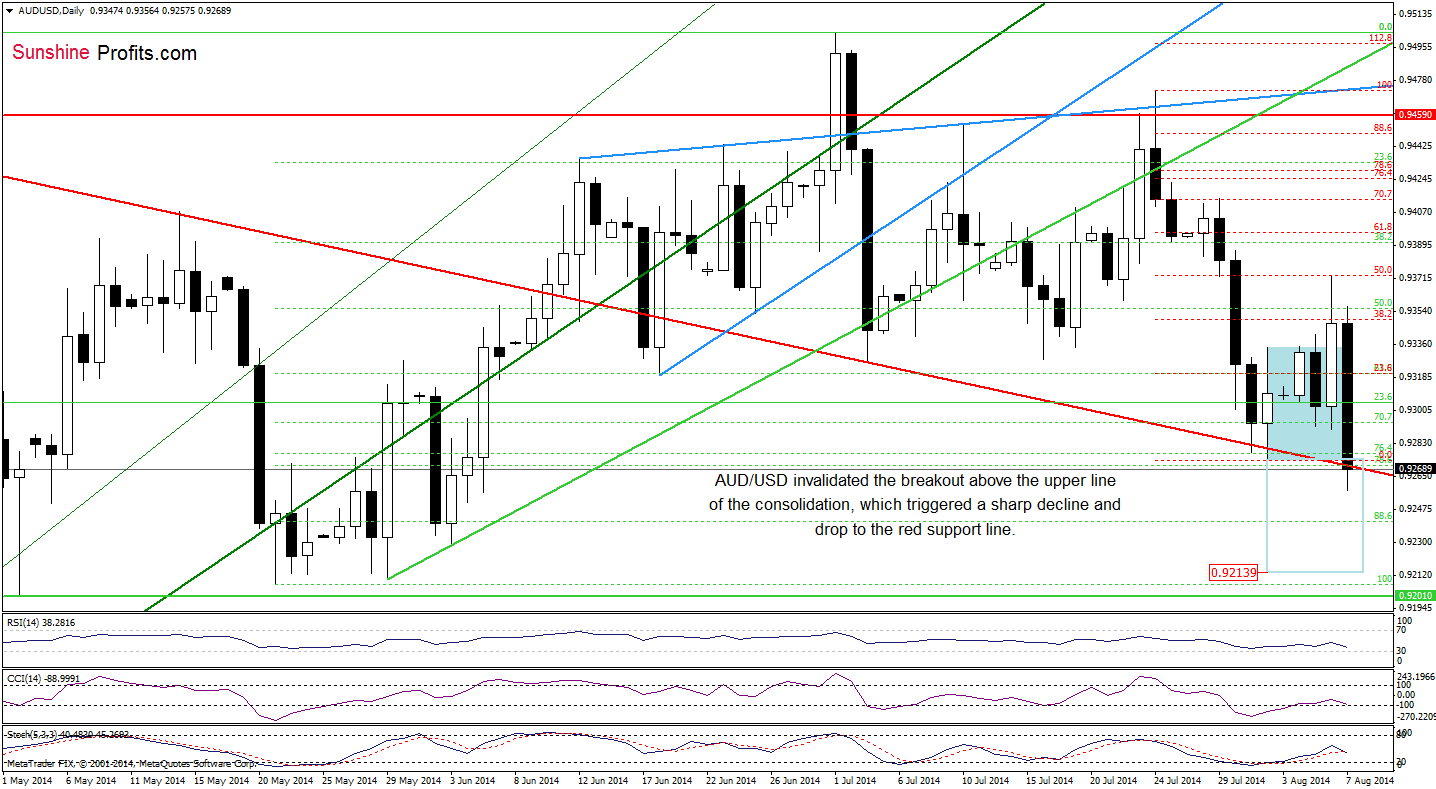
From this perspective, we see that although AUD/USD broke above the upper line of the consolidation, the 50% Fibonacci retracement successfully stopped further improvement. As a result, the pair reversed, invalidating earlier breakout, which was a strong bearish signal that triggered a sharp decline and a drop to slightly below the medium-term red support line. So far, this key support still holds. If it withstand the selling pressure in the following hours, we’ll see a rebound from here and another attempt to break above the 50% Fibonacci retracement. However, if this important line is broken (and the pair closes the day below it), it will be a strong negative signal, which could trigger a decline to the downside targets that we discussed yesterday:
(…) we may see a decline to 0.9213 or even to the bottom of the correction that we saw in May (around 0.9207-0.9210).
Very short-term outlook: mixed
Short-term outlook: mixed
MT outlook: mixed
LT outlook: bearish
Trading position (short-term): In our opinion, no positions are justified from the risk/reward perspective. We will keep you informed should anything change, or should we see a confirmation/invalidation of the above.
Thank you.
Nadia Simmons
Forex & Oil Trading Strategist
Przemyslaw Radomski, CFA
Founder, Editor-in-chief
Gold & Silver Trading Alerts
Forex Trading Alerts
Oil Investment Updates
Oil Trading Alerts

