
Earlier today, the Institute of Supply Management reported that its non-manufacturing PMI increased to a three-year high of 58.7 in July from a reading of 56.0 in June, beating analysts’ expectations of a 56.3 reading. Thanks to these numbers, the greenback hit a seven-month highs against the Swiss franc and approached an important resistance area. Will it stop the rally in the coming days?
In our opinion the following forex trading positions are justified - summary:
EUR/USD
Quoting our yesterday’s Forex Trading Alert:
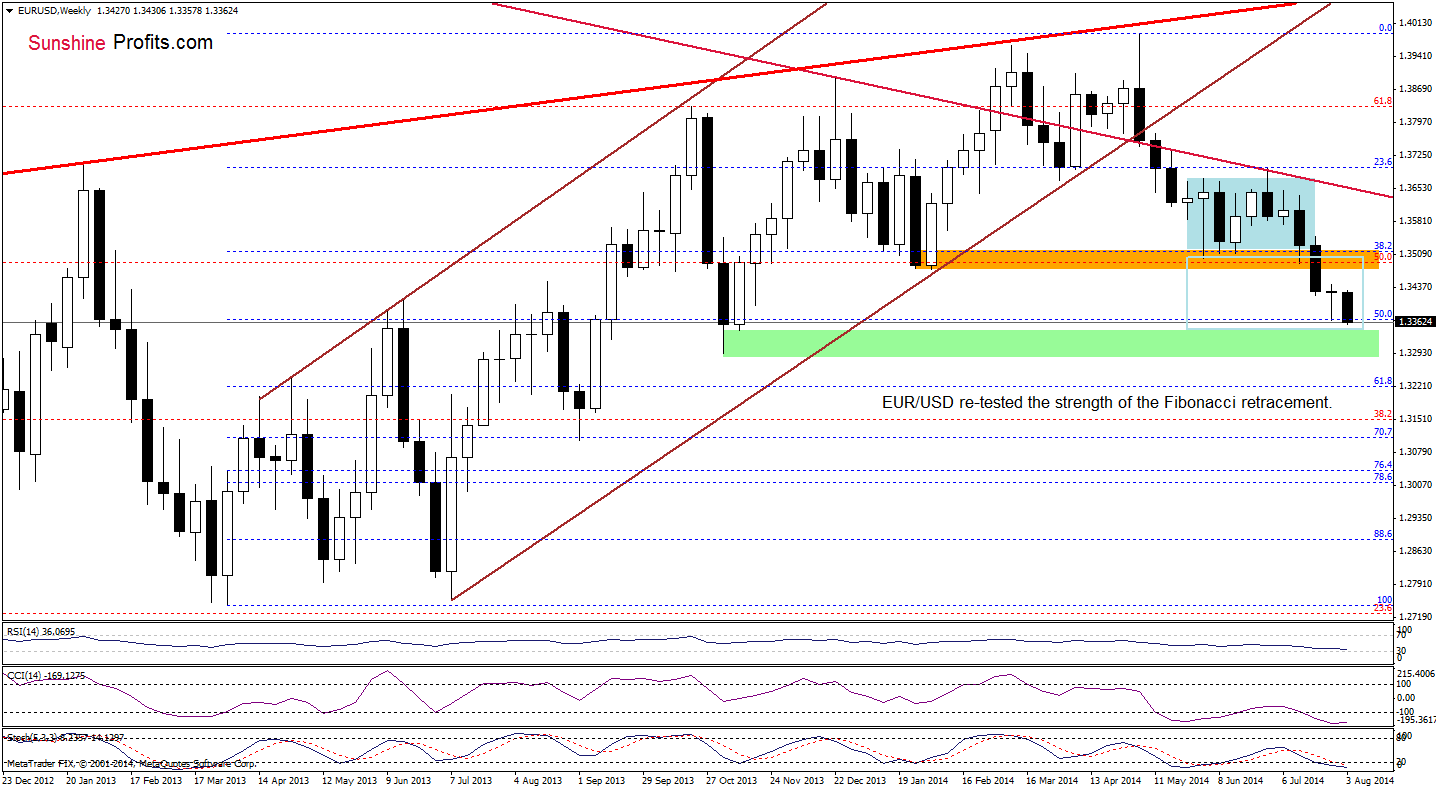
(…) EUR/USD extended losses and reached our initial downside target. (…) this support level triggered a corrective upswing, but the size of the move is too small at the moment to say that the medium-term outlook has improved. Therefore, as long as the exchange rate remains below the last week’s high another test of the strength of the 50% Fibonacci retracement and attempt to reach the next downside target can’t be ruled out.
Looking at the above chart, we see that the situation developed in tune with the above-mentioned commentary and the exchange rate declined to slightly below the 50% Fibonacci retracement. So far, this move is barely visible from this perspective, which may result in a rebound from here – similarly to what we saw in the previous week. However, if the pair moves lower, we may see a realization of the bearish scenario that we discussed in our Forex Trading Alert posted on July 23:
(…) we may see a drop even to around 1.3320, where the size of the downswing will correspond to the height of the consolidation.
Will we see such drop in the coming week? Let’s examine the very short-term chart.
Yesterday, we wrote the following:
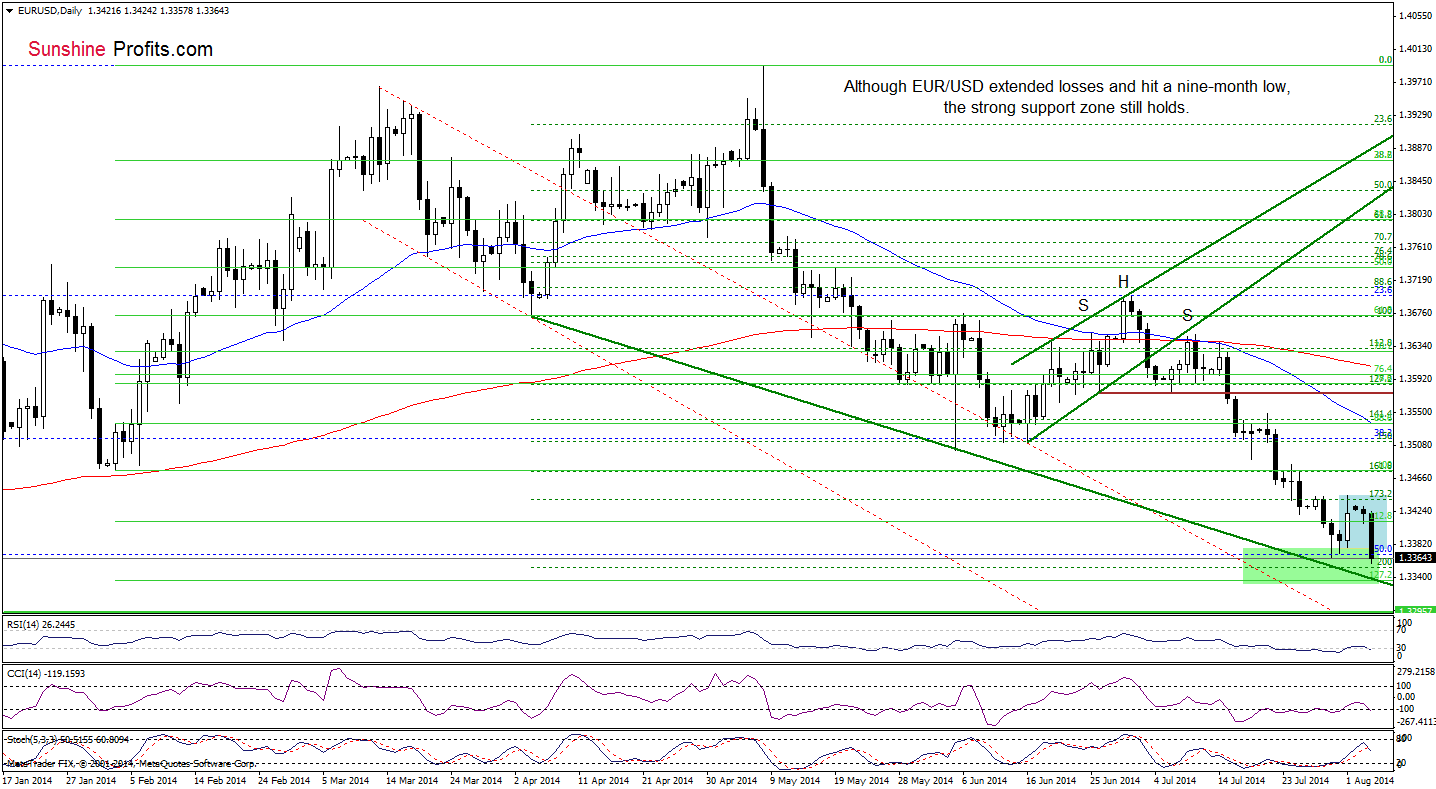
(…) the recent days have formed a consolidation. (...) if the exchange rate moves below Friday’s low, EUR/USD will test the strength of the green support zone.
As you see on the above chart, the exchange rate not only dropped under the lower border of the consolidation, but also declined slightly below last week’s low, hitting a fresh 2014 low. Despite this downswing, EUR/USD is trading in the green support zone, still above the 200% Fibonacci extension based on the Apr-May increase, the 127.2% Fibonacci extension based on the entire Feb-Ma rally and the medium-term green support line. In our opinion, as long as there is no breakdown below these levels, another sizable downward move is not likely to be seen. Please note that if this area holds, we’ll see another corrective upswing (similar to the one that we saw on Friday) in the near future.
Very short-term outlook: mixed
Short-term outlook: bearish
MT outlook: bearish
LT outlook: bearish
Trading position (short-term): In our opinion no positions are justified from the risk/reward perspective and it seems that taking profits off the table yesterday, was a good idea. We will keep you informed should anything change, or should we see a confirmation/invalidation of the above.
USD/CAD
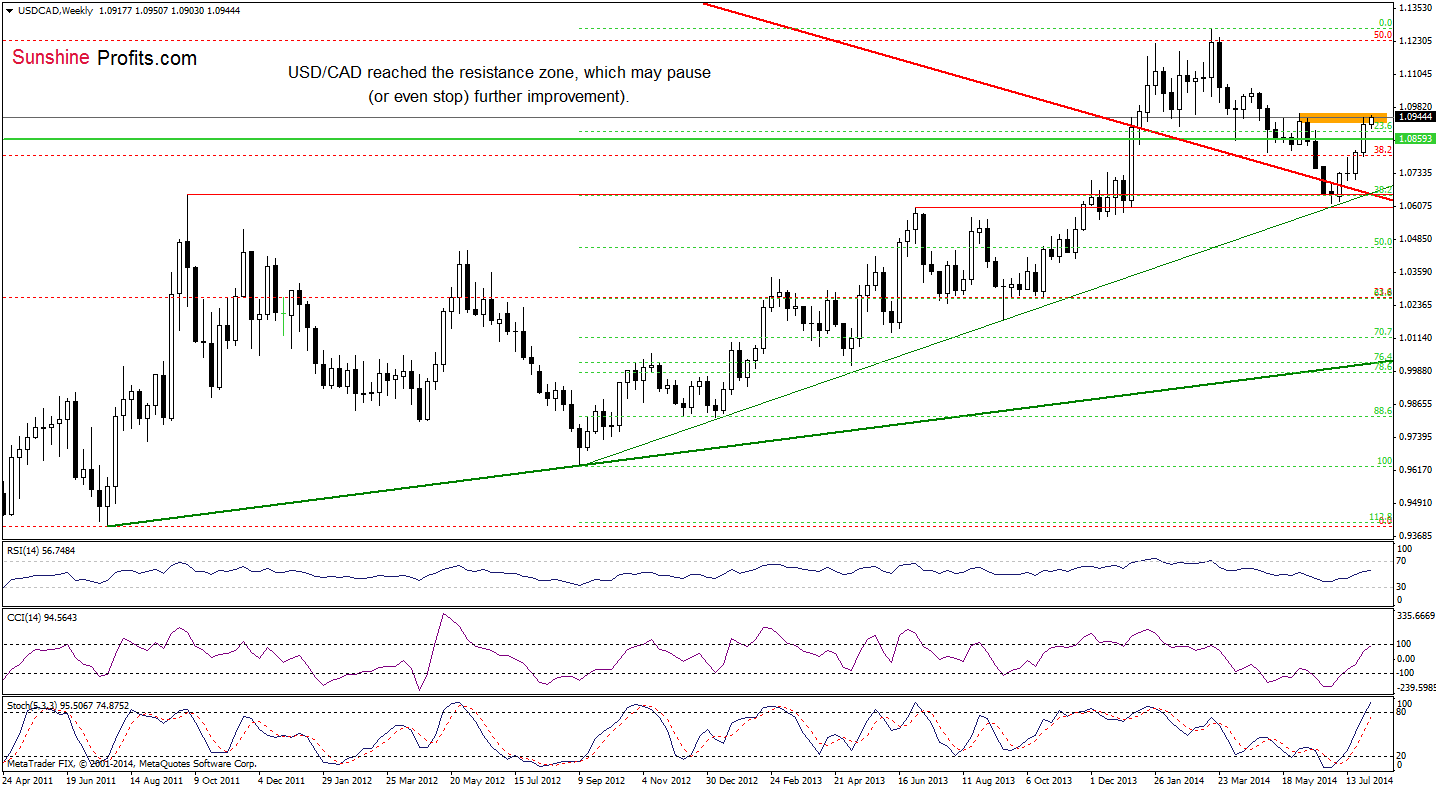
From this perspective, we see that the situation in the medium term has improved as USD/CAD extended rally and reached the resistance zone created by the June highs. Taking this fact into account, we should consider two scenarios. On one hand, if this area holds, we’ll see a pulback in the coming week (or weeks). However, if currency bulls do not give up and the exchange rate breaks above it, the pair will likely increase to around 1.1038-1.1052, where the April highs are. Will the daily chart give us any clearer clues where the pair head next? Let’s check.
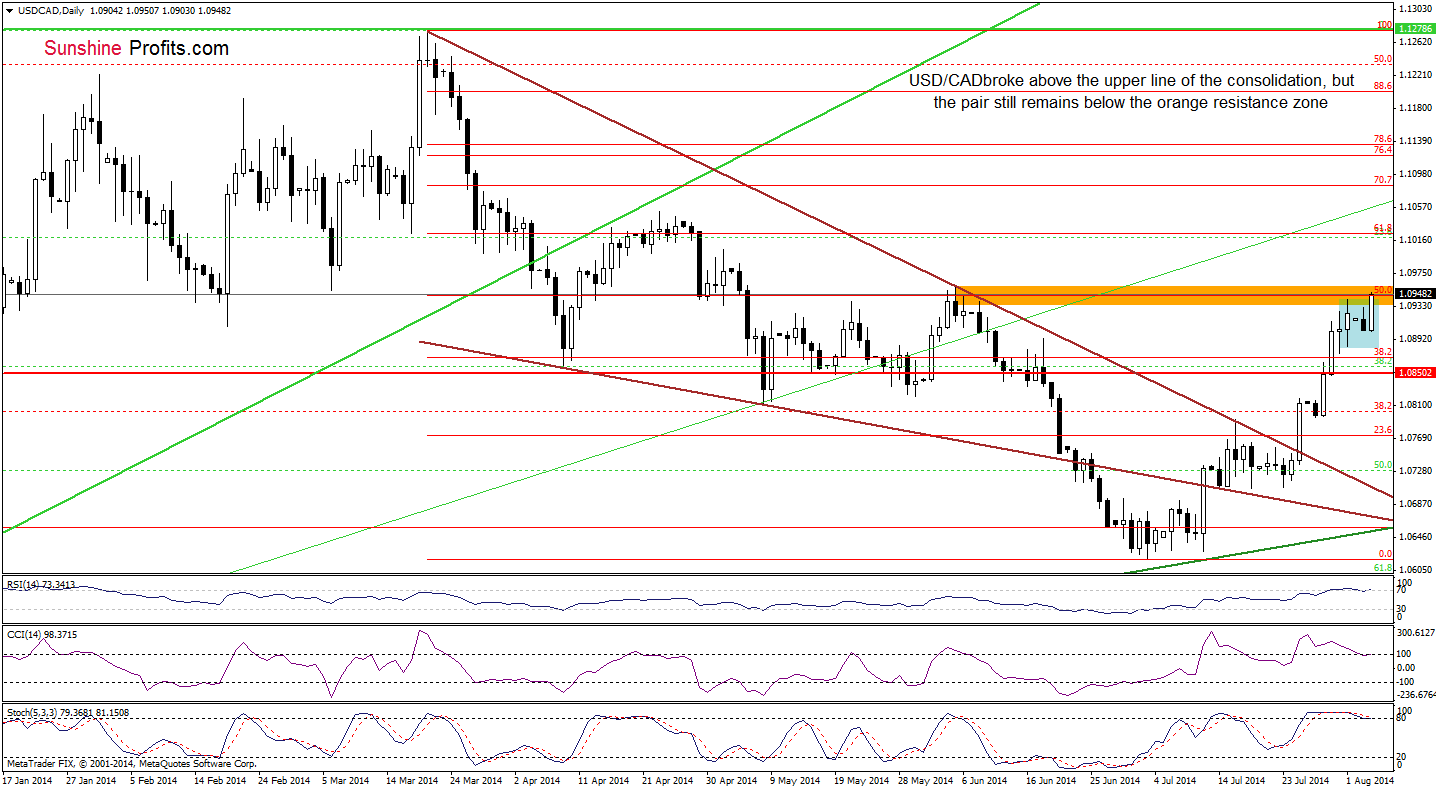
As you see on the above chart, the situation has improved once again as USD/CAD broke above the upper line of the consolidation range. With this upswing, the exchange rate reached the resistance zone created by the 50% Fibonacci retracement and June highs. As we mentioned earlier, this is the place from where the pair could go both north and south. Looking at the current position of the indicators, we clearly see that the RSI increased above the level of 70, while the CCI and Stochastic Oscillator are overbought. On top of that, there are negative divergences between them and the exchange rate. What does it mean for USD/CAD? In our opinion, a pause or correction is just round the corner – especially if the indicators generate sell signals. Nevertheless, until this time another attempt to move higher can’t be ruled out. If this is the case, it seems to us that the next upside target will be the 61.8% Fibonacci retracement based on the entire March-July decline (around 1.1023).
Very short-term outlook: mixed
Short-term outlook: mixed
MT outlook: mixed
LT outlook: bearish
Trading position (short-term): In our opinion no positions are justified from the risk/reward perspective. We will keep you informed should anything change, or should we see a confirmation/invalidation of the above.
USD/CHF
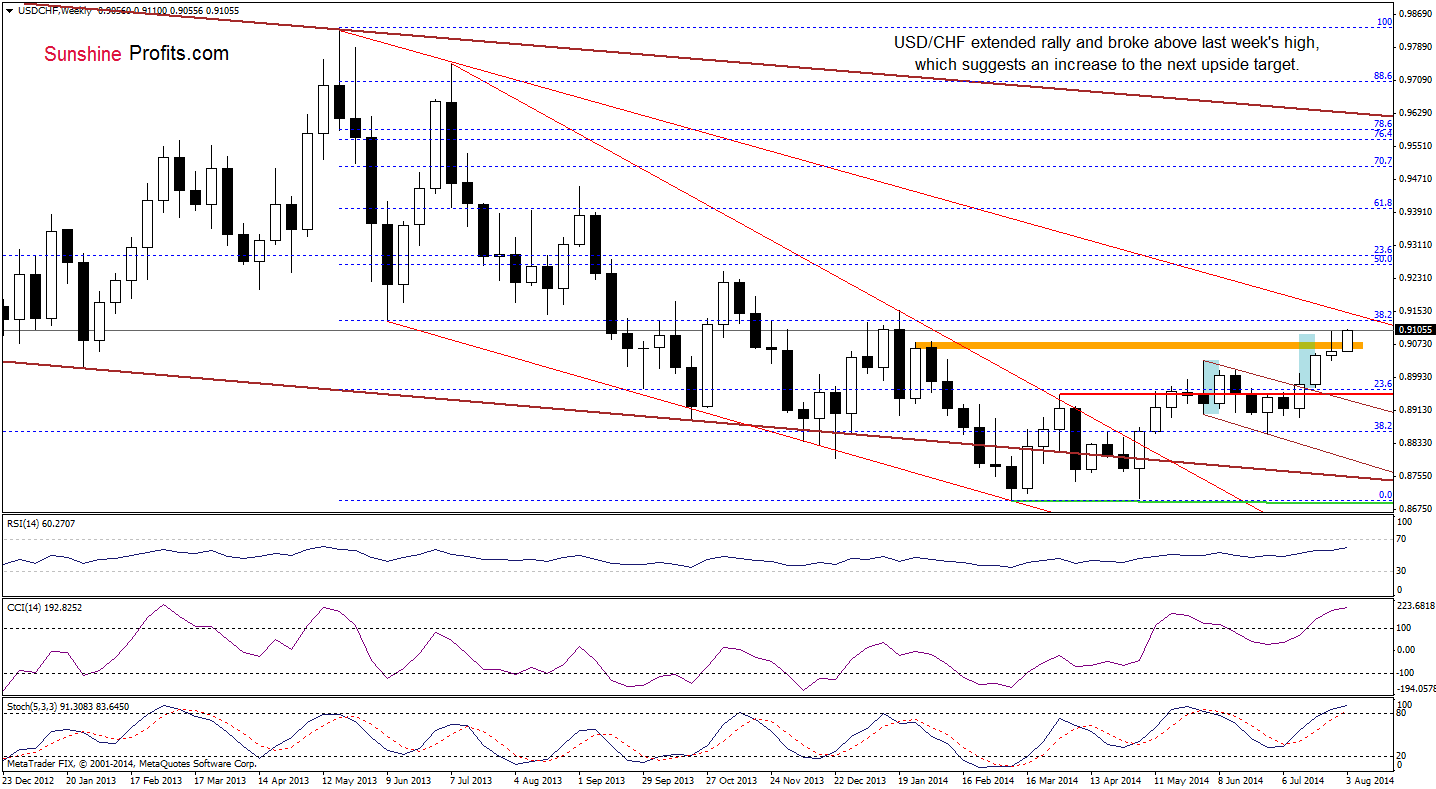
As you see on the above chart, the situation in the medium term has improved as USD/CHF extended rally, which means that our last commentary on this currency pair is up-to-date:
(…) the pair is still trading near last week’s high, which suggests that currency bulls may try to push the exchange rate higher – to the 38.2% Fibonacci retracement based on the entire May 2013-March 2014 decline (this area is also reinforced by the long-term declining resistance line, which will likely stop further improvement). Nevertheless, we should keep an eye on the current USD/CHF moves because the position of the indicators suggests that correction in the coming week (or weeks) is quite likely.
Are there any short-term factors that could stop further improvement? Let’s check.
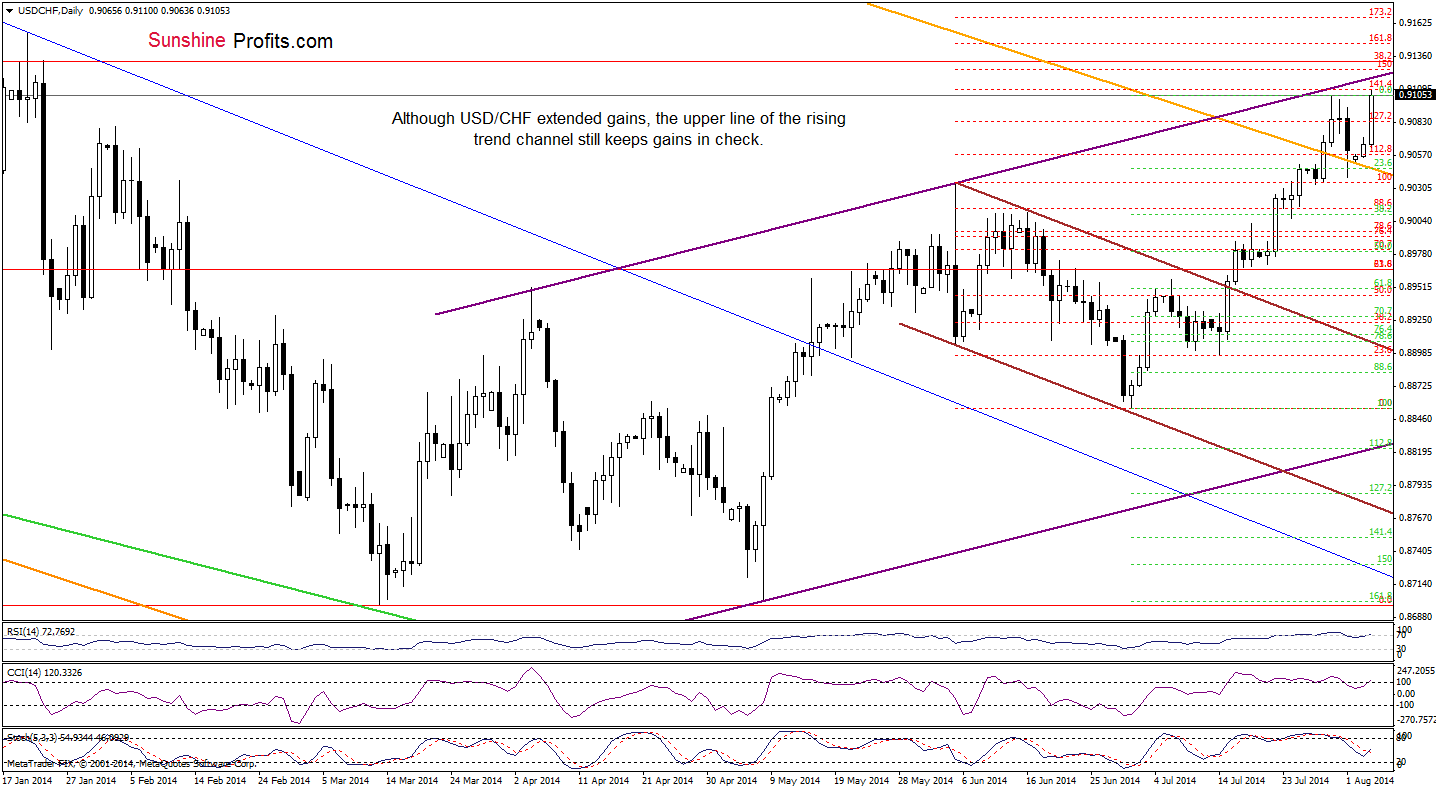
In our previous Forex Trading Alert, we wrote:
(…) the exchange rate broke above the 127.2% Fibonacci extension and approach the upper line of the rising trend channel last week. The proximity to this strong resistance encouraged forex traders to push the sell button, which resulted in a pullback to the previously-broken orange support/resistance line. So far, it holds, which means that we may see another attempt to break above the upper border of the trend channel in the near future.
On the above chart, we see that the exchange rate moved higher once again as we expected. With this upswing, the pair reached the 141.4% Fibonacci extension and approached the upper line of the rising trend channel once again. If history from the previous week repeats itself, we’ll see a pullback from here in the coming day (or days). Please note that this scenario is currently reinforced by the position of the RSI, which remains above the key level of 70, suggesting that a pause or correction is just around the corner.
Very short-term outlook: mixed
Short-term outlook: mixed
MT outlook: mixed with bullish bias
LT outlook: bearish
Trading position (short-term): In our opinion no positions are justified from the risk/reward perspective. We will keep you informed should anything change, or should we see a confirmation/invalidation of the above.
Thank you.
Nadia Simmons
Forex & Oil Trading Strategist
Przemyslaw Radomski, CFA
Founder, Editor-in-chief
Gold & Silver Trading Alerts
Forex Trading Alerts
Oil Investment Updates
Oil Trading Alerts

