
Earlier today, official data showed that the number of employed people in Canada declined by 9,400 in June, missing expectations for a 20,000 rise. Additionally, Canada's unemployment rate rose to 7.1% in June, from 7.0% in the previous month. As a result, the greenback shot up against Canadian dollar and the USD/CAD pair invalidated the breakdown below the medium-term resistance line. What happened at the same time with other currency pairs? What is their current outlook?
In our opinion the following forex trading positions are justified - summary:
EUR/USD
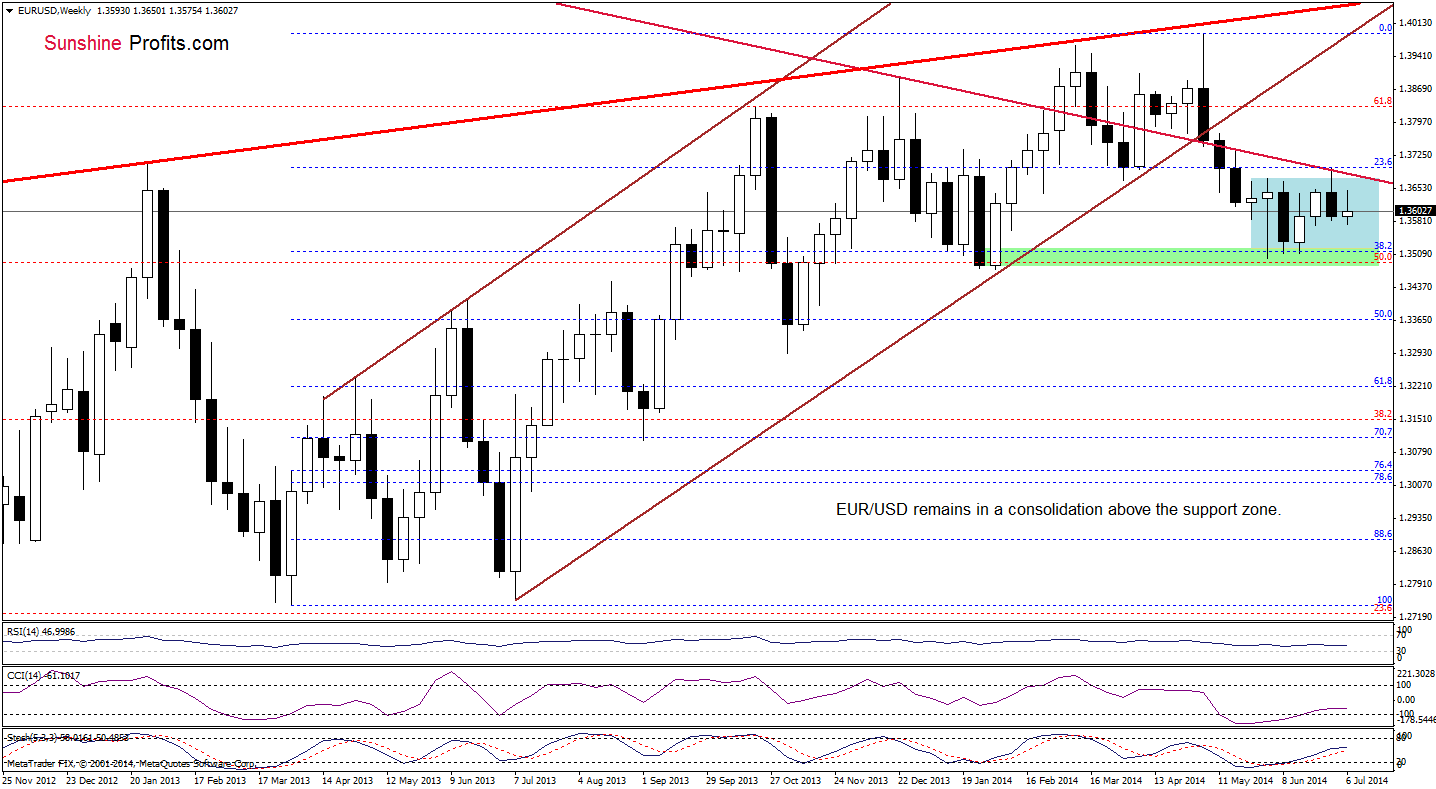
Although EUR/USD rebounded slightly earlier this week, the situation in the medium term hasn’t changed much as the exchange rate still remains in the consolidation below the long-term resistance line. Will we see another attempt to move higher in the coming week? Or maybe the pair will extend losses? Let’s examine the daily chart and look for answers.
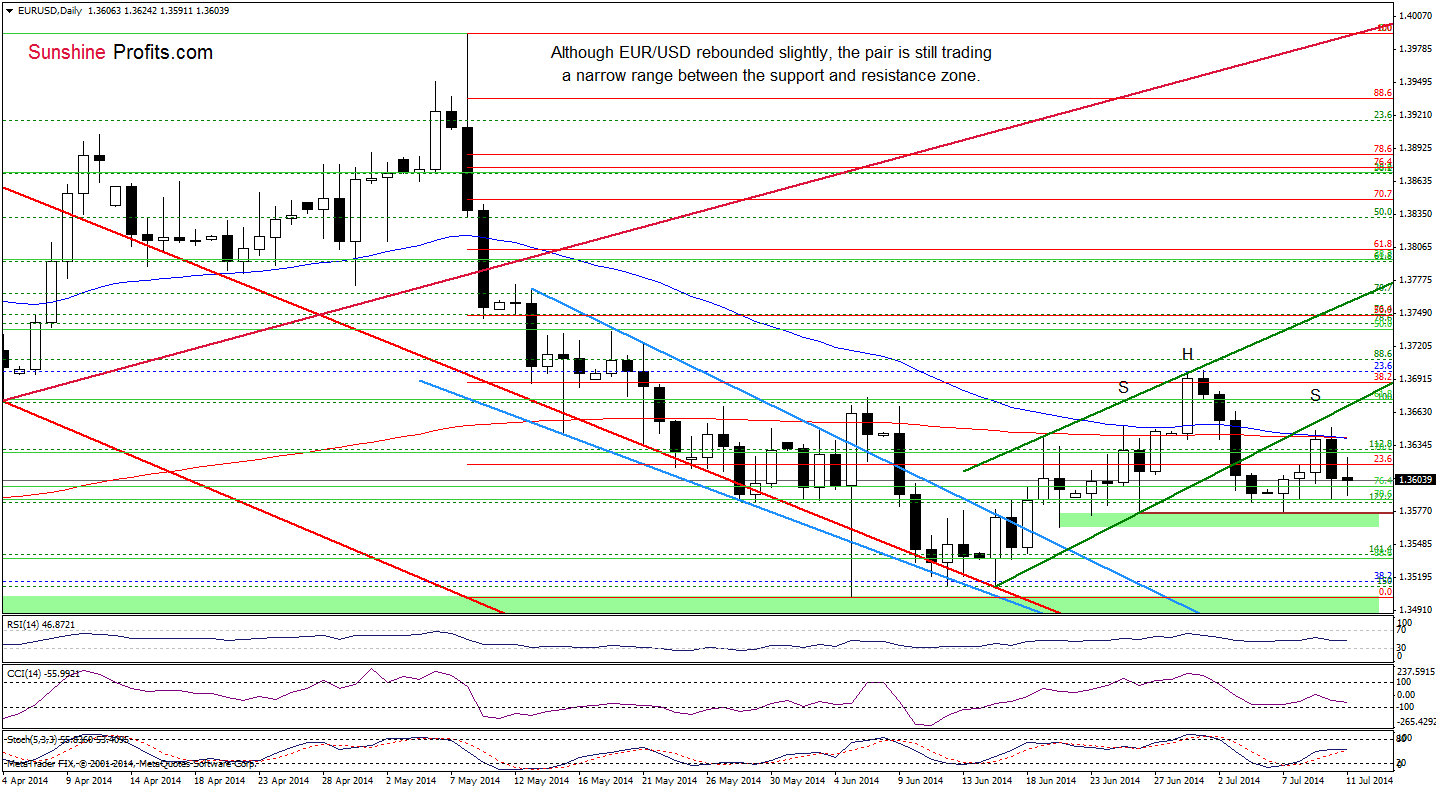
Earlier today, the exchange rate moved little higher, but this improvement was only very temporarily as the proximity to the strong resistance zone (created by the 50- and 200-day moving averages) triggered another decline. As a result, the pair dropped below 1.3600 and approached yesterday’s low. Taking into account the fact that EUR/USD is still trading inside Thursday ‘s candlestick, we remain convinced that our Wednesday’s commentary on this currency pair is still up-to-date:
(…) The first thing that catches the eye on the daily chart is a potential head and shoulders reversal formation. Although it’s not complete at the moment, we think that the pair is currently building the right shoulder of this pattern. If this is the case and EUR/USD declines from here, we’ll see a correction to the neck line based on the June 26 and July 7 lows (but further deterioration will be even more likely if the pair drops below the green support zone). If this area is broken, the exchange rate will test the strength of the June lows, where the size of a downswing will correspond to the height of the formation (this scenario is currently reinforced by the strong resistance zone created by the 50- and 200-day moving averages).
Very short-term outlook: bearish
Short-term outlook: mixed with bearish bias
MT outlook: bearish
LT outlook: bearish
Trading position (short-term; our opinion): In our opinion no positions are justified from the risk/reward perspective. We will keep you informed should anything change, or should we see a confirmation/invalidation of the above.
GBP/USD
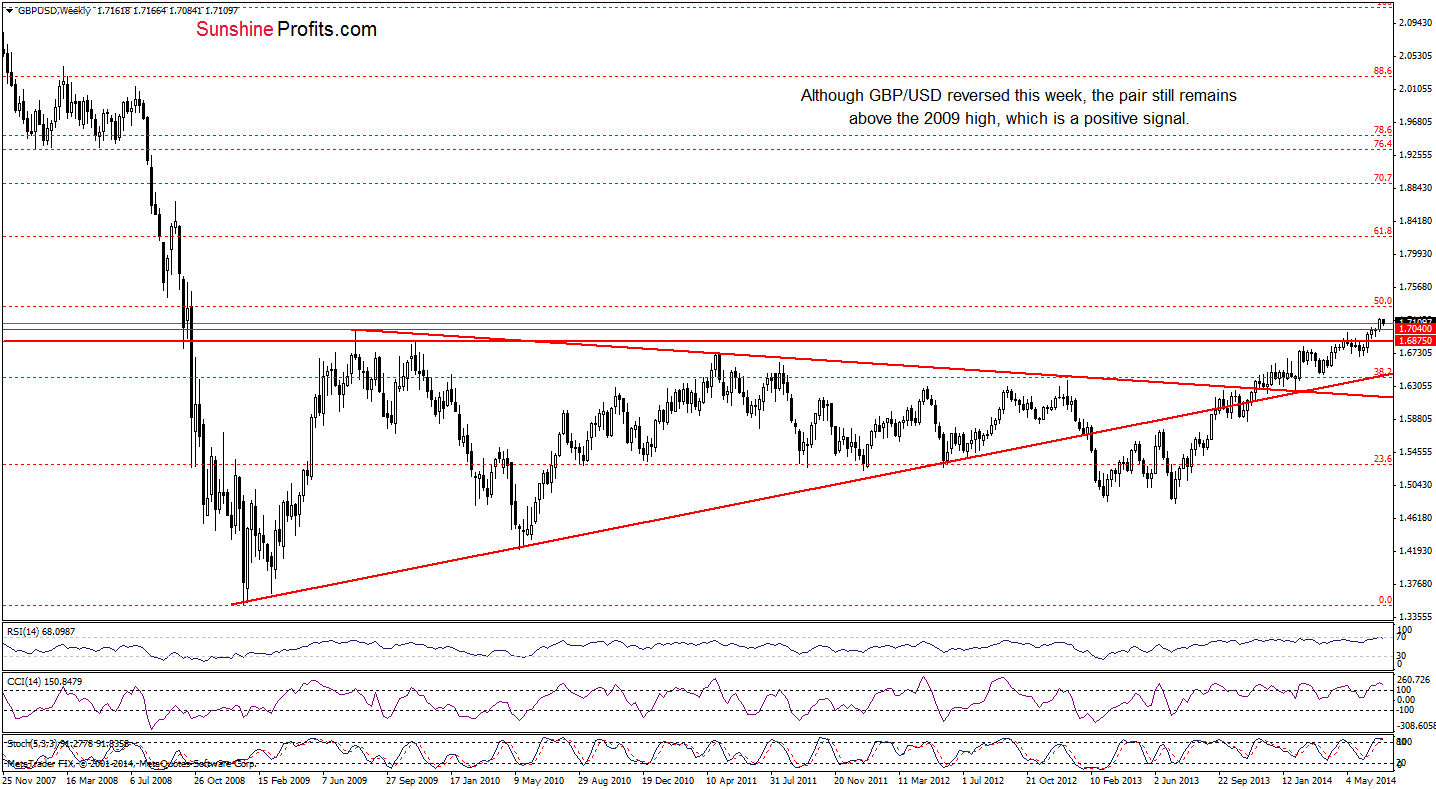
Looking at the above chart, we see that although GBP/USD reversed and declined, the pair is still trading above the 2009 high. Therefore, our last commentary on this currency pair is still valid:
(…) we think that another sizable downward move will be more likely only if the exchange rate invalidates the breakout above this horizontal support line. Please note that the CCI and Stochastic Oscillator are overbought, while the RSI reached the level of 70, which together suggests that correction is just around the corner.
Will the very short-term picture give us more precise clues about future moves?
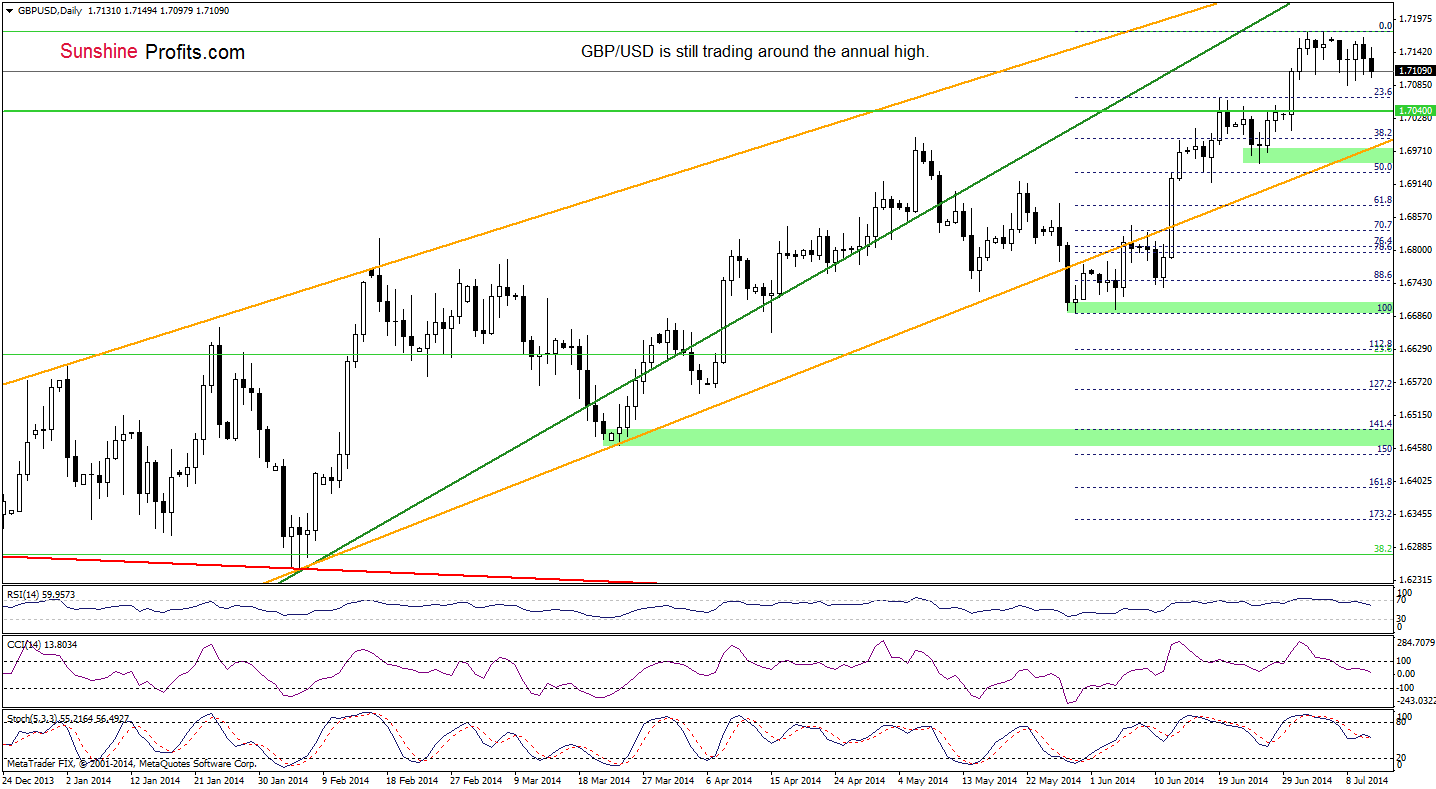
As you see on the daily chart, the situation hasn’t changed much since our last commentary on GBP/USD was posted. Therefore, what we wrote on Tuesday is still up-to-date:
(…) the indicators (…) generated sell signals, which will likely encourage forex traders to push the sell button. If this is the case, we’ll see further declines and the initial downside target will be the green horizontal support line (the 2009 high). If it withstand the selling pressure, GBP/USD would rebound and come back to around recent highs. But if this important line is broken, we’ll see a drop to the green support zone created by the medium-term orange support line and the bottom of the previous correction (around 1.6950).
Very short-term outlook: bearish
Short-term outlook: mixed with bearish bias
MT outlook: bearish
LT outlook: mixed
Trading position (short-term): In our opinion, no positions are justified from the risk/reward perspective. We will keep you informed should anything change, or should we see a confirmation/invalidation of the above.
USD/JPY
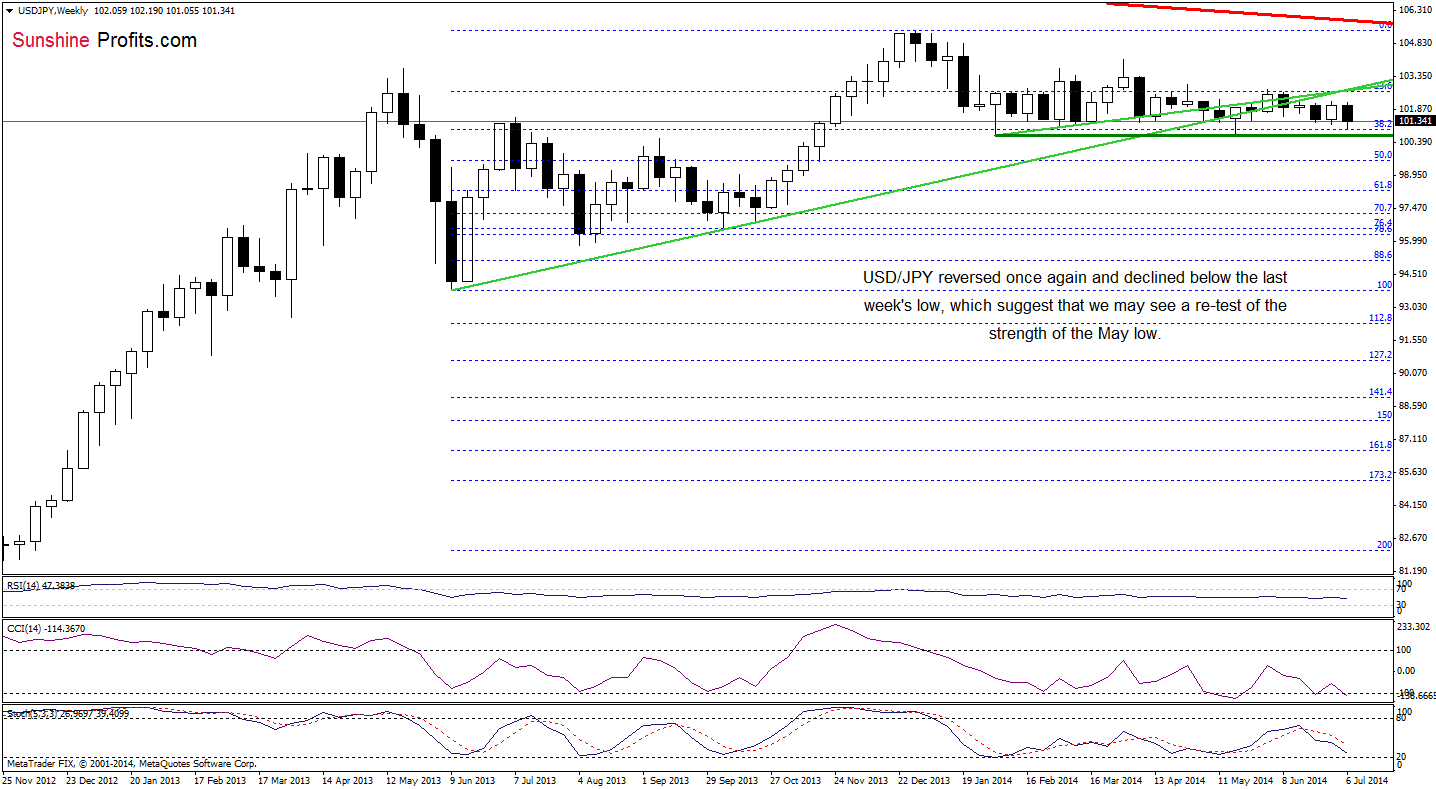
Earlier this week, USD/JPY reversed once again and declined below the last week’s low, which is a negative signal that suggests further deterioration – especially when we factor in sell signals generated by the indicators. Despite this drop, the situation in the medium term hasn’t changed much as the pair still remains between the medium-term support/resistance and the May low of 100.81. In our opinion, as long as there is no breakout above the nearest resistance (or breakdown below the major support) another sizable move is not likely to be seen.
Having say that, let’s find out what can we infer from the very short-term picture.
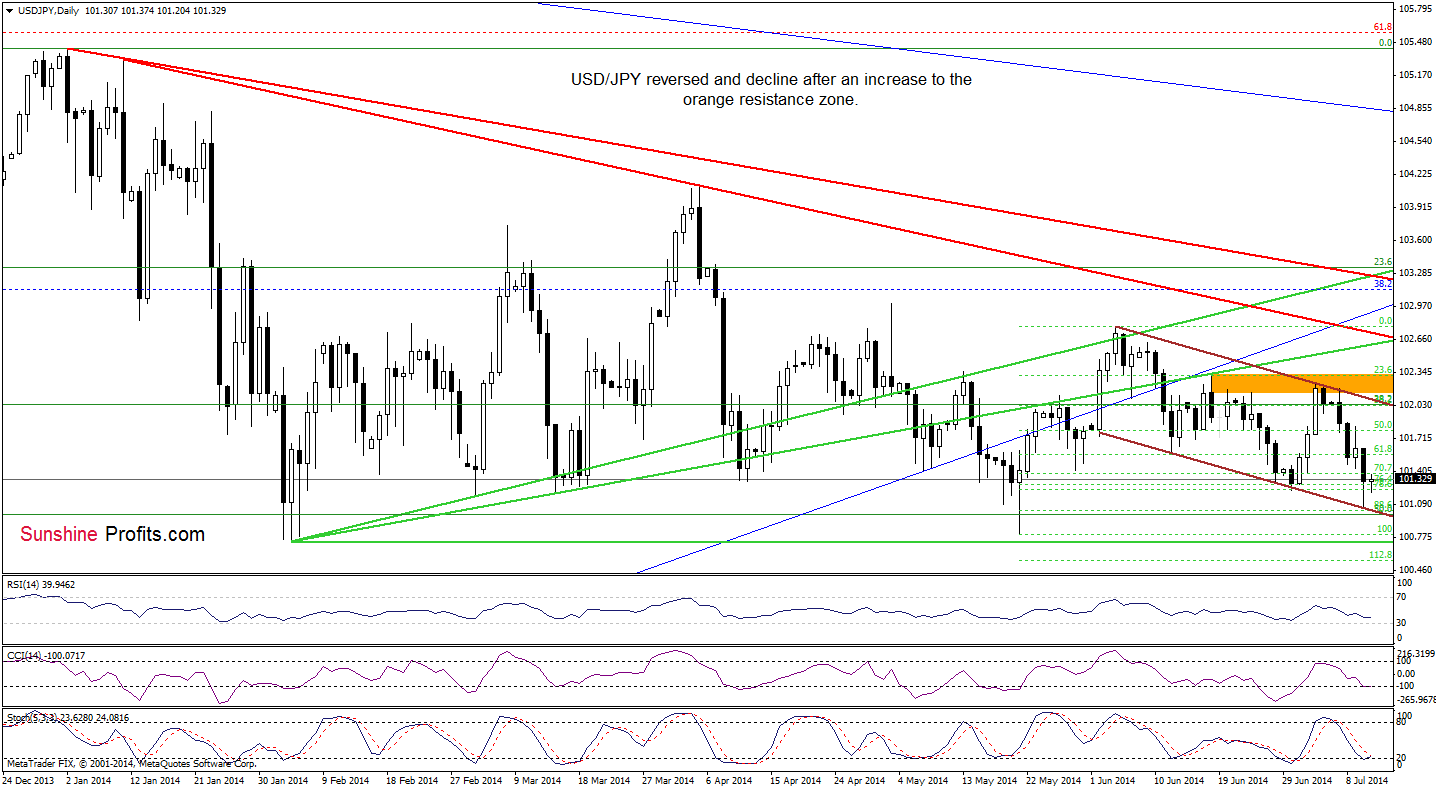
From this perspective, we see that USD/JPY reversed after an increase to the orange resistance zone and declined sharply earlier this week, slipping below the June low. Although this is a negative signal, the pair almost touched the 88.6% Fibonacci retracement and reached the lower border of the declining trend channel (marked with brown). Taking these support lines into account, we think that the space for further declines might be limited - especially if the CCI and Stochastic Oscillator (which are currently oversold) generate buy signals in the coming days. Therefore, if we see such action, the pair will rebound and the initial upside target will be the upper line of the formation (currently around 102.06).
Very short-term outlook: mixed with bullish bias
Short-term outlook: mixed with bullish bias
MT outlook: mixed
LT outlook: bearish
Trading position (short-term): In our opinion no positions are justified from the risk/reward perspective at the moment. We will keep you informed should anything change, or should we see a confirmation/invalidation of the above.
USD/CAD
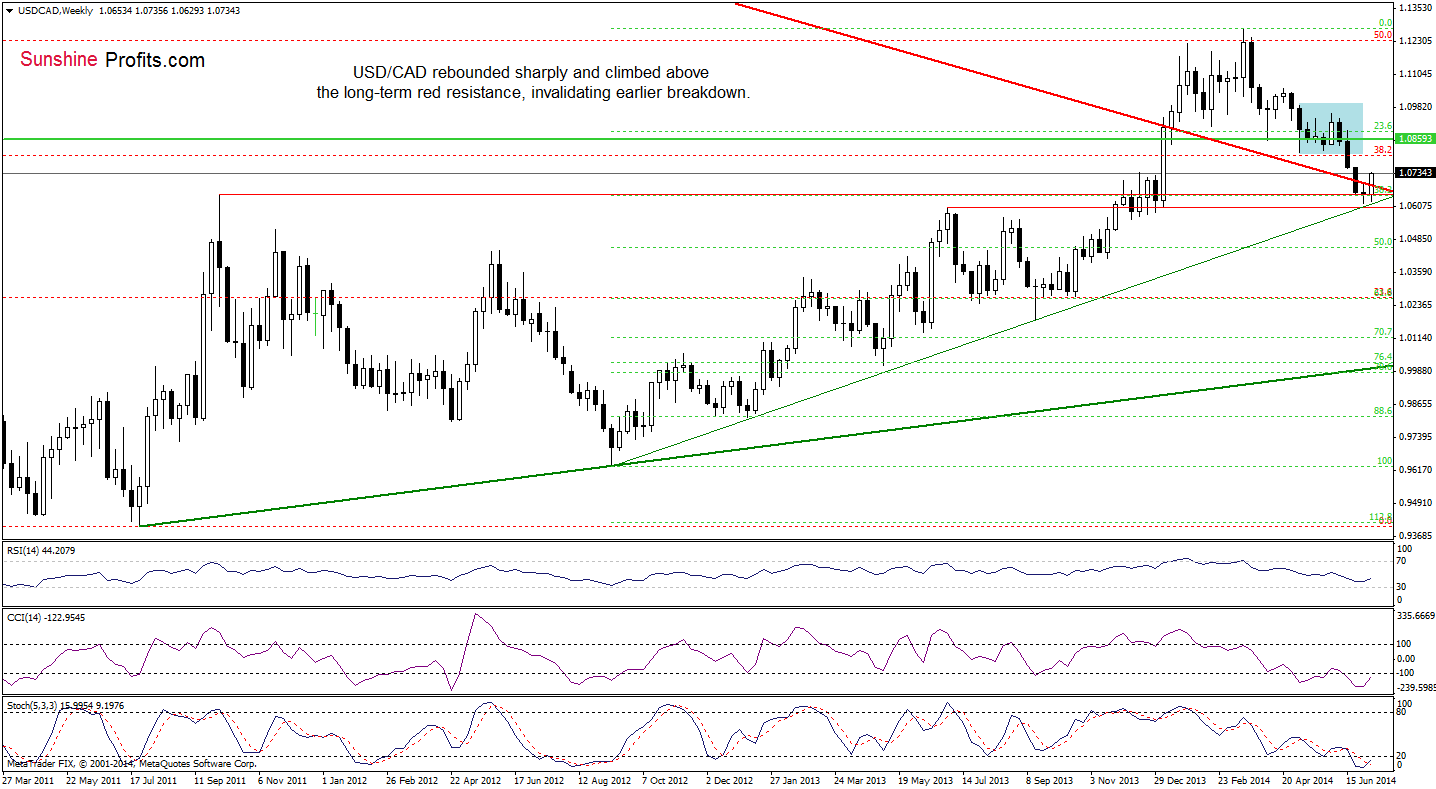
Quoting our Forex Trading Alert posted on July 7:
(…) Taking into account the (…) strong support zone and combining it with the current position of the indicators, it seems to us that currency bulls will try to push the exchange higher in the coming week (or weeks).
As you see on the weekly chart, we noticed such price action and USD/CAD rebounded sharply, invalidating last month’s breakdown below the red declining support/resistance line. This is a strong bullish signal that will likely encourage forex traders to push the buy button, which may translate to further improvement (especially if the CCI and Stochastic Oscillator generate buy signals). If this is the case, the initial upside target will be around 1.0813, where the previously-broken lower border of the consolidation (marked with blue) is.
Having discussed the above, let’s move on to the daily chart.
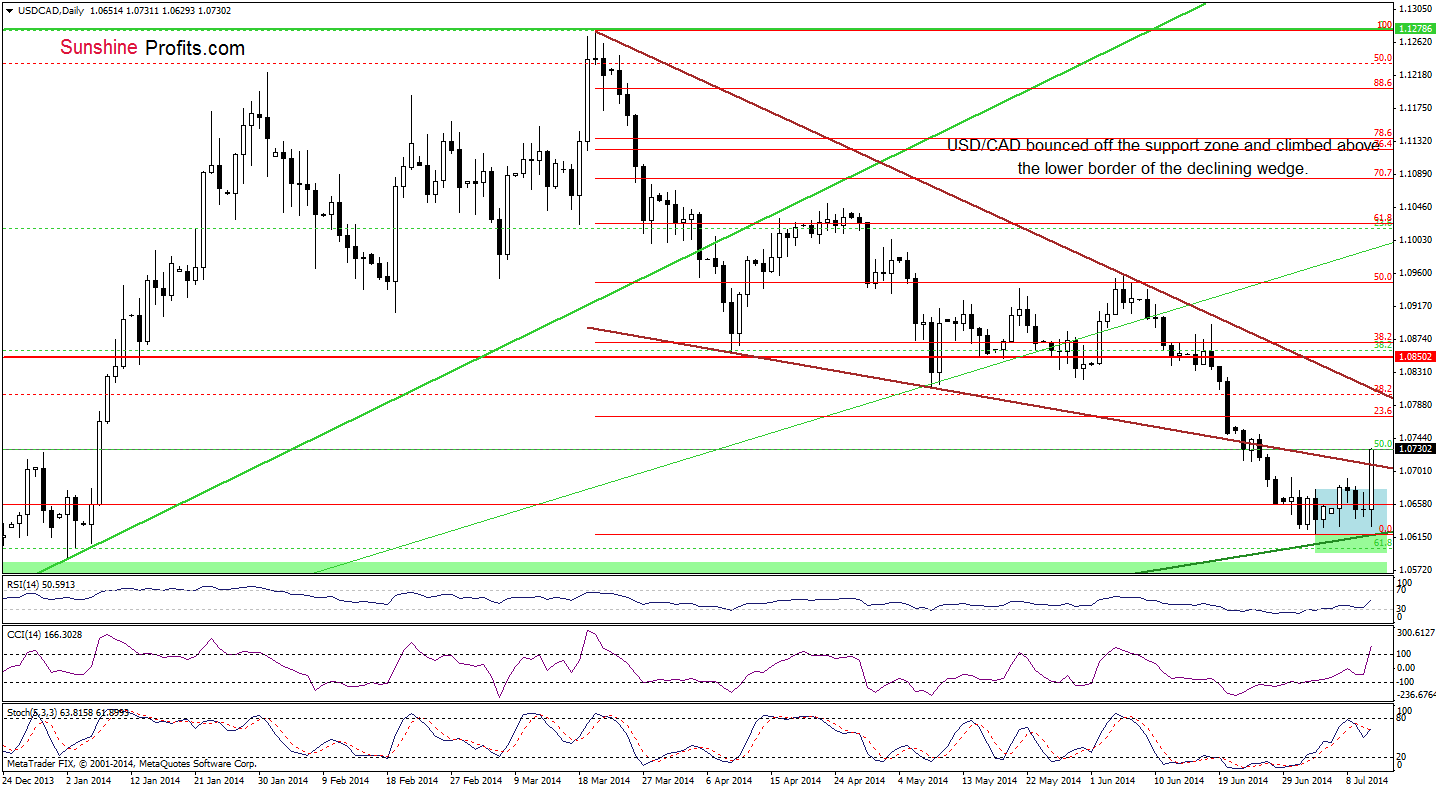
In our last commentary on this currency pair, we wrote the following:
(…) USD/CAD has been trading in a consolidation slightly above the support zone created by long-term green support line and the 61.8% Fibonacci retracement. (…) if currency bulls do not give up and push the pair above the July 3 high of 1.0678, we’ll likely see further improvement and an increase to the previously-broken lower border of the declining wedge. However, if the pair drops below Thursday low, we’ll see a test of the strength of the support zone.
Looking at the above chart, we see that although USD/CAD climbed above the July 3 high, this breakout was quickly invalidated, which triggered a decline that approached the pair to the above-mentioned support zone. As you see on the daily chart, this area withstood the selling pressure, which resulted in a sharp rebound earlier today. With this upswing, the exchange rate climbed above the lower border of the declining wedge, invalidating earlier breakdown. This is a strong bullish signal, which may accelerate further improvement. If this is the case, the initial upside target for currency bulls will be around 1.0773, where the 23.6% Fibonacci retracement (based on the entire March-July decline) is. If it is broken, the next target will be the upper line of the declining wedge (currently around 1.0811).
Very short-term outlook: bullish
Short-term outlook: mixed
MT outlook: mixed
LT outlook: bearish
Trading position (short-term): In our opinion no positions are justified from the risk/reward perspective. We will keep you informed should anything change, or should we see a confirmation/invalidation of the above.
USD/CHF
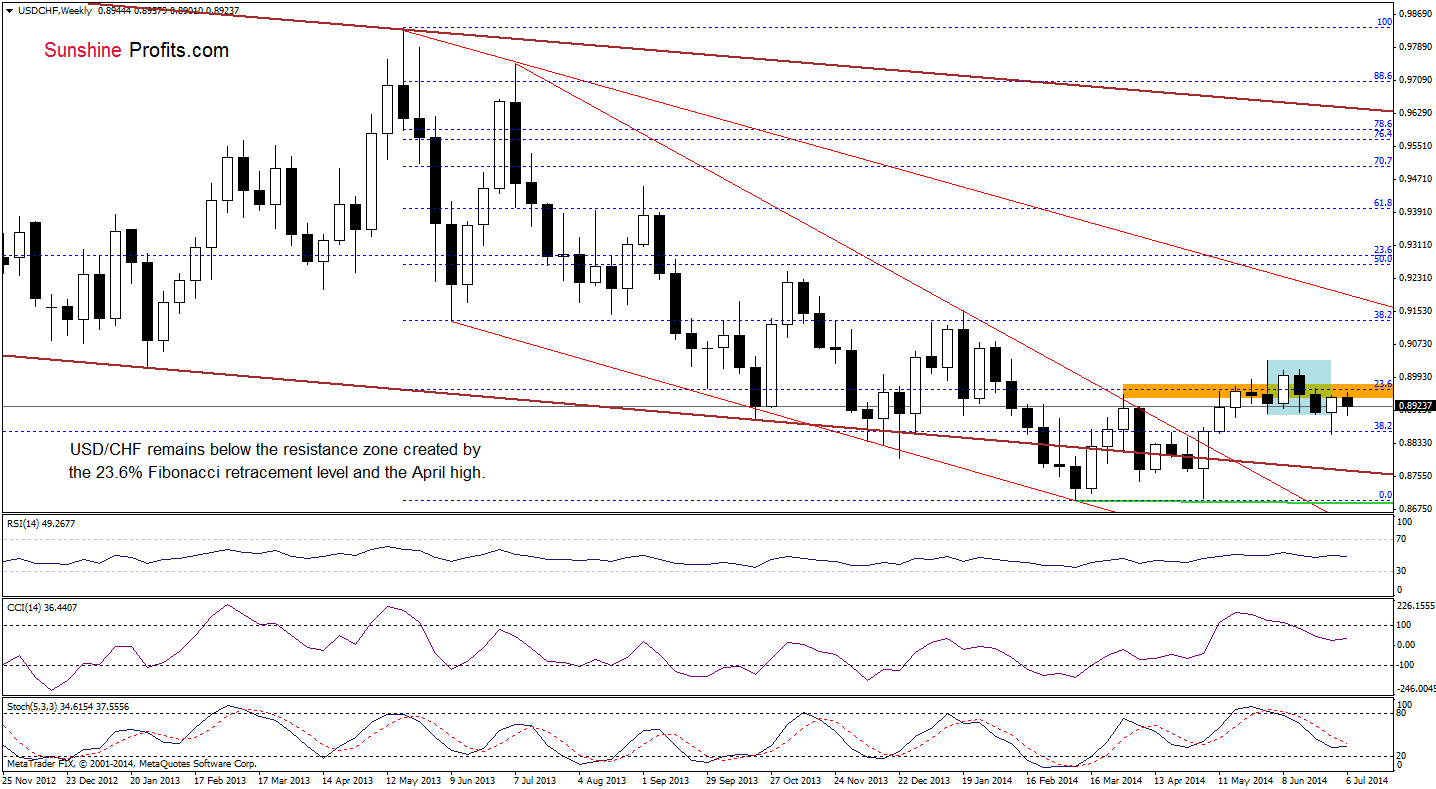
From this perspective, we see that the situation hasn’t changed much since our last commentary on this currency pair was posted. Therefore, it is up-to-date:
(…) although USD/CHF rebounded in the previous week, the resistance zone created by the March high and the 23.6% Fibonacci retracement stopped further improvement, triggering another downswing. Taking this fact into account and combining it with sell signals generated by the CCI and Stochastic Oscillator, we think that the pair will test last’s week low in the nearest future.
Will the short-term picture confirm this bearish scenario?
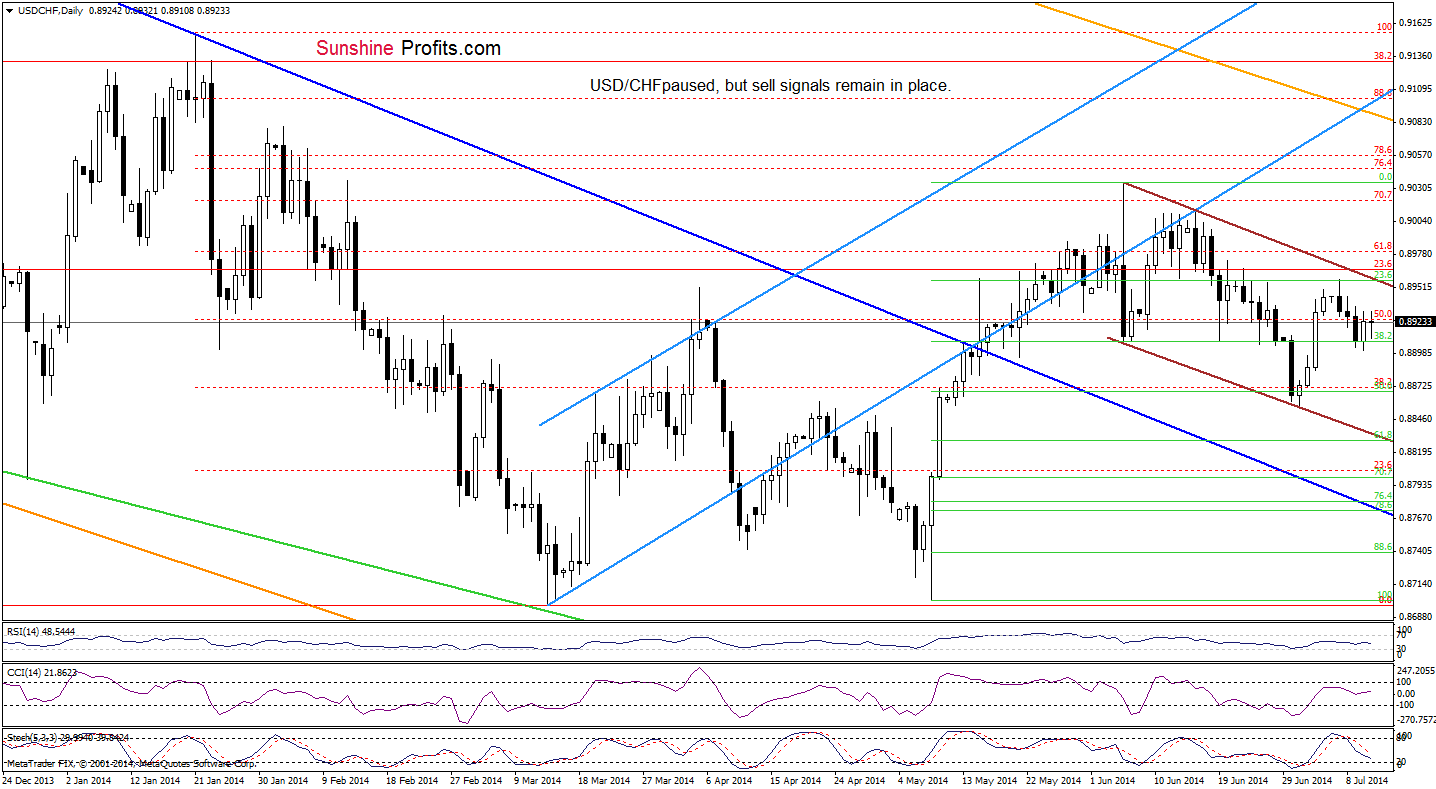
Looking at the above chart, we see that USD/CHF paused after a decline from the upper border of the declining trend channel. Although this is a positive signal, the current position of the indicators still supports the bearish case. Therefore, if the exchange rate drops below yesterday’s low, we’ll see further deterioration and a correction to the recent lows (or even to the lower border of the trend channel, if the nearest support area is broken).
Very short-term outlook: bearish
Short-term outlook: mixed with bearish bias
MT outlook: mixed with bullish bias
LT outlook: bearish
Trading position (short-term): In our opinion no positions are justified from the risk/reward perspective. We will keep you informed should anything change, or should we see a confirmation/invalidation of the above.
AUD/USD
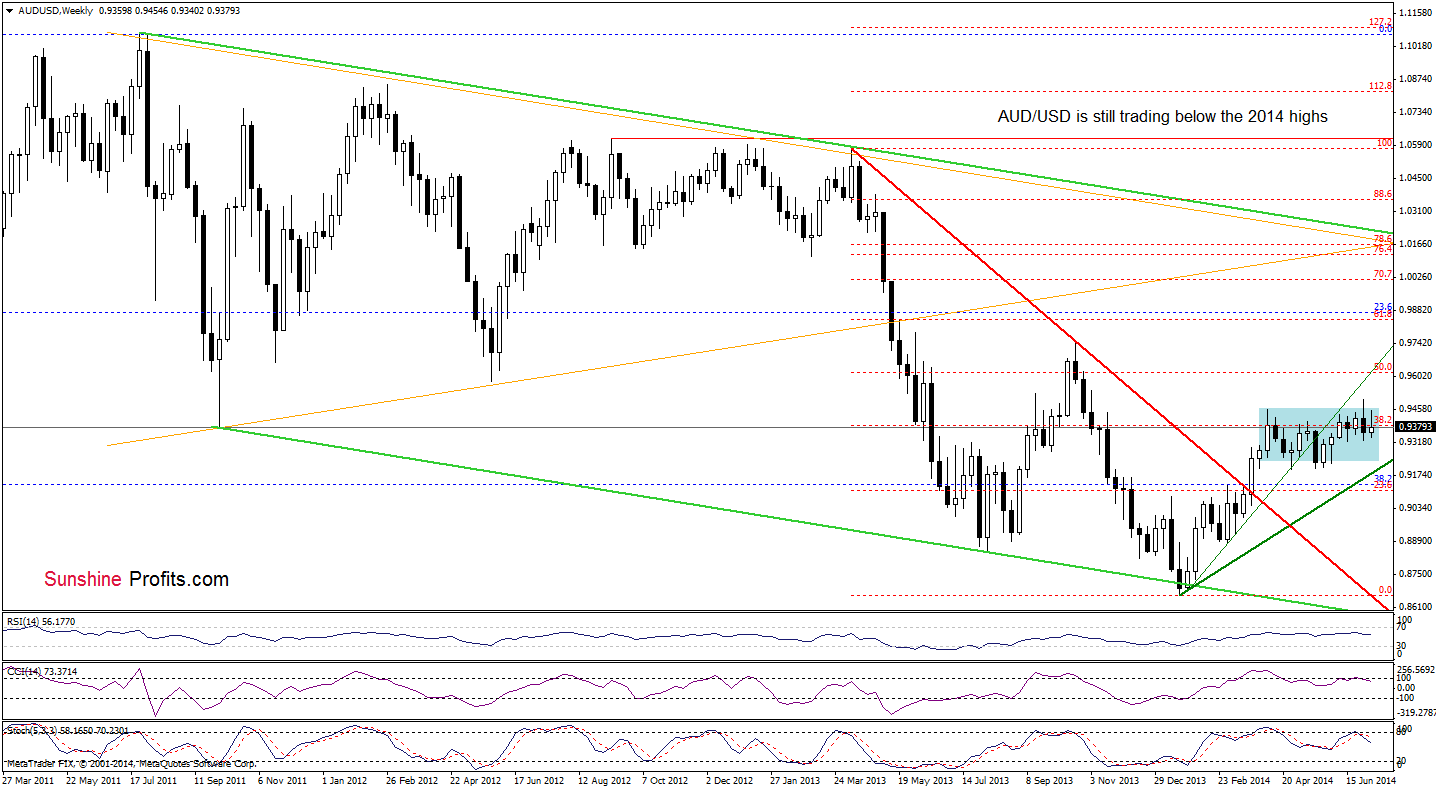
The medium-term outlook remains mixed as AUD/USD is still trading in a consolidation between the May lows and the April high. Nevertheless, we should keep in mind that the CCI and Stochastic Oscillator are overbought, which suggests that correction is just around the corner. Please note that we noticed similar readings of the indicators in mid-April. Back then, such circumstances triggered a correction, which took the pair to slightly below the lower border of the consolidation. Therefore, if history repeats itself once again, we’ll likely see a pullback to around the May low of 0.9207.
Will the very short-term chart give us any clearer clues about future moves?
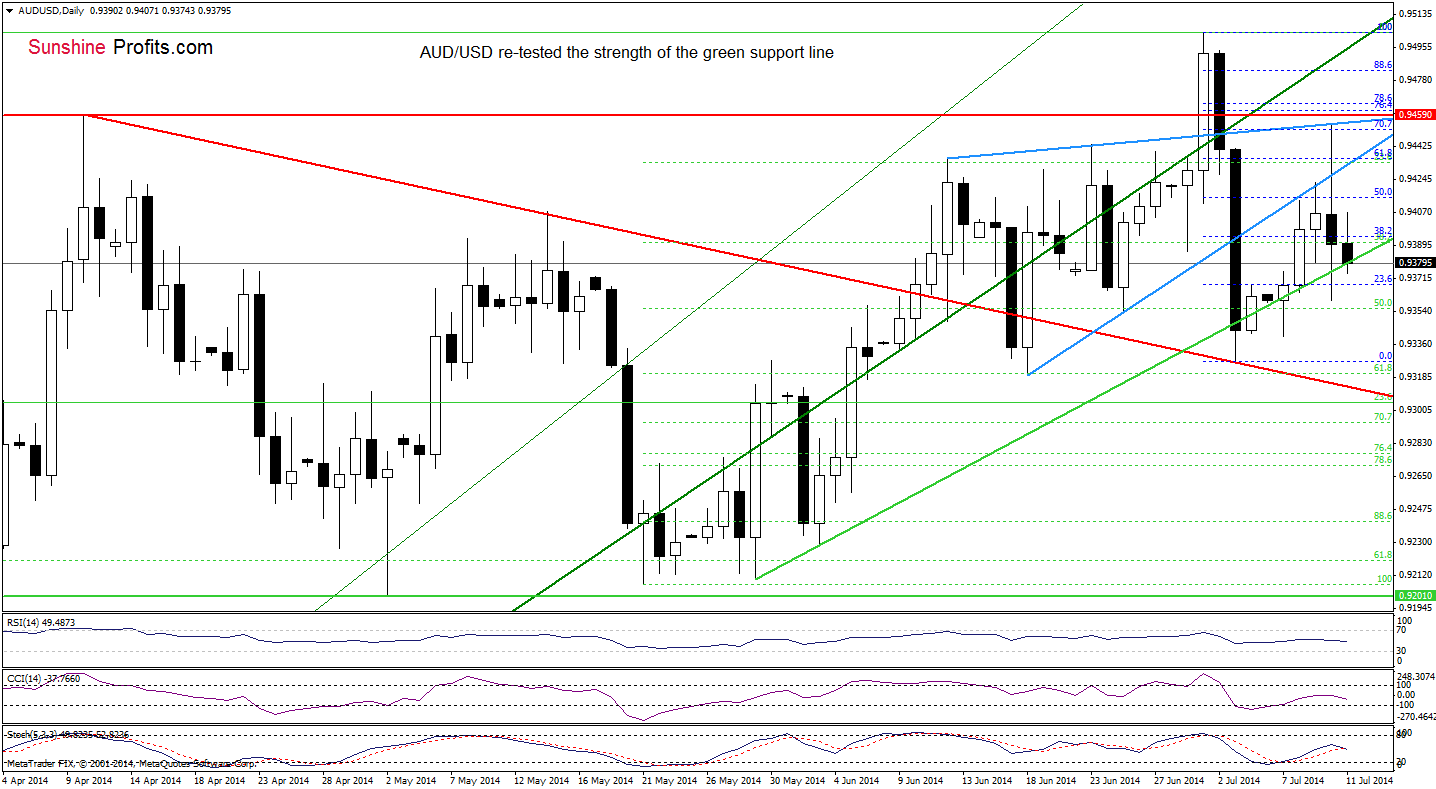
Yesterday, we wrote the following:
(…) the exchange rate declined sharply, which resulted in a temporarily drop below the rising green line. What’s next? (…) this support line stopped further deterioration several times in the previous week, which suggests that if history repeats itself once again, we’ll see another rebound and a try to break above the lower border of the rising wedge.
From this perspective, we see that the pair re-tested the strength of the above-mentioned green support line earlier today. Although AUD/USD moved below it once again, currency bulls didn’t give up and we saw another corrective upswing, which invalidated earlier breakdown. In our opinion, if this key support withstand the selling pressure, we’ll see another attempt to reach the lower border of the rising wedge. However, if this important line is broken and the pair closes the day below it, we think that the current correction will accelerate and we’ll see a drop to the July low of 0.9327 or even to the declining red support line (currently around 0.9316).
Very short-term outlook: mixed
Short-term outlook: mixed
MT outlook: mixed
LT outlook: bearish
Trading position (short-term): In our opinion, no positions are justified from the risk/reward perspective. We will keep you informed should anything change, or should we see a confirmation/invalidation of the above.
Thank you.
Nadia Simmons
Forex & Oil Trading Strategist
Przemyslaw Radomski, CFA
Founder, Editor-in-chief
Gold & Silver Trading Alerts
Forex Trading Alerts
Oil Investment Updates
Oil Trading Alerts

