
The common currency moved higher against the U.S. dollar after the Federal Reserve said in the minutes of the monetary policy meeting that its stimulus program should end likely in October. As a result, EUR/USD increased to a very important resistance area. What could happen if it stopped currency bulls’ charge?
In our opinion the following forex trading positions are justified - summary:
EUR/USD
The situation in the medium term hasn’t changed much as EUR/USD still remains in the consolidation below the long-term resistance line. Today, we’ll take a closer look at the very short-term changes.
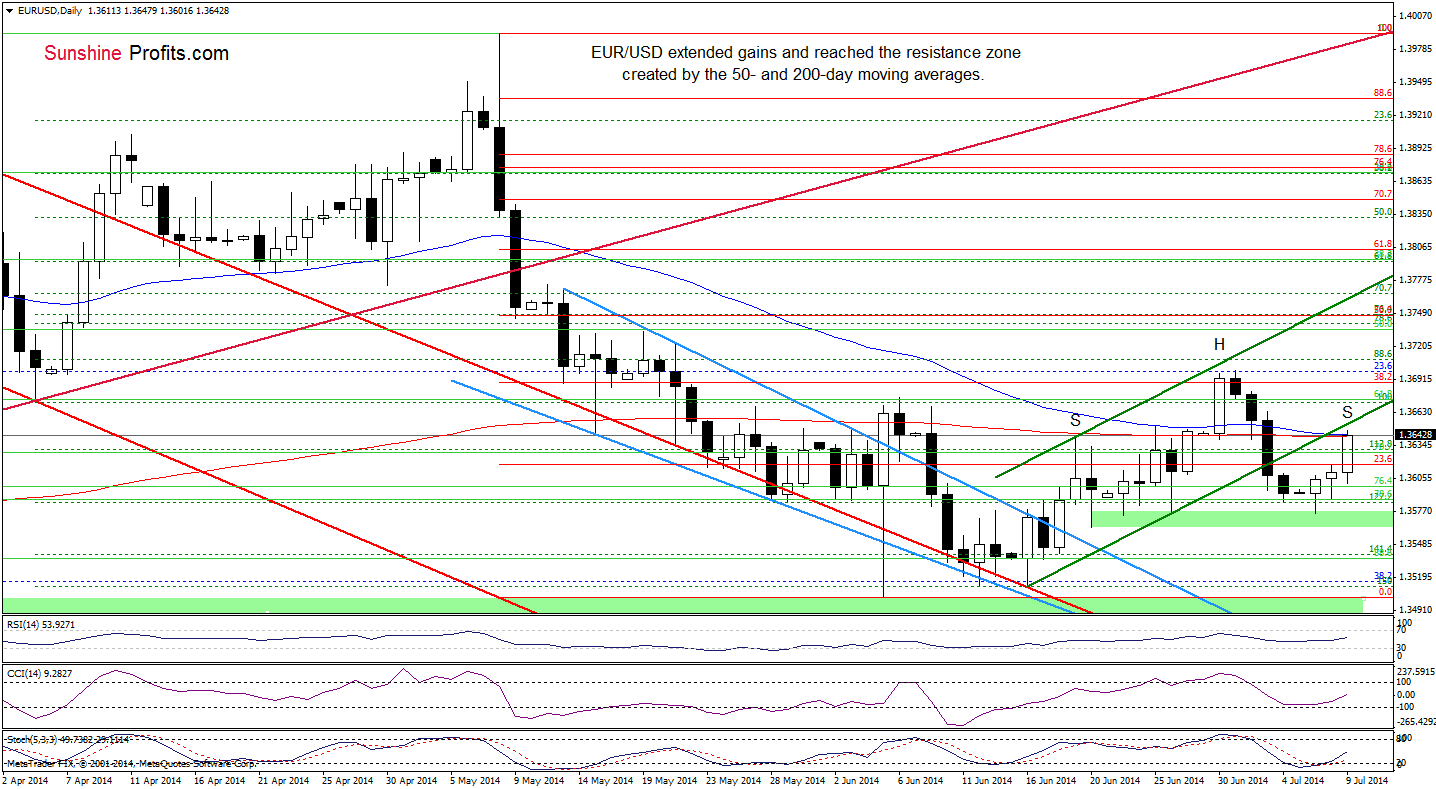
The first thing that catches the eye on the daily chart is a potential head and shoulders reversal formation. Although it’s not complete at the moment, we think that the pair is currently building the right shoulder of this pattern. If this is the case and EUR/USD declines from here, we’ll see a correction to the neck line based on the June 26 and July 7 lows (but further deterioration will be even more likely if the pair drops below the green support zone). If this area is broken, the exchange rate will test the strength of the June lows, where the size of a downswing will correspond to the height of the formation (this scenario is currently reinforced by the strong resistance zone created by the 50- and 200-day moving averages).
Nevertheless, we should keep in mind that buy signals remain in place, which suggests that currency bulls may test the strength of the previously-broken lower border of the rising trend channel. If it holds, we’ll see a realization of the above-mentioned scenario, however, if this resistance is broken, we’ll see further improvement and the initial upside target will be the 38.2% Fibonacci retracement (around 1.3688). In this case, the bearish formation and the breakdown will be invalidated (a very strong bullish signal), which will likely trigger an increase to the next Fibonacci retracement.
Very short-term outlook: mixed
Short-term outlook: mixed with bearish bias
MT outlook: bearish
LT outlook: bearish
Trading position (short-term; our opinion): In our opinion no positions are justified from the risk/reward perspective. We will keep you informed should anything change, or should we see a confirmation/invalidation of the above.
USD/CHF
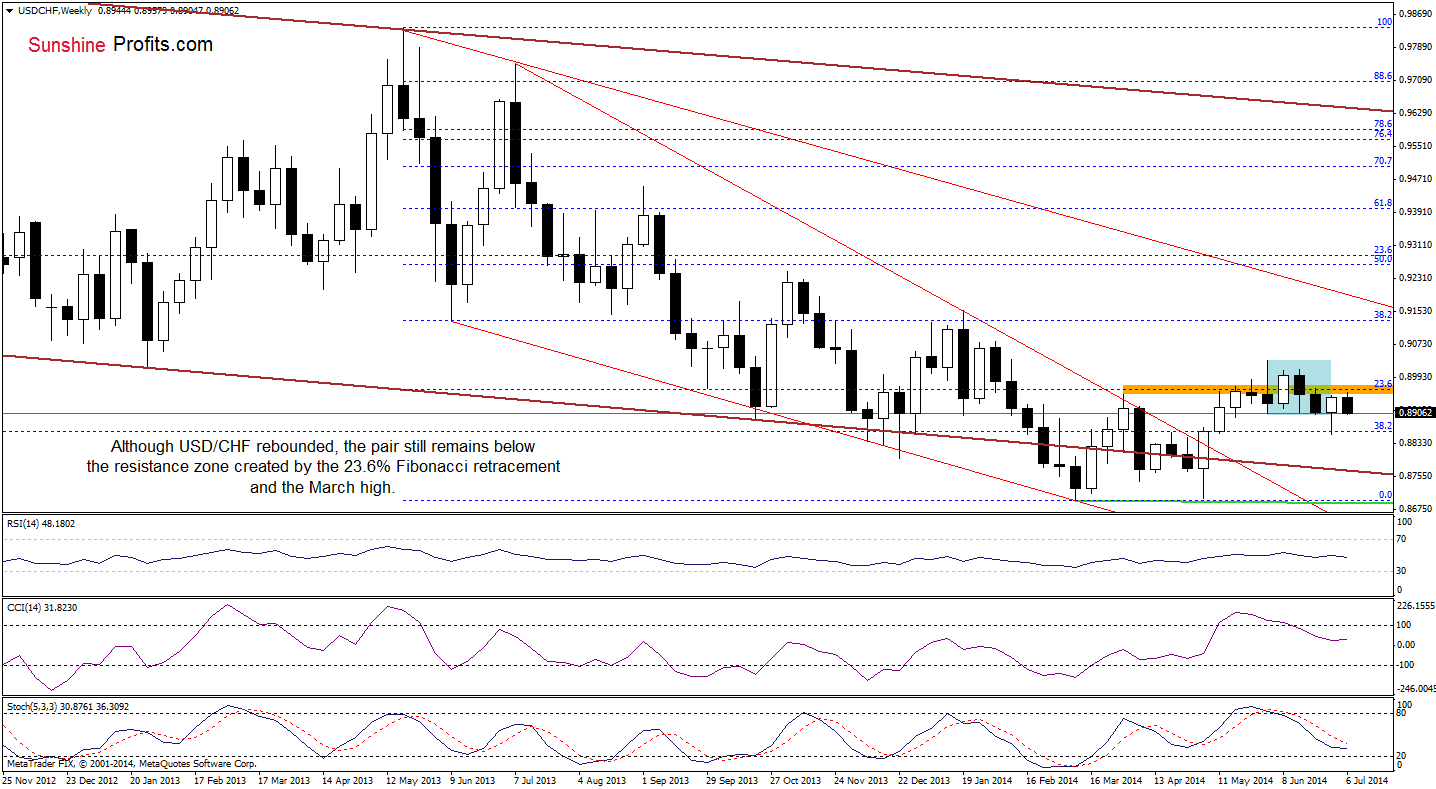
From this perspective, we see that although USD/CHF rebounded in the previous week, the resistance zone created by the March high and the 23.6% Fibonacci retracement stopped further improvement, triggering another downswing. Taking this fact into account and combining it with sell signals generated by the CCI and Stochastic Oscillator, we think that the pair will test last’s week low in the nearest future.
Will the short-term picture confirm this bearish scenario?
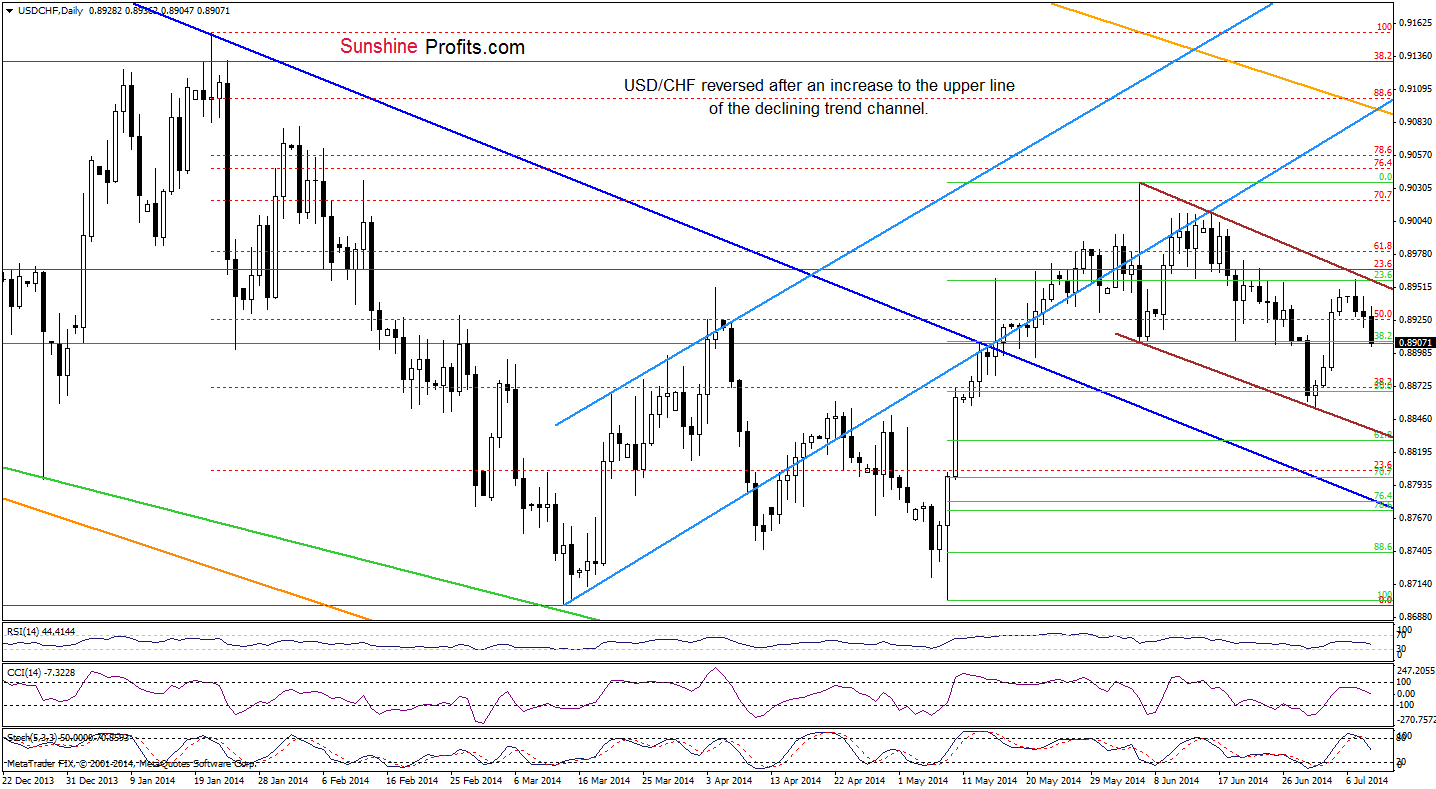
Looking at the above chart, we see that USD/CHF bounced off the 50% Fibonacci retracement level, which triggered a corrective upswing that took the exchange rate to the higher brown line, which is also the upper border of the declining trend channel. As you see on the daily chart, this resistance encouraged forex traders to push the sell button and resulted in a pullback. Additionally, the RSI and CCI moved lower, while the Stochastic Oscillator generated sell signal, which suggest that we’ll see further deterioration and a correction to the recent lows (or even to the lower border of the trend channel, if the nearest support area is broken).
Very short-term outlook: bearish
Short-term outlook: mixed with bearish bias
MT outlook: mixed with bullish bias
LT outlook: bearish
Trading position (short-term): In our opinion no positions are justified from the risk/reward perspective. We will keep you informed should anything change, or should we see a confirmation/invalidation of the above.
AUD/USD
Today, we’ll focus on the daily chart.
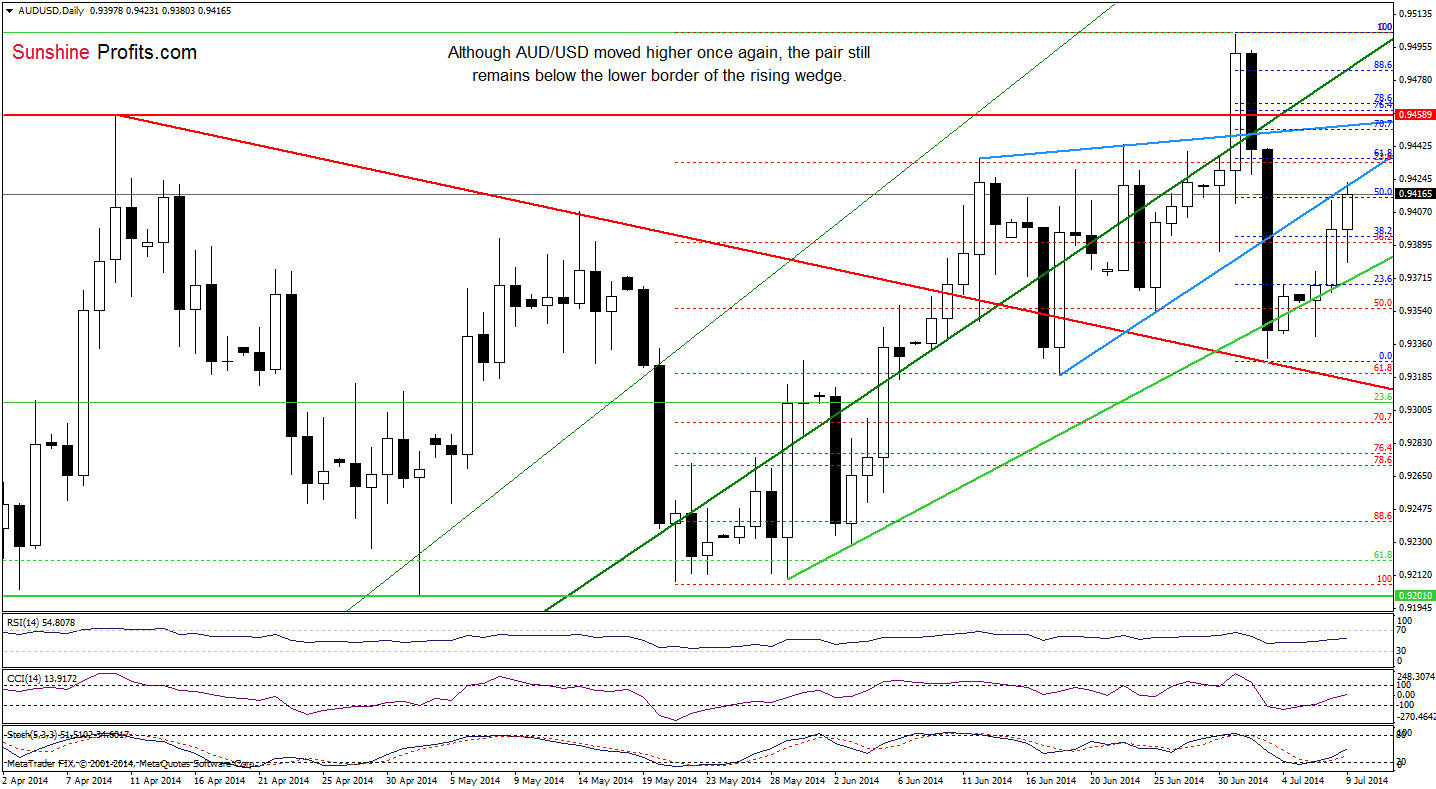
Earlier today, AUD/USD rebounded and reached the previously-broken lower border of the rising wedge. Despite this improvement, the resistance line in combination with the 50% Fibonacci retracement still holds, therefore, our last commentary on this currency pair is still up-to-date:
(…) If this resistance area holds, we’ll see further deterioration and a comeback to the green support line. However, taking into account the current position of the indicators, it seems to us that we’ll see another attempt to move higher. If this is the case and the pair breaks above the lower blue line, the next upside target will be around 0.9452, where the upper line of the formation intersects with the 70.7% Fibonacci retracement (based on the recent decline).
Very short-term outlook: mixed
Short-term outlook: mixed
MT outlook: bearish
LT outlook: bearish
Trading position (short-term): In our opinion, no positions are justified from the risk/reward perspective. We will keep you informed should anything change, or should we see a confirmation/invalidation of the above.
Thank you.
Nadia Simmons
Forex & Oil Trading Strategist
Przemyslaw Radomski, CFA
Founder, Editor-in-chief
Gold & Silver Trading Alerts
Forex Trading Alerts
Oil Investment Updates
Oil Trading Alerts

