
Earlier today, the Canadian dollar touched session highs against its U.S. counterpart after data showed that Canadian building permits rose 13.8% in May, well above expectations for a 3.1% increase. What impact did these better-than-expected numbers have on USD/CAD? Did they change the pair’s short-term outlook?
In our opinion the following forex trading positions are justified - summary:
EUR/USD
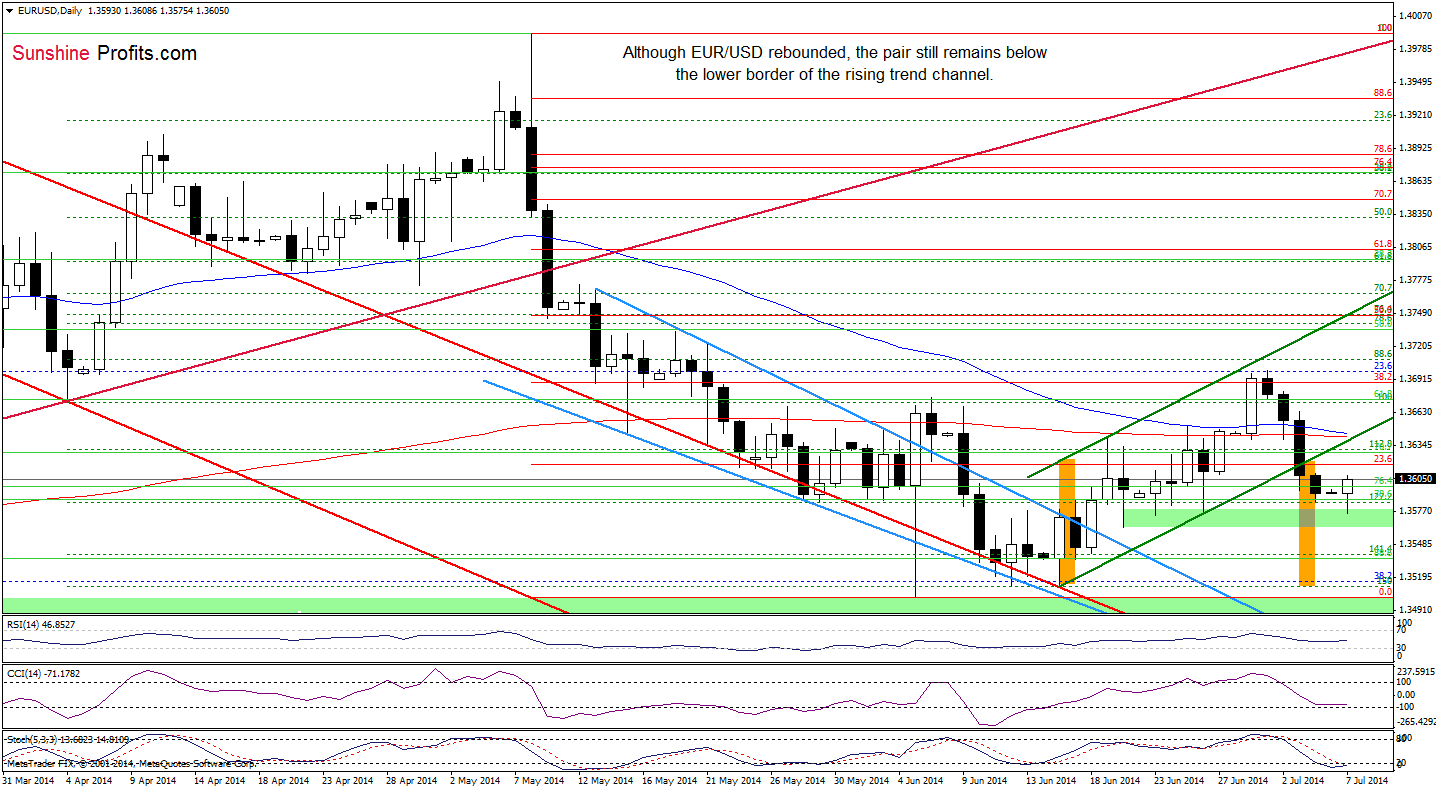
The situation in the medium term hasn’t changed much as EUR/USD still remains in the consolidation below the long-term resistance line. Today, we’ll take a closer look at the very short-term changes.
In our Forex Trading Alert posted on July 2, we wrote the following:
(…) taking into account the current position of the indicators and combining it with the medium-term picture, it seems to us that we’ll see further deterioration in the coming days. If this is the case, the next downside target will be around 1.3564-1.3575, where the bottom of the previous correction is.
Earlier today, currency bears realized the above-mentioned scenario as EUR/USD hit an intraday low of 1.3575. As you see on the above chart, the support area encouraged forex traders to push the buy button, which resulted in a corrective upswing that took the exchange rate to around Friday’s high. Despite this small improvement, the pair still remains below the previously-broken lower border of the rising trend channel. Please note that although the CCI and Stochastic Oscillator are oversold, we think that we’ll see another bigger upswing only if EUR/USD invalidates earlier breakdown below this resistance. Therefore, as long as the exchange rate is trading under this line, another test of the strength of the support zone can’t be ruled out.
Very short-term outlook: bearish
Short-term outlook: mixed with bearish bias
MT outlook: bearish
LT outlook: bearish
Trading position (short-term; our opinion): In our opinion no positions are justified from the risk/reward perspective. We will keep you informed should anything change, or should we see a confirmation/invalidation of the above.
USD/CAD
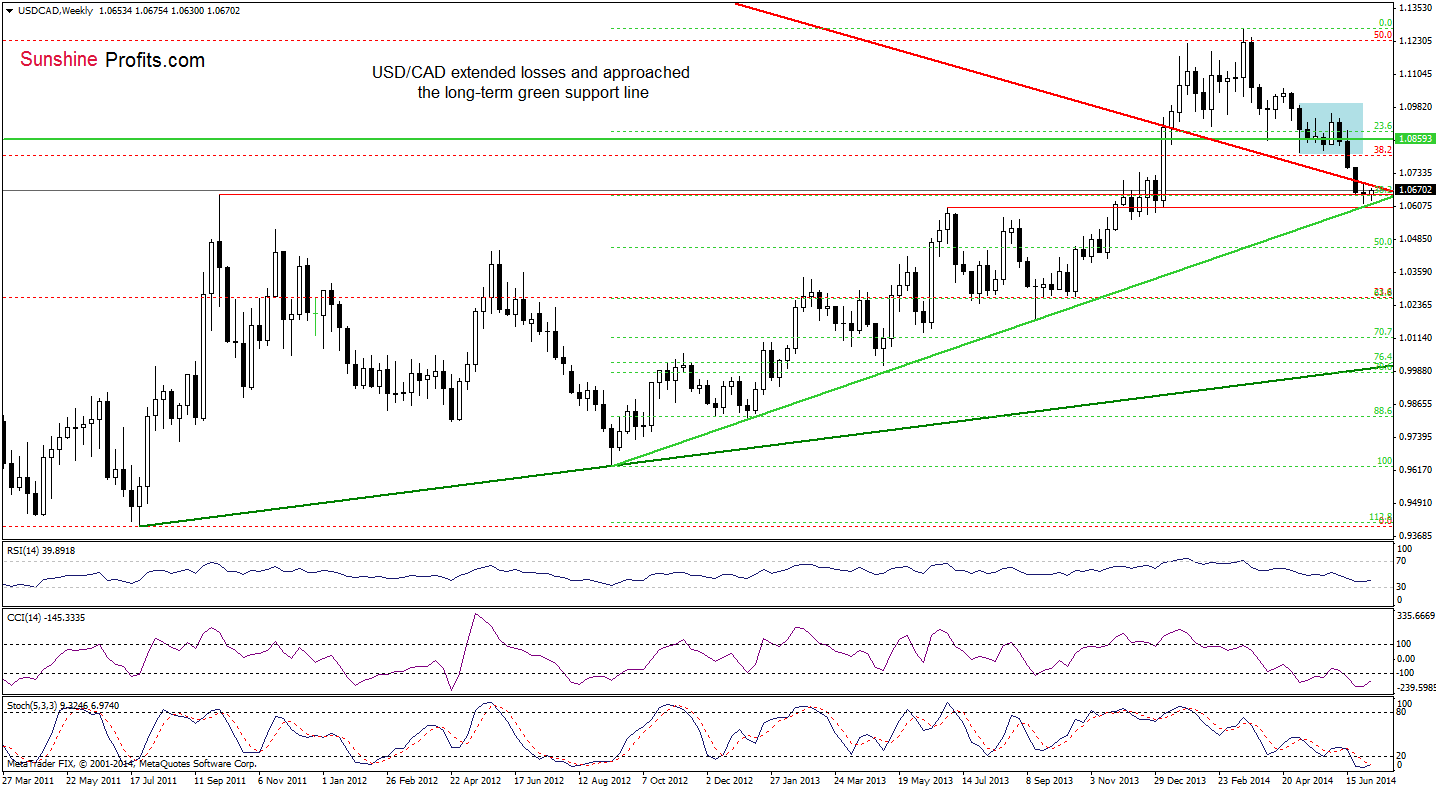
Quoting our Forex Trading Alert posted on June 27:
(…) USD/CAD broke below the long-term declining line, which triggered a sharp pullback that took the pair to slightly above its downside target. Taking into account the current position of the indicators (sell signals are still in play), it seems to us that the exchange rate will reach the 38.2% Fibonacci retracement in the nearest future. (…) if it’s broken the next downside target will be around 1.0597, where the support line based on the June 2013 high intersects with the long-term green support line (please note that this area is also supported by December lows).
Looking at the above chart, we see that the situation developed in line with our assumption and USD/CAD almost touched its downside target. Taking into account the above-mentioned strong support zone and combining it with the current position of the indicators, it seems to us that currency bulls will try to push the exchange higher in the coming week (or weeks). Nevertheless, as long as the pair remains under the red declining resistance line, another sizable move is not likely to be seen. Therefore, we think that it’s worth to wait for an invalidation of the breakdown below this important line before we consider opening long positions.
Having discussed the above, let’s move on to the daily chart.
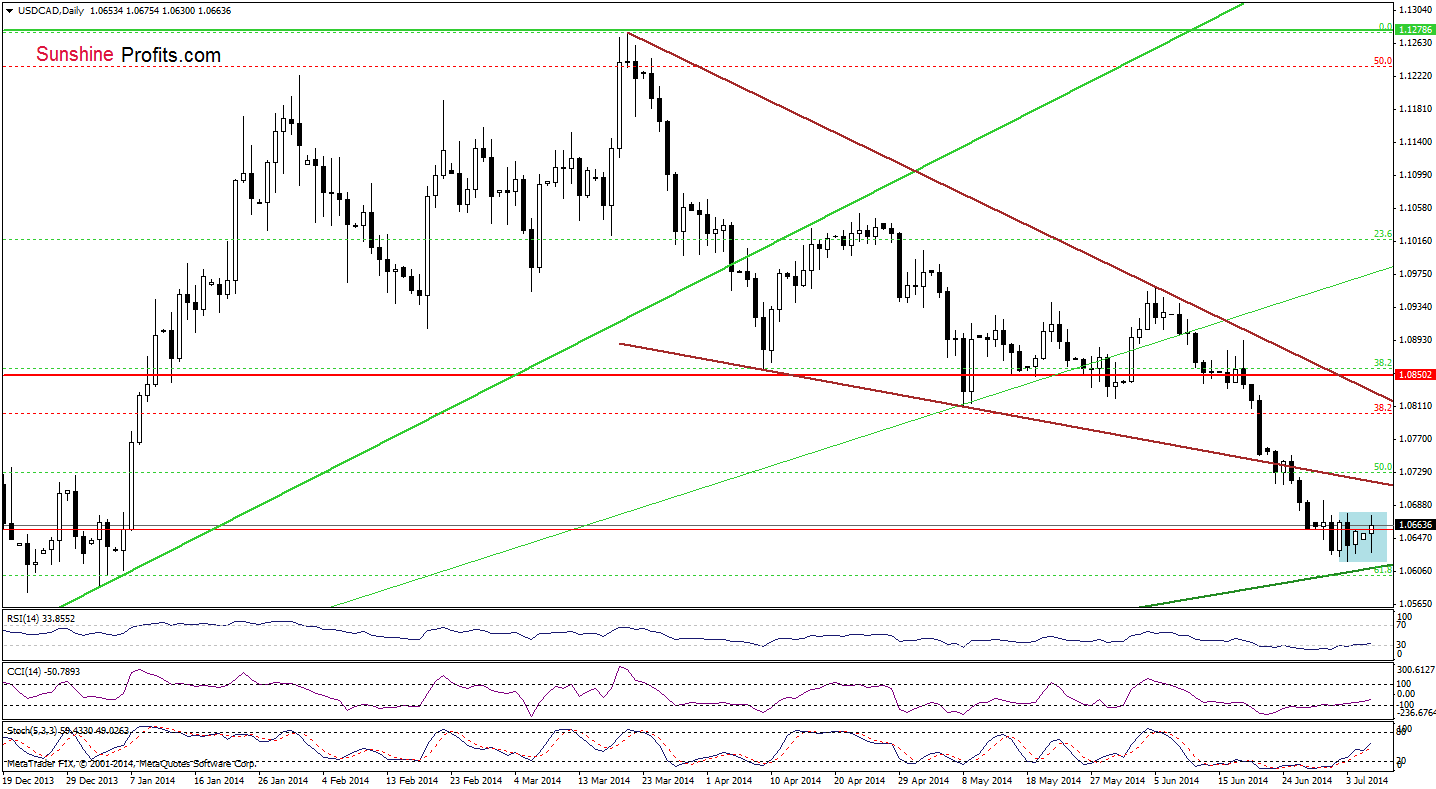
In our last commentary on this currency pair, we wrote the following:
(…) the exchange rate reached its downside target, declining to 1.0710 (…) if this area is broken, the next downside target will be around 1.0600, where the 61.8% Fibonacci retracement (based on the Sept.-March rally) is.
From this perspective, we see that the exchange rate approached its downside target in the previous week and since then USD/CAD has been trading in a consolidation slightly above the support zone created by long-term green support line and the 61.8% Fibonacci retracement. Taking this fact into account, we should consider two scenarios. On one hand, if currency bulls do not give up and push the pair above the July 3 high of 1.0678, we’ll likely see further improvement and an increase to the previously-broken lower border of the declining wedge. However, if the pair drops below Thursday low, we’ll see a test of the strength of the support zone. Please note that the position of the indicators supports the bullish scenario at the moment as buy signals remain in place.
Very short-term outlook: mixed with bullish bias
Short-term outlook: bearish
MT outlook: mixed
LT outlook: bearish
Trading position (short-term): In our opinion no positions are justified from the risk/reward perspective as the space for further declines may be limited. We will keep you informed should anything change, or should we see a confirmation/invalidation of the above.
AUD/USD
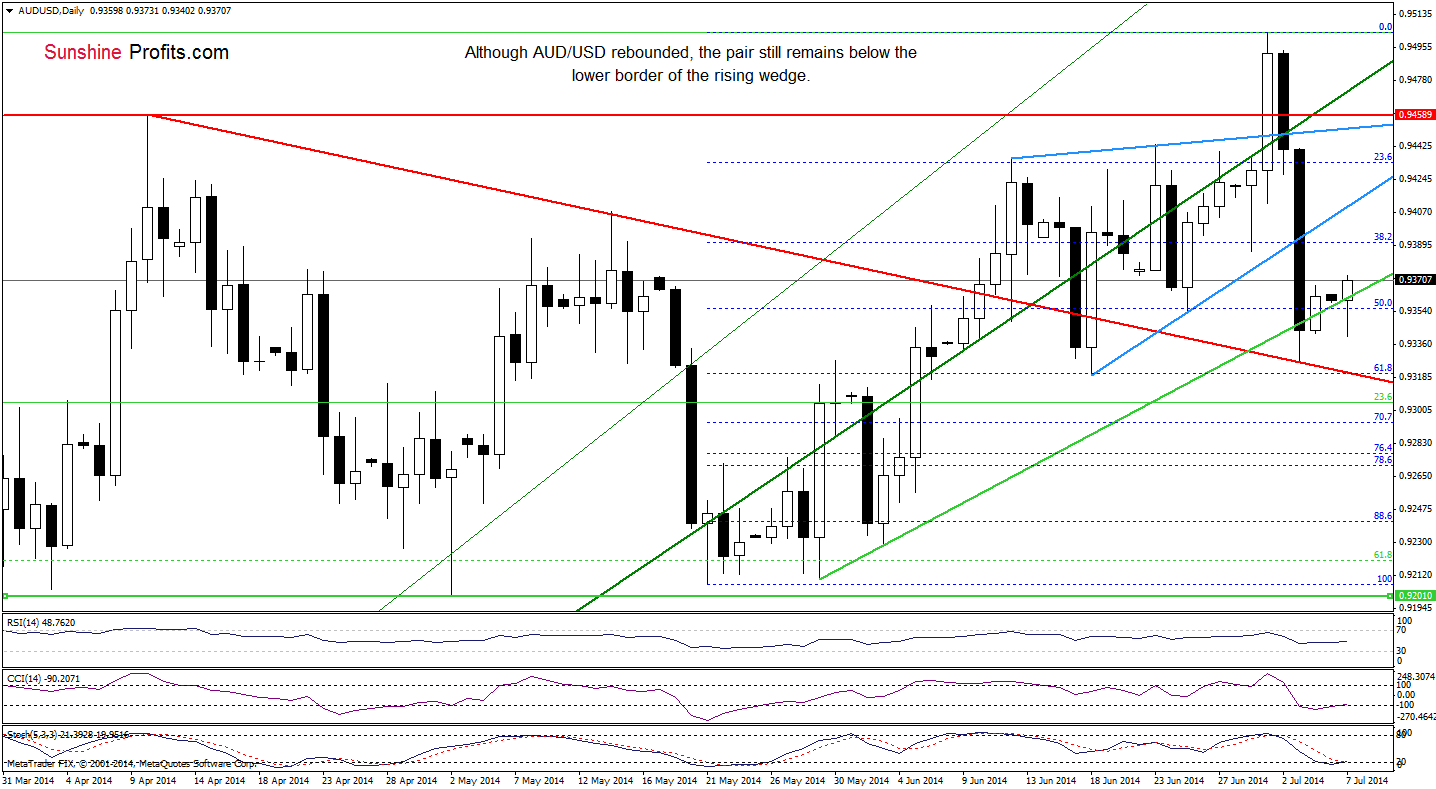
Today, let’s take a closer look at the daily chart.
Quoting our previous Forex Trading Alert:
(…) AUD/USD declined below the lower border of the rising wedge, reaching the 50% Fibonacci retracement (based on the May-July rally) and approaching the short-term support line based on the May and June lows. If this support area (…) is broken, the next downside target will be around 0.9321-0.9327, where the support zone (created by the red declining support line and the 61.8% Fibonacci retracement) is. Please note, that the current position of the indicators still supports the bearish scenario.
As you see on the above chart, AUD/USD extended declines in tune with our last commentary and reached the red declining line. From this perspective, we see that this support triggered a corrective upswing, which resulted in a comeback above the previously-broken green support line. Although this is a bullish signal, we think that the size of the upswing is too small to say that the very short-term situation has improved. In our opinion, as long as the pair remains below 0.9391 (where the 38.2% Fibonacci retracement based on the recent decline is) and the CCI and Stochastic Oscillator do not generate buy signals, another attempt to move lower can’t be ruled out.
Very short-term outlook: mixed
Short-term outlook: mixed with bearish bias
MT outlook: bearish
LT outlook: bearish
Trading position (short-term): In our opinion, no positions are justified from the risk/reward perspective. We will keep you informed should anything change, or should we see a confirmation/invalidation of the above.
Thank you.
Nadia Simmons
Forex & Oil Trading Strategist
Przemyslaw Radomski, CFA
Founder, Editor-in-chief
Gold & Silver Trading Alerts
Forex Trading Alerts
Oil Investment Updates
Oil Trading Alerts

