
The common currency moved lower against the U.S. dollar after the ADP nonfarm payrolls report showed that the U.S private sector added 281,000 jobs last month, beating expectations for an increase of 200,000. As a result, EUR/USD invalidated yesterday’s breakout and declined to its initial downside target. Will we see further deterioration?
In our opinion the following forex trading positions are justified - summary:
EUR/USD
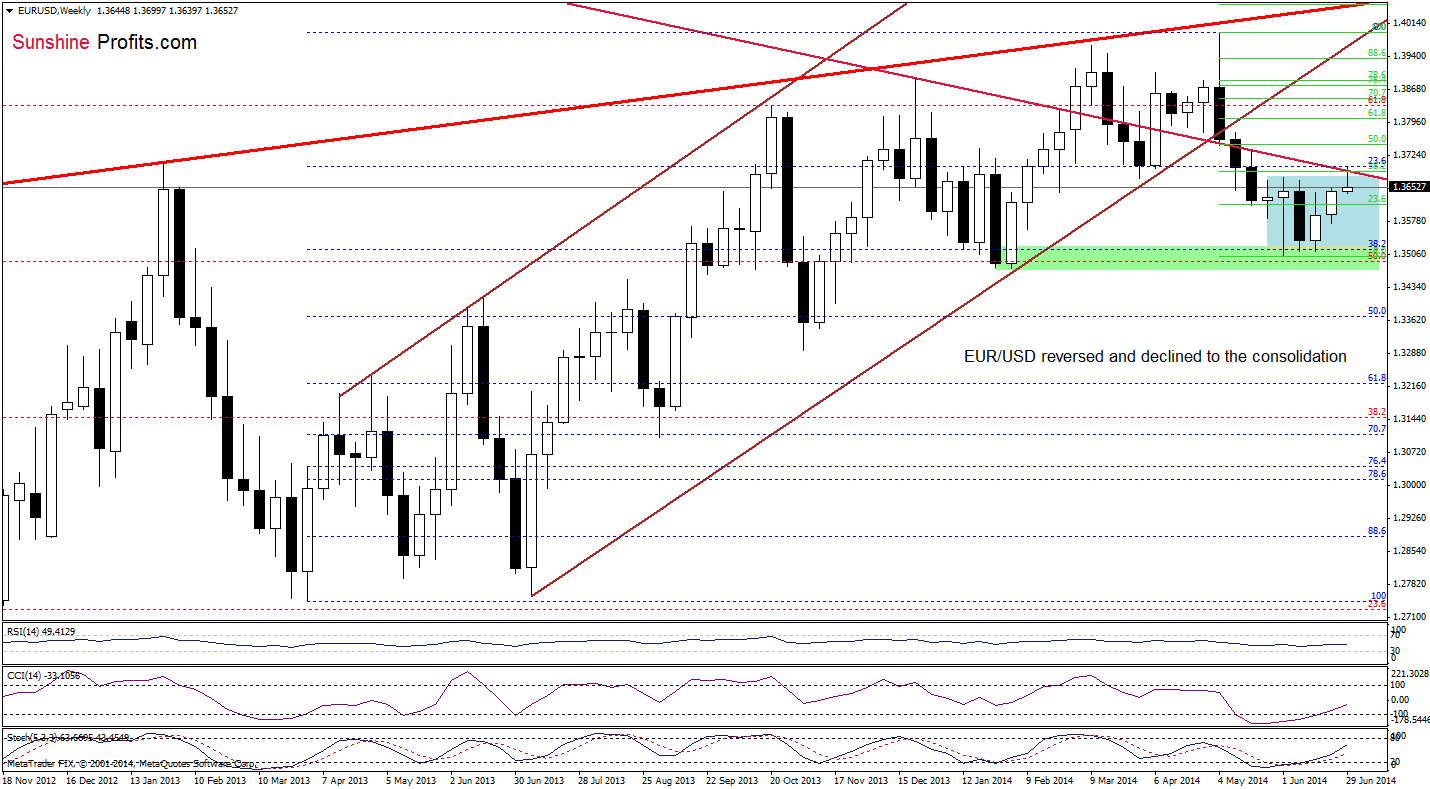
The situation in the medium term has deteriorated slightly as EUR/USD dropped below the previously-broken upper line of the consolidation, moving away from the long-term resistance line. Although this is a bearish signal, the current position of the indicators still supports the bullish case.
Will the very short-term chart give us any clearer clues about future moves?
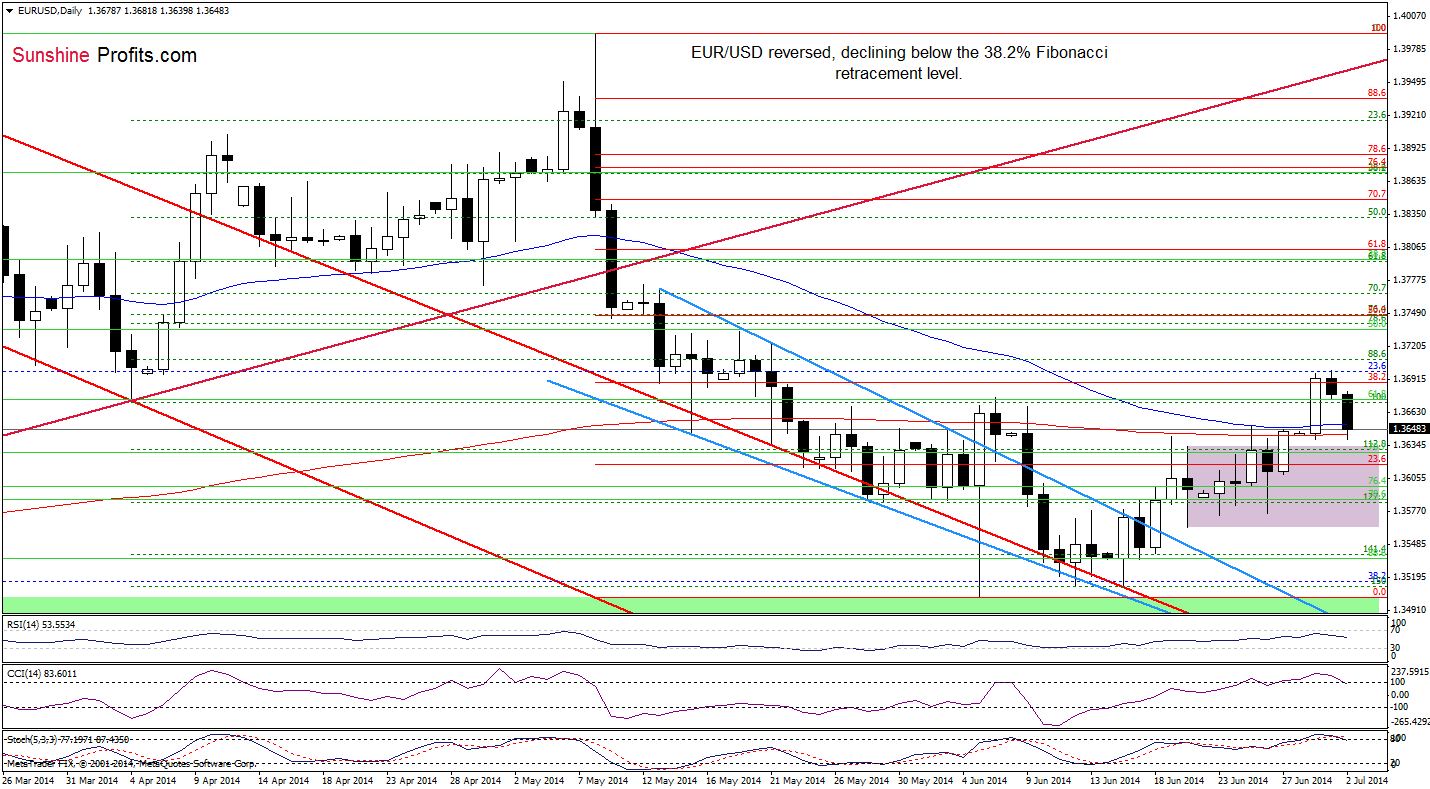
Quoting our last commentary:
(…) if (…) the 38.2% Fibonacci retracement holds, we’ll see a pullback to the previously-broken moving averages (around 1.3643-1.3651).
Looking at the above chart, we see that the situation developed in tune with our yesterday’s assumption and EUR/USD reached its downside target. If the support zone created by the 50- and 200-day moving averages withstand the selling pressure, we’ll see a rebound to around to the 38.2% Fibonacci retracement. However, taking into account the current position of the indicators and combining it with the medium-term picture, it seems to us that we’ll see further deterioration in the coming days. If this is the case, the next downside target will be around 1.3564-1.3575, where the bottom of the previous correction is.
Very short-term outlook: mixed with bearish bias
Short-term outlook: mixed
MT outlook: bearish
LT outlook: bearish
Trading position (short-term; our opinion): In our opinion no positions are justified from the risk/reward perspective. We will keep you informed should anything change, or should we see a confirmation/invalidation of the above.
USD/JPY
The situation in the medium term hasn’t changed much as USD/JPY remains between the medium-term support/resistance and the May low of 100.81. Today, we’ll take a closer look at the very short-term picture.
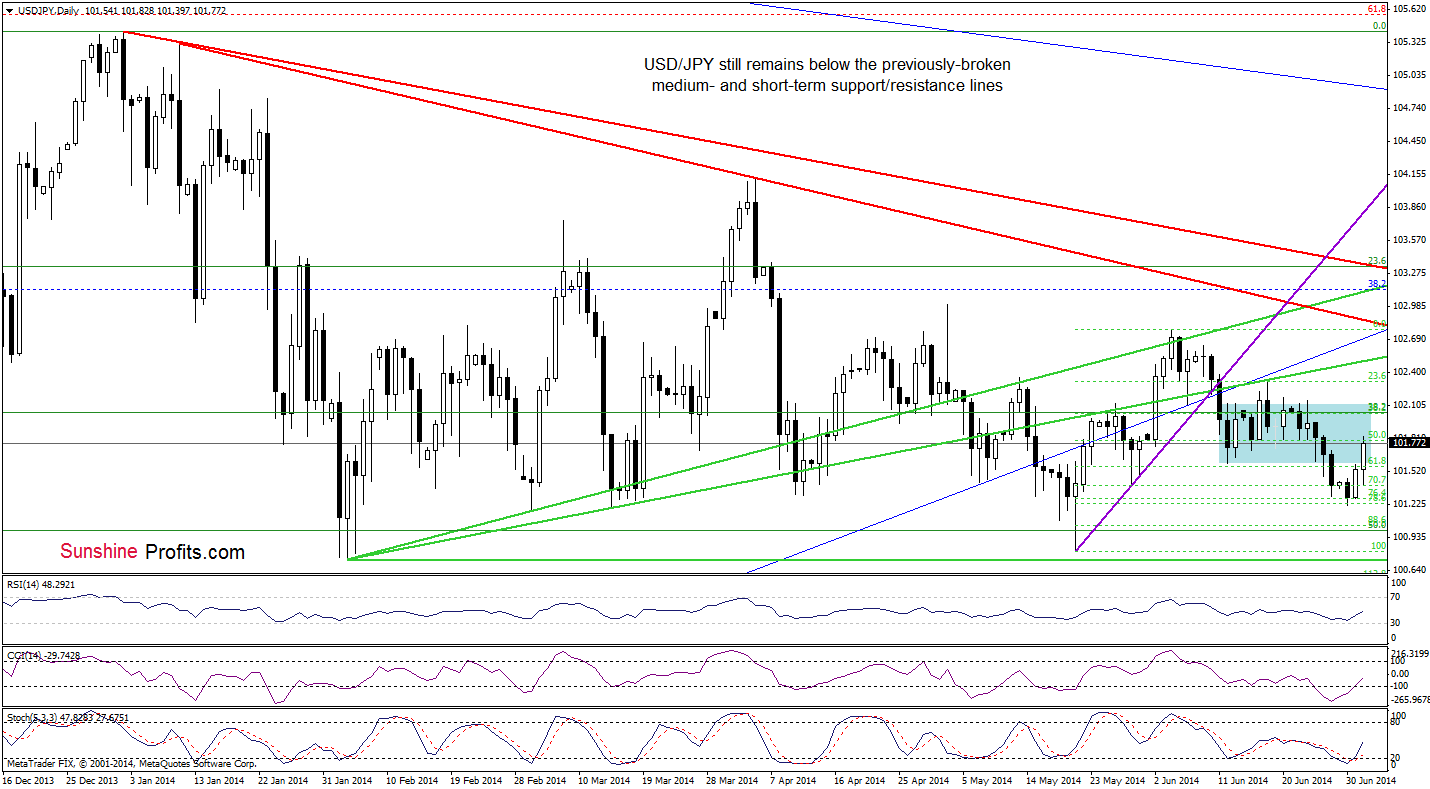
From this perspective, we see that currency bulls pushed USD/JPY higher and the pair broke above the lower border of the consolidation, therefore, our last commentary is up-to-date:
(…) the RSI rebounded, while the CCI and Stochastic Oscillator generated buy signals, which suggests that we will also see a breakout above the lower border of the consolidation. If this is the case, the next upside target will be around 102.12, where the upper line of the formation is.
Very short-term outlook: mixed with bullish bias
Short-term outlook: mixed
MT outlook: mixed
LT outlook: bearish
Trading position (short-term): In our opinion no positions are justified from the risk/reward perspective at the moment. We will keep you informed should anything change, or should we see a confirmation/invalidation of the above.
AUD/USD
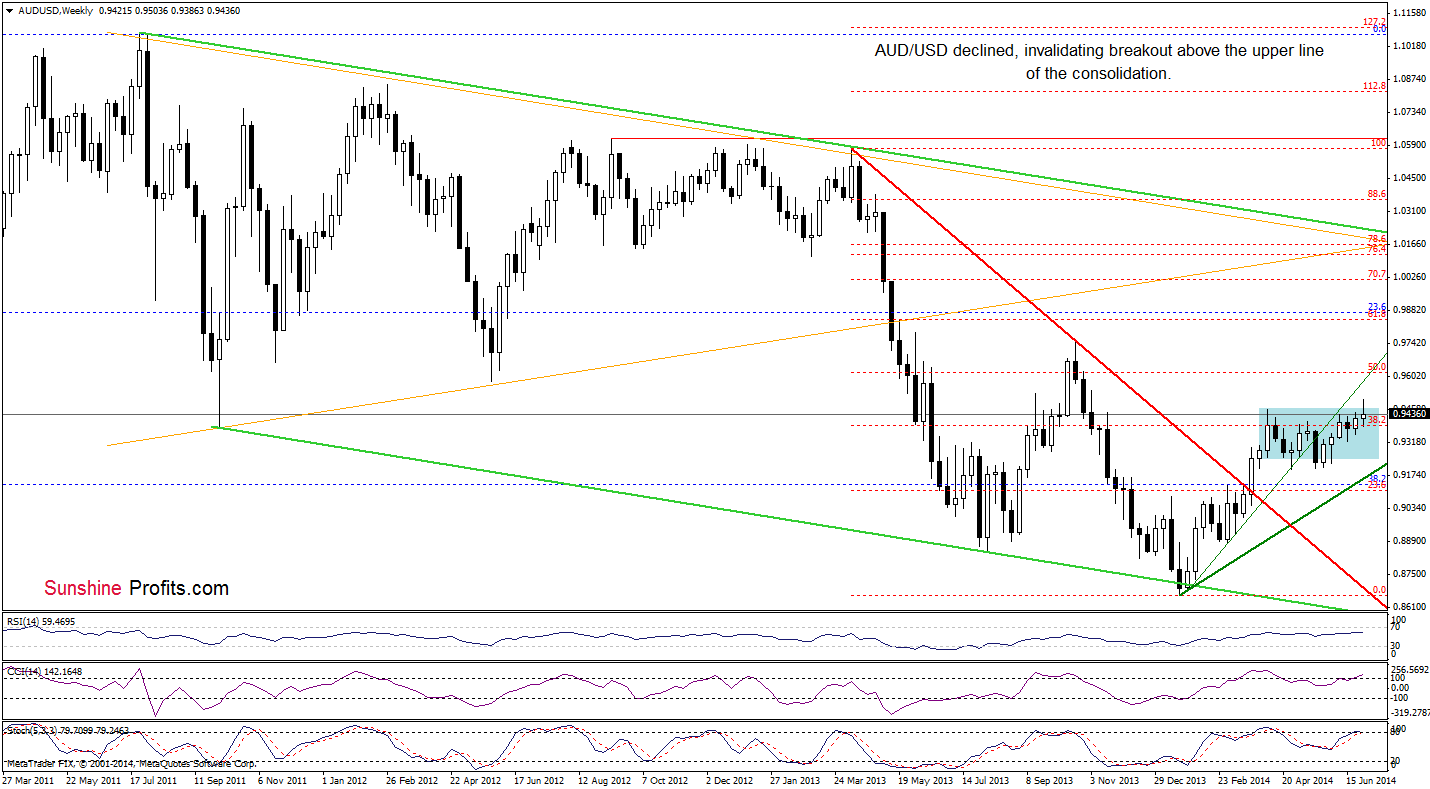
The situation in the medium term has deteriorated as the exchange rate declined and came back to the consolidation below the medium-term green resistance, invalidating the breakout.
How did this move affected the very short-term picture?
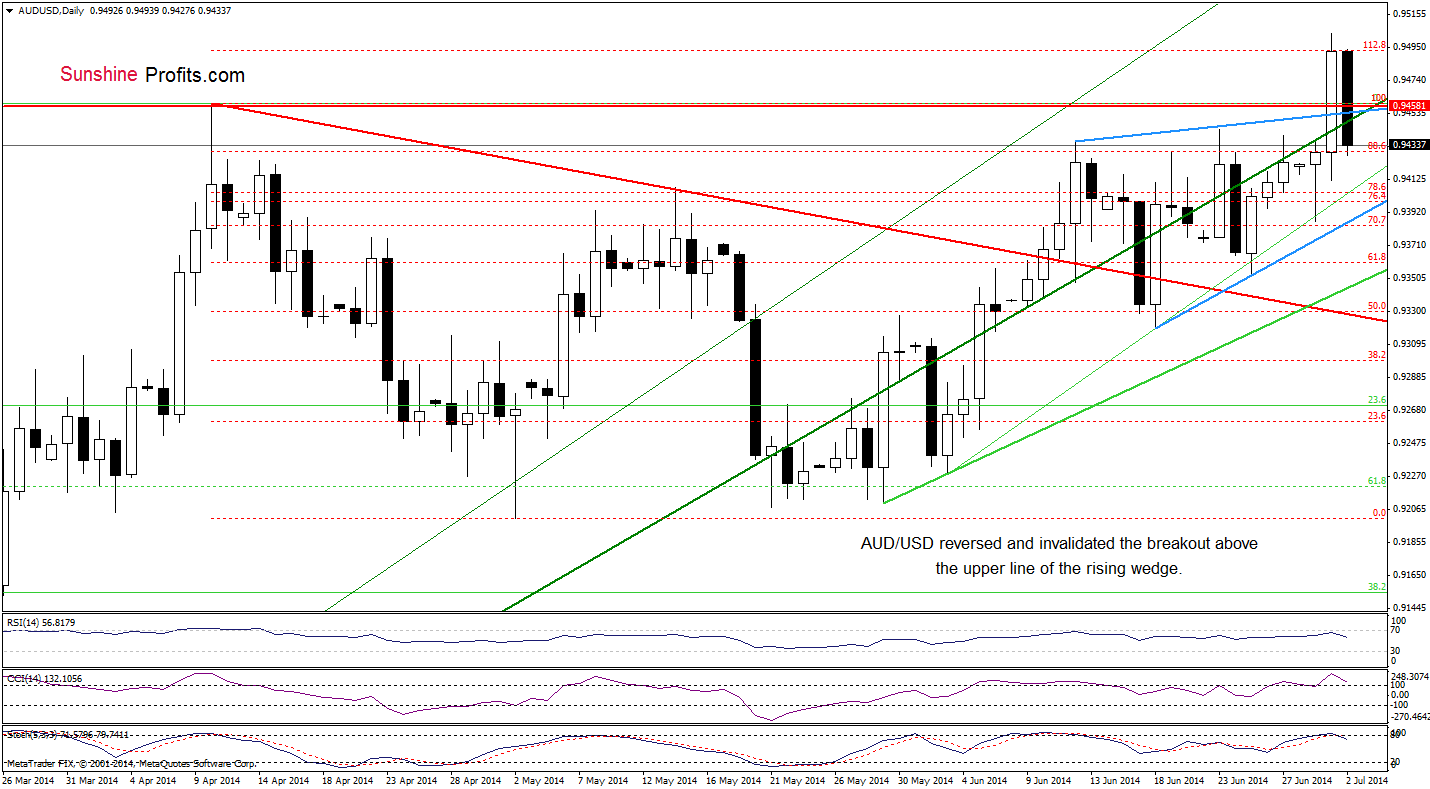
Looking at the above chart, we see that although AUD/USD extended gains and broke above the strong resistance zone (created by the previous 2014 high and the upper line of the rising wedge), the pair reversed, invalidating earlier breakout (a strong negative sign). With this downward move, the exchange rate also dropped below the medium-term green support line, which is an additional bearish signal. On top of that, the Stochastic Oscillator generated a sell signal, while the CCI is close to doing it, which suggests that further deterioration is more likely than not. If this is the case, and the pair extends losses, the initial downside target will be the short-term green line or even the lower border of the rising wedge.
Very short-term outlook: bearish
Short-term outlook: mixed with bearish bias
MT outlook: bearish
LT outlook: bearish
Trading position (short-term): In our opinion, no positions are justified from the risk/reward perspective. We will keep you informed should anything change, or should we see a confirmation/invalidation of the above.
Thank you.
Nadia Simmons
Forex & Oil Trading Strategist
Przemyslaw Radomski, CFA
Founder, Editor-in-chief
Gold & Silver Trading Alerts
Forex Trading Alerts
Oil Investment Updates
Oil Trading Alerts

