
Earlier today, the greenback moved lower against the common currency after industry data showed that the Chicago purchasing managers’ index declined to 62.6 in June from 65.5 in May, missing expectations for a 63.0 reading. Thanks to these numbers, EUR/USD increased sharply, breaking above its strong resistance zone. Are there any bearish technical factors that could stop today’s rally?
In our opinion the following forex trading positions are justified - summary:
EUR/USD
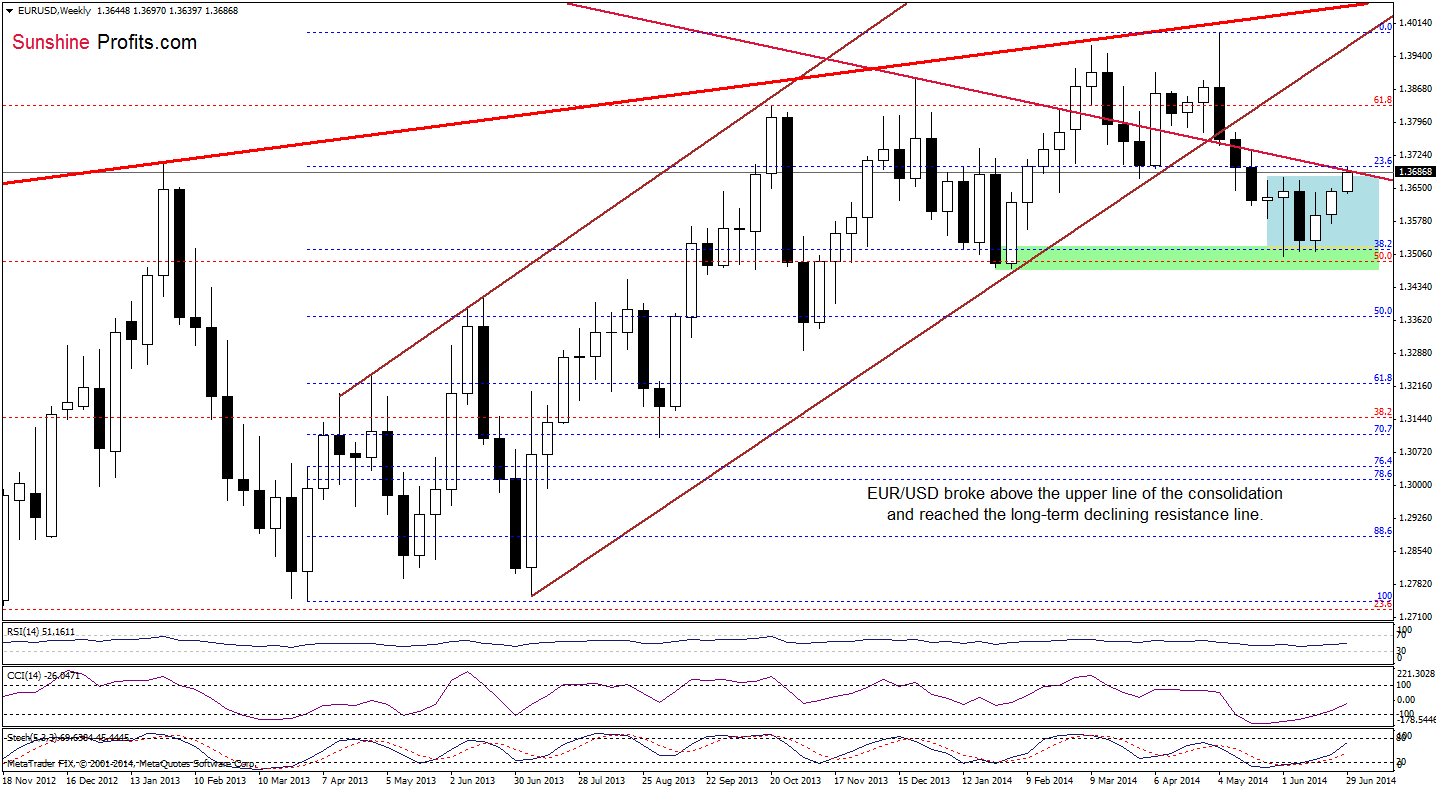
The situation in the medium term has improved as EUR/USD broke above the upper line of the consolidation between the support zone (created by the 38.2% Fibonacci retracement and last week’s low) and the June high. Despite this growth, the exchange rate still remains below the major resistance. If the long-term declining line encourages forex traders to push the sell button, we’ll see a pullback from here and a comeback to the consolidation range. However, if this important line is broken, we’ll see further improvement and an increase to at least 1.3746, where the 50% Fibonacci retracement is (you’ll see this level more clearly on the daily chart below). Please keep in mind that the CCI and Stochastic Oscillator generated buy signals, which supports the bullish case at the moment.
What can we infer from the very short-term chart?
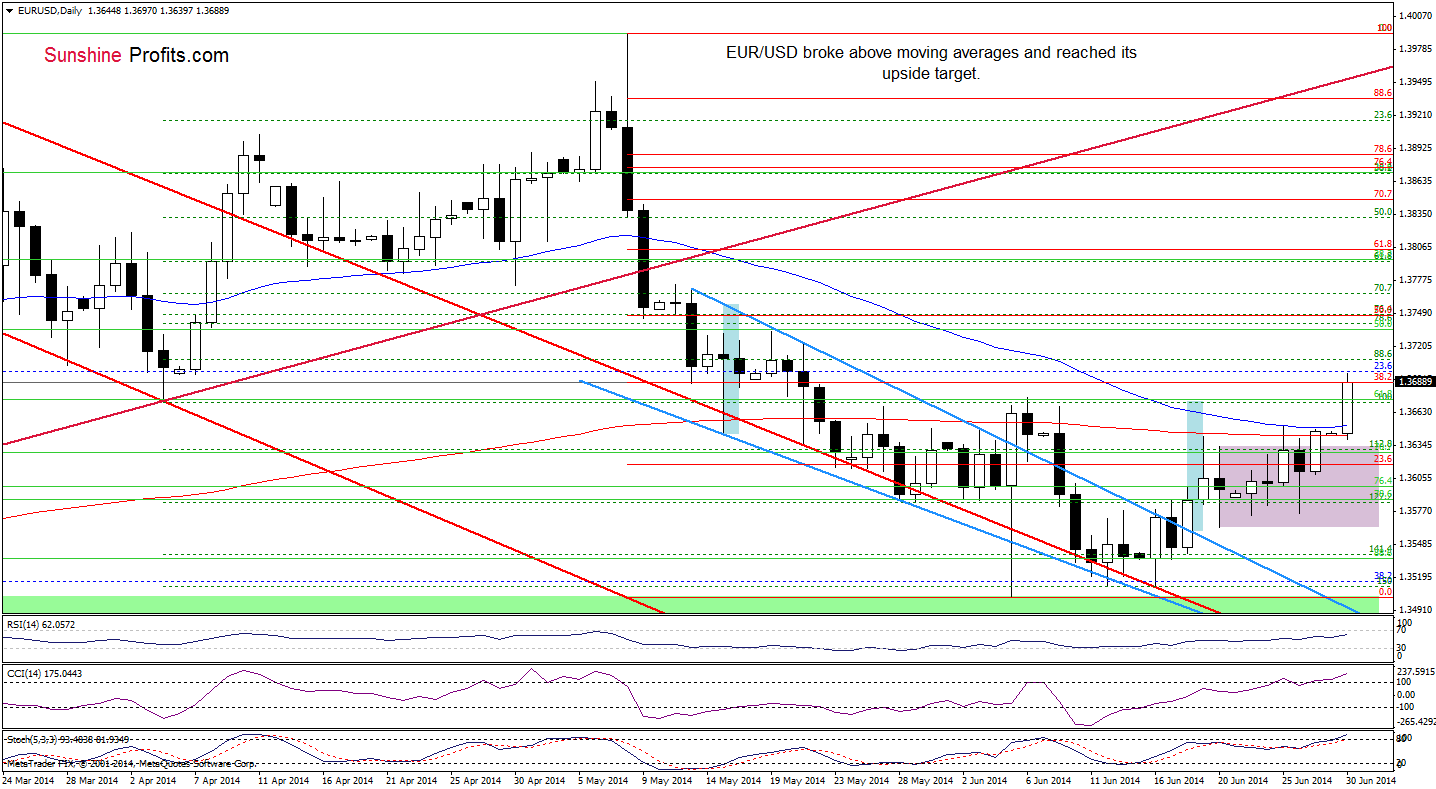
In our Forex Trading Alert posted on June 19, we wrote the following:
(…) if the exchange rate confirms the breakout, we’ll see further improvement and an increase to around 1.3670, where the size of an upswing will correspond to the height of the declining wedge (marked with blue). At this point, it’s worth noting that in this area is a strong resistance zone created by the June 6 and June 9 highs. On top of that, slightly above these levels is also the 38.2% Fibonacci retracement (based on the entire recent decline), which serves as an additional resistance.
On Friday, we added:
(…) the exchange rate still remains below the 200- and 50-day moving averages (…) if this strong resistance zone is broken, we’ll likely see further improvement and an increase to (at least) around 1.3671, where the 38.2% Fibonacci retracement (based on the entire recent decline) is.
Looking at the above chart, we see that the situation has developed in line with our previous assumptions and EUR/USD reached its upside target earlier today. From this perspective, we should consider two scenarios. On one hand, if the resistance level created by the 38.2% Fibonacci retracement holds, we’ll see a pullback to the previously-broken moving averages (around 1.3643-1.3651). On the other hand, if it is broken and we see further rally (which also means a breakout above the long-term declining resistance line), the next upside target will be the 50% Fibonacci retracement (around 1.3746). Please note that the RSI reached its highest level since the beginning of May, while the CCI and Stochastic Oscillator are overbought, which suggests that the space for growth might be limited.
Very short-term outlook: mixed
Short-term outlook: bearish
MT outlook: bearish
LT outlook: bearish
Trading position (short-term; our opinion): In our opinion no positions are justified from the risk/reward perspective. We will keep you informed should anything change, or should we see a confirmation/invalidation of the above.
USD/CHF
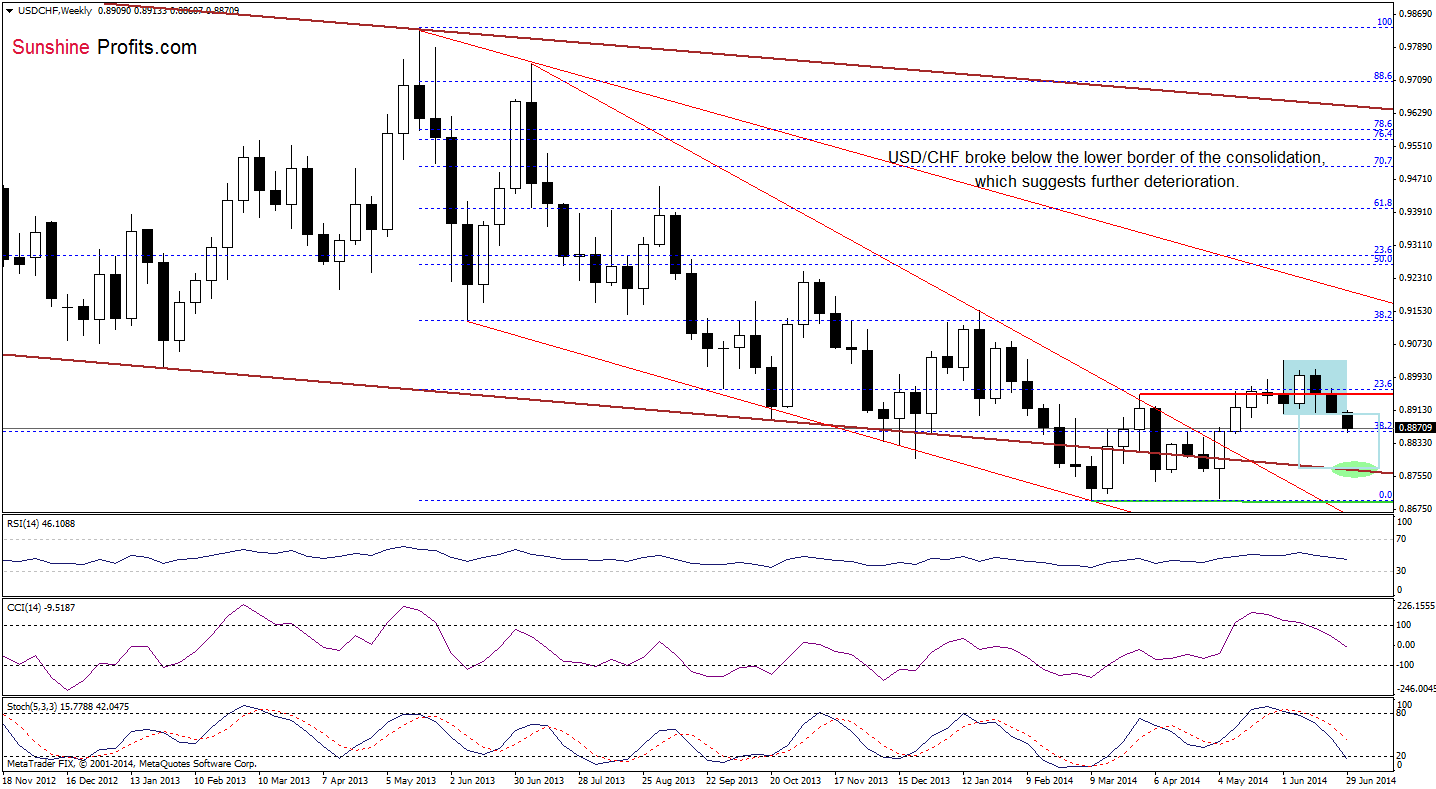
From this prspective, we see that the situation in the medium term has deteriorated as USD/CHF moved lower once again and declined below the lower border of the consolidation. Taking this fact into account, we believe that our last commentary on this currency pair is still valid:
(…) if the pair drops below the lower border of the consolidation, the initial downside targert, will be around 0.8780, where the lower line of the declining trend channel (marked with brown) is.
What can we infer from the short-term picture?
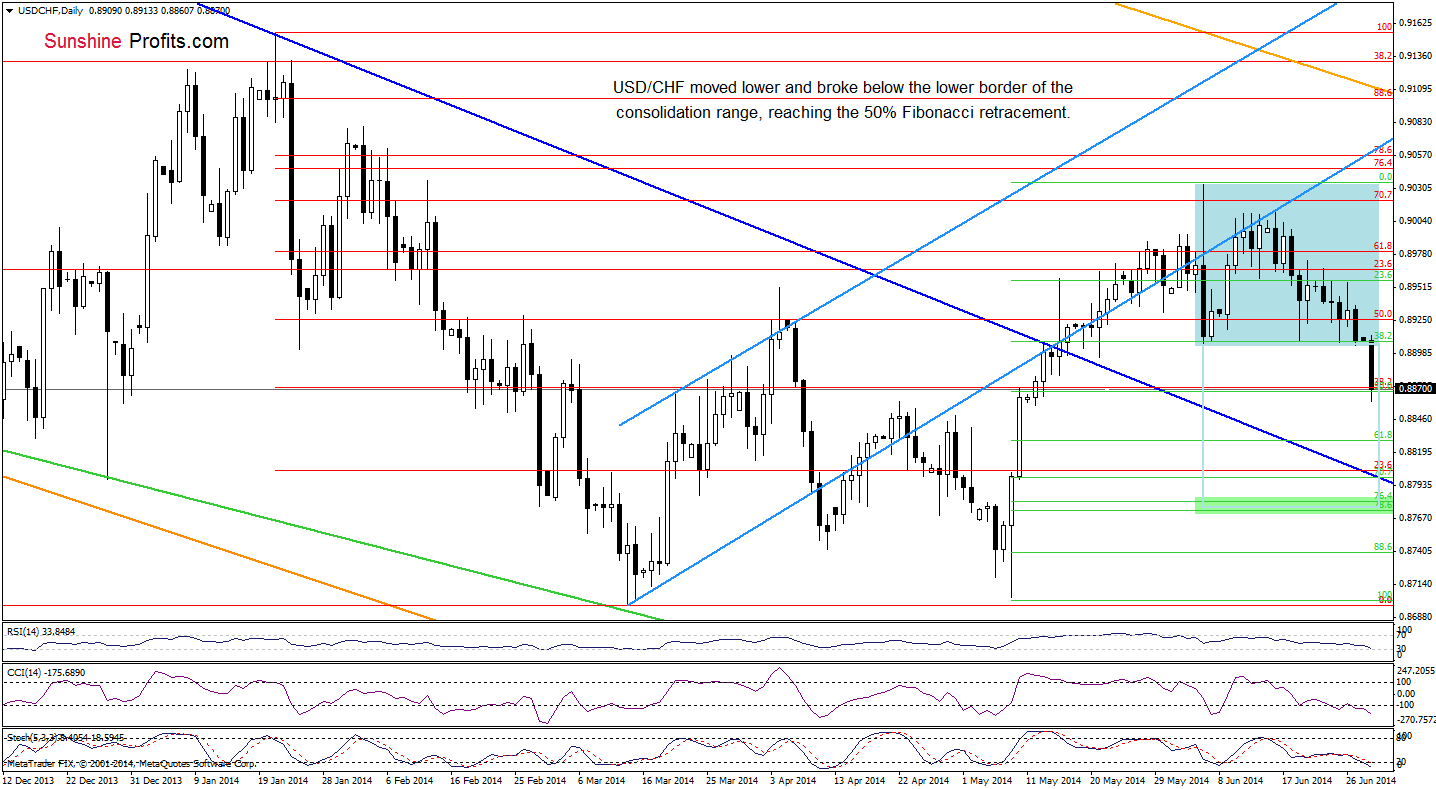
From today’s point of view, we see that the situation has deteriorated significantly as USD/CHF declined below the lower border of the consolidation. As you see on the above chart, this breakdown triggered a sharp decline, which took the exchange rate to the 50% Fibonacci retracement. If this support holds, we may see a rebound. However, taking into account the fact that sell signals remains in place (although the CCI and Stochastic Oscillator are oversold), it seems to us that we’ll see further deterioration and a drop to around 0.8830 (the next Fibonacci retracement) or even to 0.8799, where the blue declining support line meets the 70.7% Fibonacci retracement.
Very short-term outlook: bearish
Short-term outlook: mixed with bearish bias
MT outlook: mixed
LT outlook: bearish
Trading position (short-term): In our opinion no positions are justified from the risk/reward perspective. We will keep you informed should anything change, or should we see a confirmation/invalidation of the above.
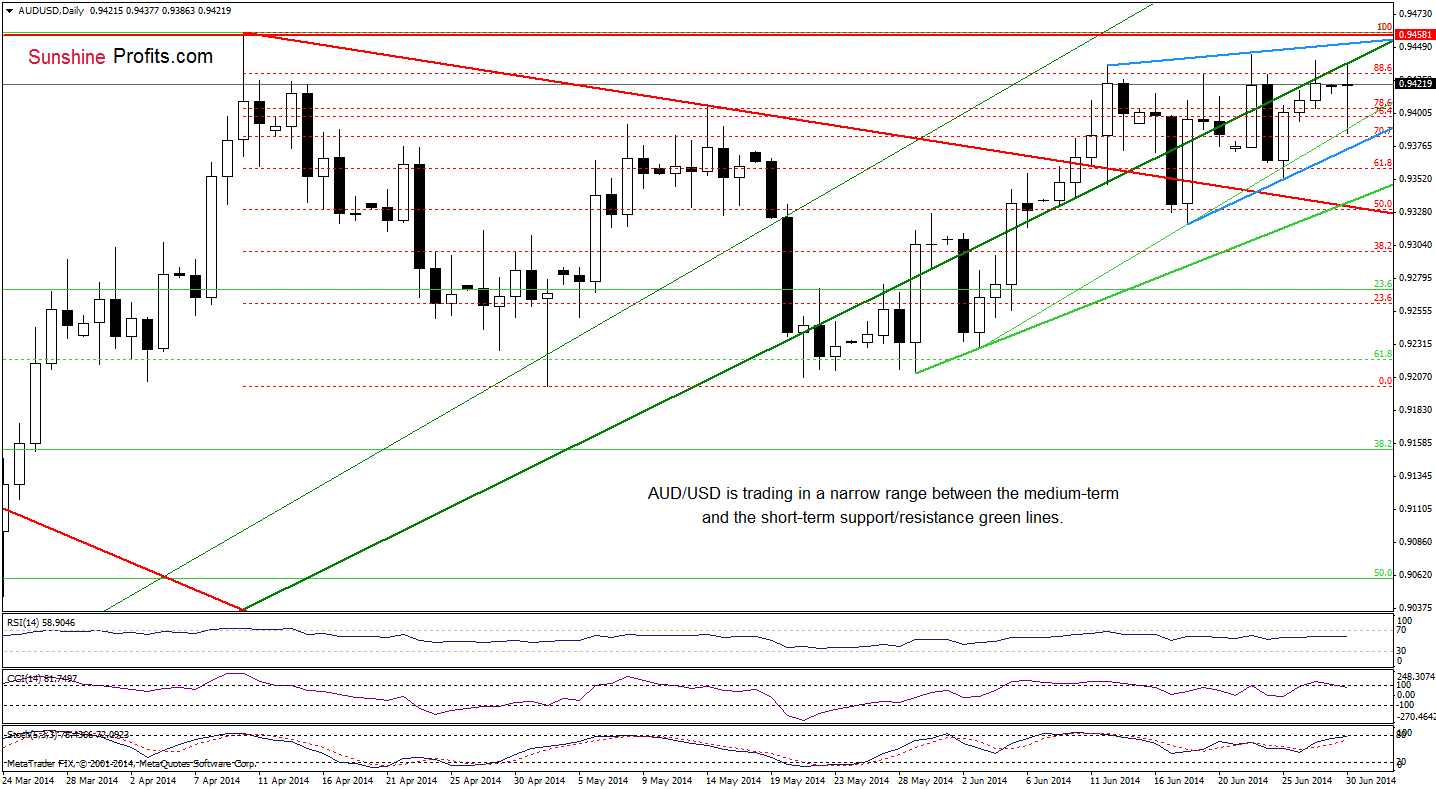
AUD/USD
The situation in the medium term remains unchanged as the exchange rate still remains in the consolidation below the 2014 high and the medium-term green resistance. Today, we’ll focus on the very short-term changes.
Quoting our last Forex Trading Alert:
(…) the pair invalidated earlier breakout (similarly to what we noticed at the beginning of the week and also earlier this month), which is a bearish signal. Therefore, it seems to us that if the major support/resistance holds, we’ll see a downward move to the support line based on the June 3 and June 18 lows.
As you see on the daily chart, we noticed such price action earlier today. Despite this drop, the pair rebounded and approached the medium-term green line once again. So, what’s next for this currency pair? In recent days, we have seen several breakouts and breakdowns above/below the key support/resistance line. However, none of them was strong enough to trigger a bigger upward or downward move. Therefore, we think that we’ll see another sizable move only if AUD/USD breaks above the upper line of the rising wedge (marked with blue) or declines under the lower line of this formation. If we see a breakout, the upside target will be around 0.9523, where the next medium-term resistance line is. In the case of the breakdown, the initial downside target will be the red declining support line (currently around 0.9332).
Very short-term outlook: mixed with bearish bias
Short-term outlook: mixed
MT outlook: bearish
LT outlook: bearish
Trading position (short-term): In our opinion, no positions are justified from the risk/reward perspective. We will keep you informed should anything change, or should we see a confirmation/invalidation of the above.
Thank you.
Nadia Simmons
Forex & Oil Trading Strategist
Przemyslaw Radomski, CFA
Founder, Editor-in-chief
Gold & Silver Trading Alerts
Forex Trading Alerts
Oil Investment Updates
Oil Trading Alerts

