
Today, the U.S. dollar declined to a fresh five-and-a-half month low against its Canadian counterpart as yesterday’s disappointing U.S. gross domestic product data continued to weigh. With this downswing USD/CAD dropped to key support lines. Will they withstand the selling pressure?
In our opinion the following forex trading positions are justified - summary:
EUR/USD
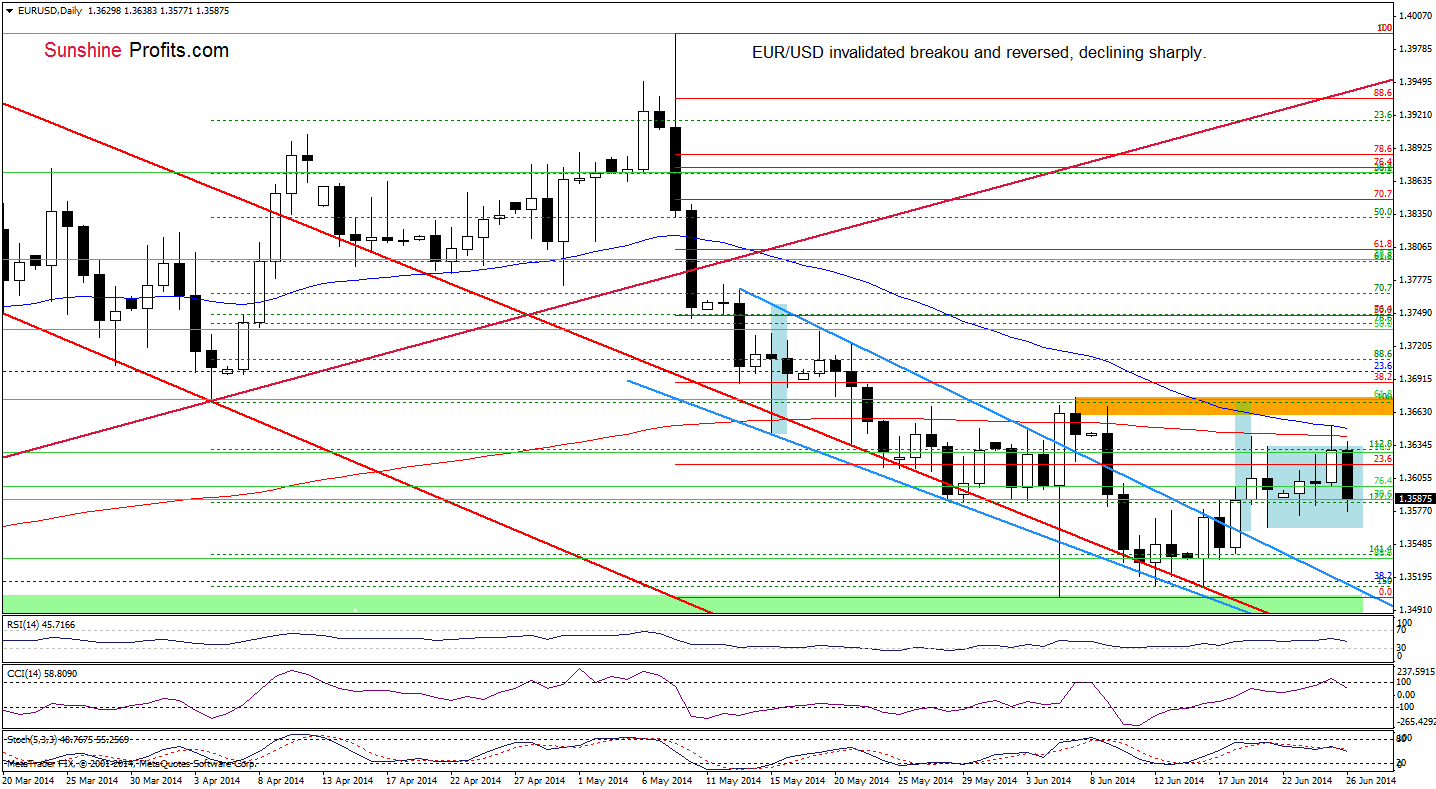
The situation in the medium term hasn’t changed much as EUR/USD is still trading in the consolidation between the support zone (created by the 38.2% Fibonacci retracement and last week’s low) and the June high, which is slightly below the long-term declining line at the moment. What can we infer from the very short-term chart?
Quoting our last Forex Trading Alert:
(…) slightly above the recent highs is the 200-day moving average, which successfully stopped further improvement on Thursday. Therefore, even if the exchange rate moves higher, it seems to us that history will repeat itself and we’ll see a pullback (especially when we factor in the proximity to the 50-day moving average and a sell signal generated by the Stochastic Oscillator). If this is the case, the initial downside target will be Friday’s low and if it is broken we’ll see another try to reach the upper line of the declining wedge.
As you see on the above chart, currency bears realized the above-mentioned scenario partly as EUR/USD reversed and declined sharply after an increase to the 200- and 50-day moving averages. With this downswing, the exchange rate invalidated a small breakout above the upper line of the consolidation, which suggests that we may see further deterioration and a drop to the lower border of this formation (especially when we take into account sell signals generated by the CCI and Stochastic Oscillator). Please note that even if the exchange rate moves higher once again, it seems to us that the strong resistance zone created by both moving averages will be strong enough to stop further gains in the nearest future.
Very short-term outlook: mixed
Short-term outlook: bearish
MT outlook: bearish
LT outlook: bearish
Trading position (short-term; our opinion): In our opinion no positions are justified from the risk/reward perspective. We will keep you informed should anything change, or should we see a confirmation/invalidation of the above.
USD/CAD
On Friday, we wrote the following:
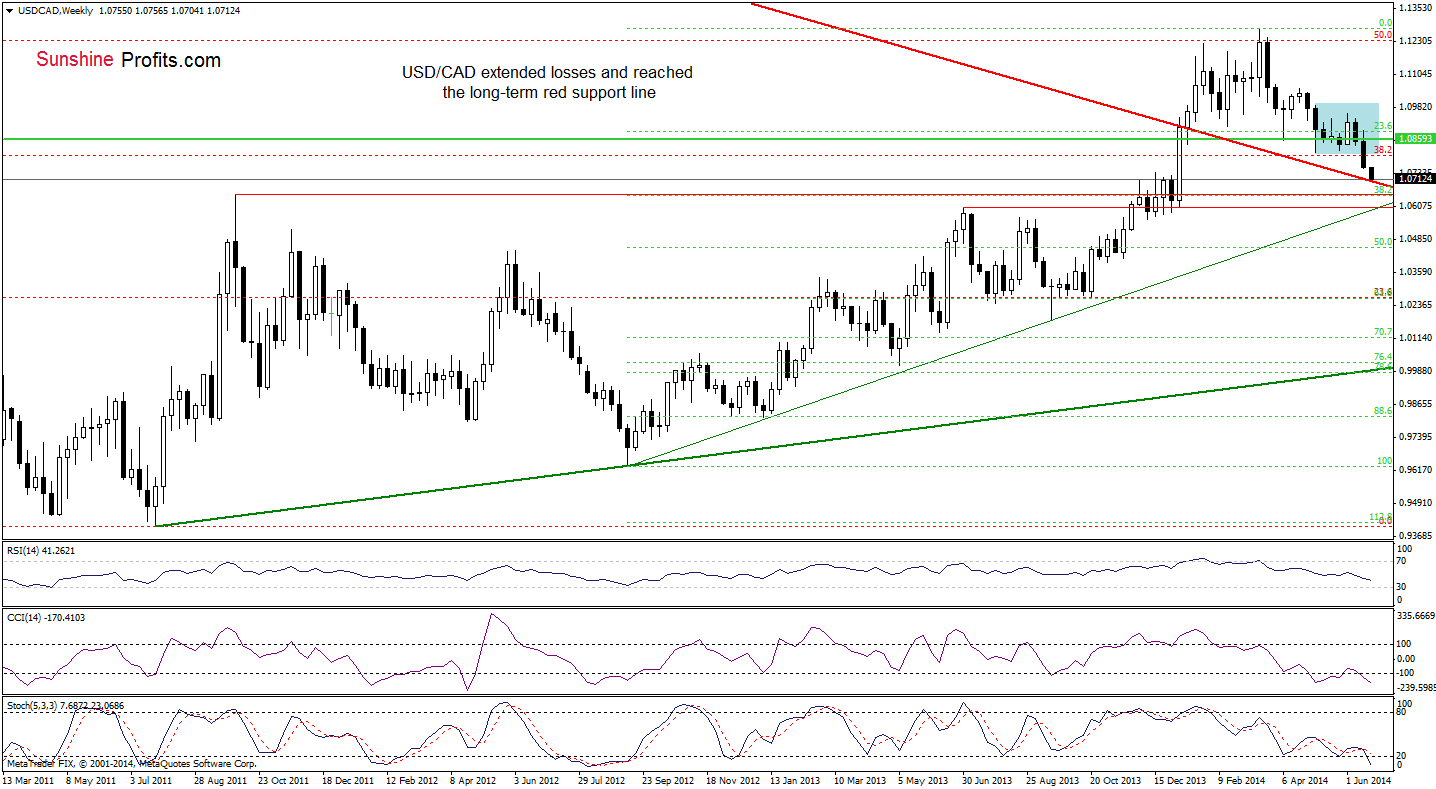
(…) USD/CAD declined below the 23.6% Fibonacci retracement, the 2010 high and more importantly, under the lower border of the consolidation. Taking this bearish event into account, we think that the pair will extend losses and test the strength of the previously-broken long-term red support line (currently around 1.0700).
As you see on the above chart, currency bears realized the above-mentioned scenario as USD/CAD reached its downside target. On one hand, if this strong support line encourage forex traders to push the buy button, we will see a corrective upswing in the coming week. On the other hand, if the major support is broken, we may see further deterioration and a drop to around 1.0645 where the 38.2% Fibonacci retracement is.
Having discussed the above, let’s move on to the daily chart.
In our last commentary on this currency pair, we wrote the following:
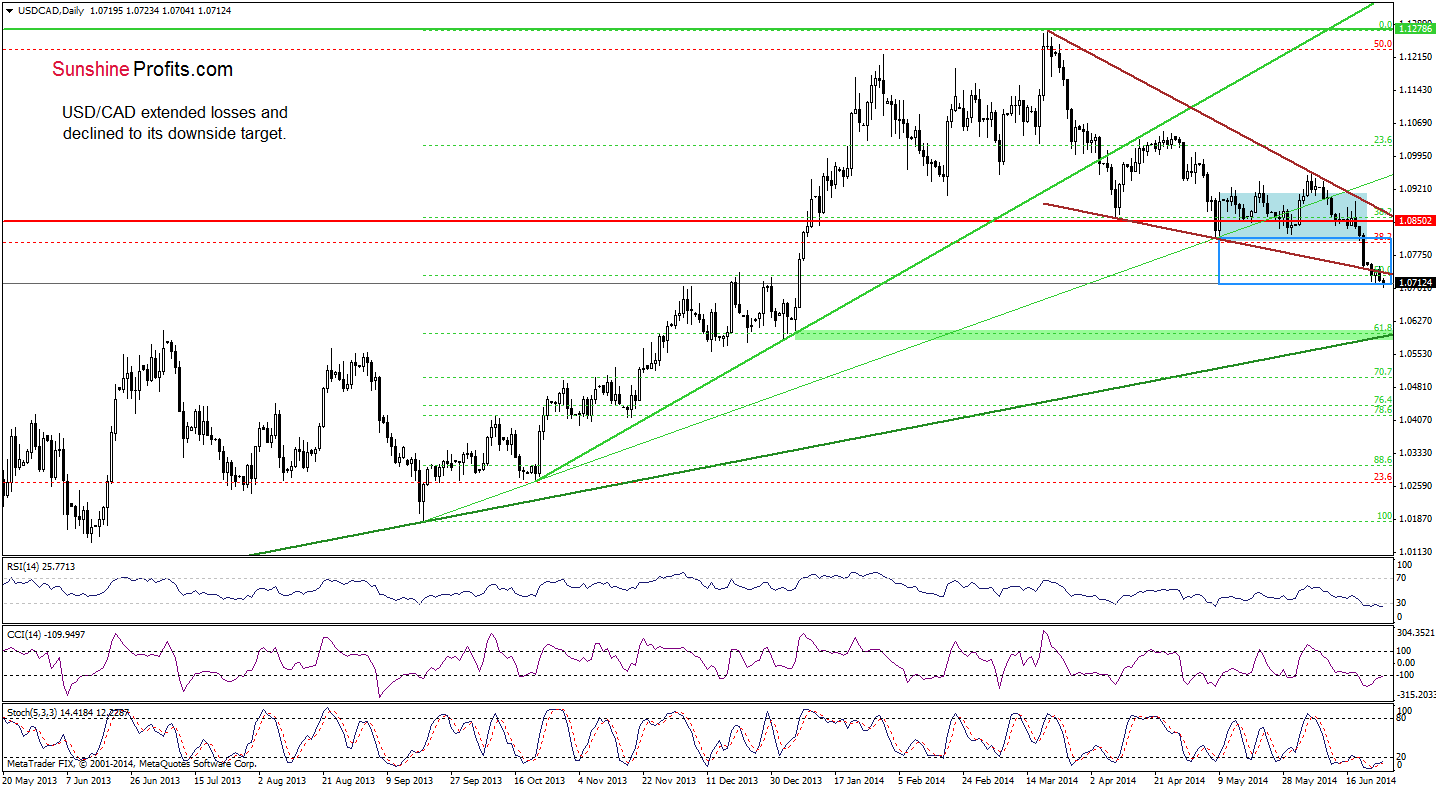
(…) USD/CAD moved lower once again and almost reached its downside target, hitting an intraday low of 1.0716. (…) although the pair rebounded slightly and came back above the 50% Fibonacci retracement, it still remains below the lower border of the declining wedge (marked with brown). This is a bearish signal, (…) and (…) as long as the pair remains under its resistance, another attempt to move lower can’t be ruled out.
From this perspective, we see that the exchange rate reached its downside target, declining to 1.0710, where the size of the downswing corresponds to the height of the consolidation. If this support holds we’ll likely see a rebound to the previously broken lower border of the declining wedge. However, if this area is broken, the next downside target will be around 1.0600, where the 61.8% Fibonacci retracement (based on the Sept.-March rally) is.
Very short-term outlook: bearish
Short-term outlook: bearish
MT outlook: mixed
LT outlook: bearish
Trading position (short-term): In our opinion no positions are justified from the risk/reward perspective as the space for further declines may be limited. We will keep you informed should anything change, or should we see a confirmation/invalidation of the above.
AUD/USD
The situation in the medium term hasn’t change much. Today, we’ll focus only on the very short-term changes.
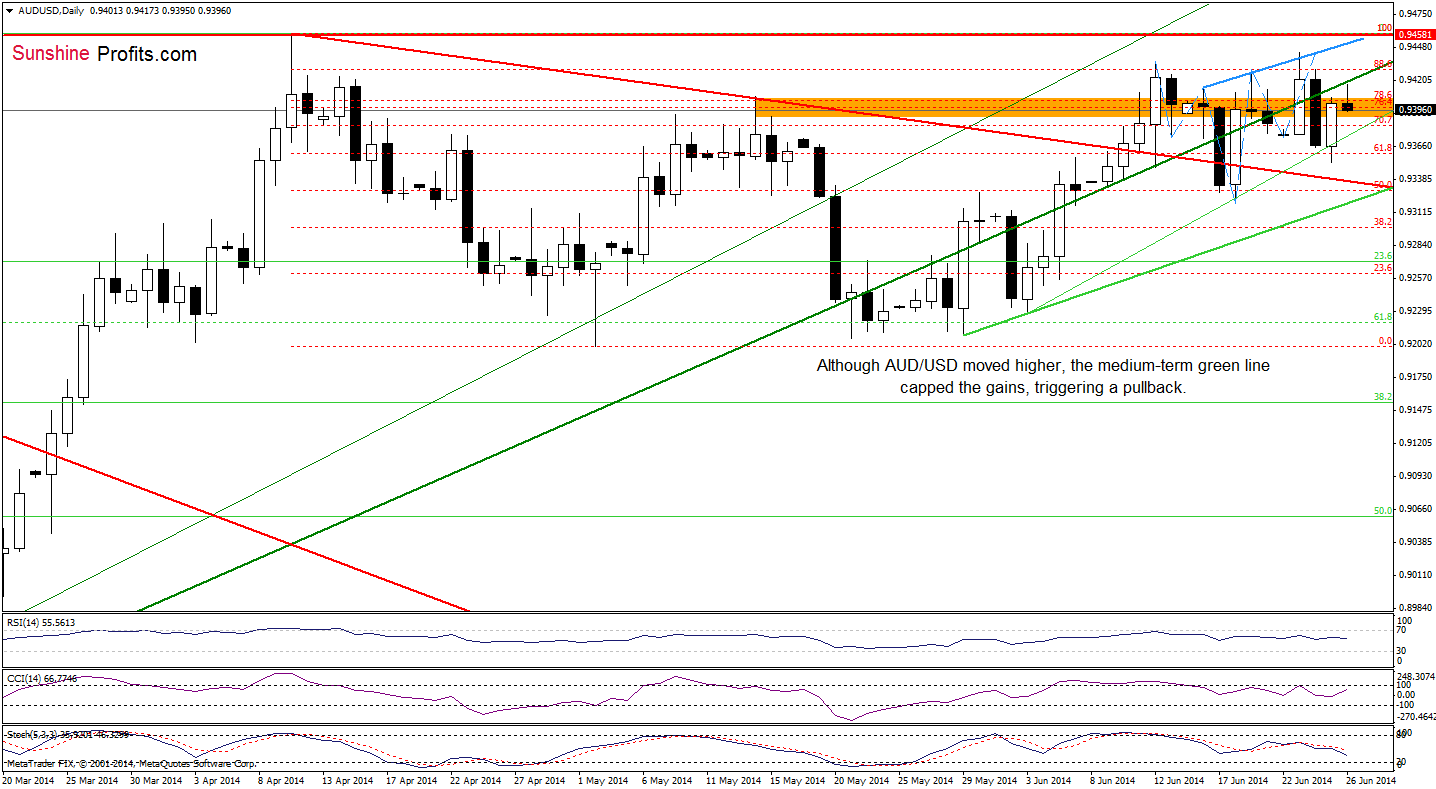
Looking at the daily chart, we see that although AUD/USD moved higher, the medium-term resistance line successfully stopped further improvement, triggering a downswing. From this perspective, it seems to us that the nearest downside target will be the support line based on the June 3 and June 18 lows. If it holds, we’ll see another attempt to break above the major resistance. However if it is broken, the next downside target will be around 0.9341, where the red declining support line is. Please note that we are still convinced that even if the pair move higher from here, the combination of the resistance zone and the green support line will be strong enough to stop currency bulls.
Very short-term outlook: mixed with bearish bias
Short-term outlook: mixed
MT outlook: bearish
LT outlook: bearish
Trading position (short-term): In our opinion, no positions are justified from the risk/reward perspective. We will keep you informed should anything change, or should we see a confirmation/invalidation of the above.
Thank you.
Nadia Simmons
Forex & Oil Trading Strategist
Przemyslaw Radomski, CFA
Founder, Editor-in-chief
Gold & Silver Trading Alerts
Forex Trading Alerts
Oil Investment Updates
Oil Trading Alerts

