
Earlier today, the U.S. dollar declined to a fresh five-and-a-half month low against its Canadian counterpart as upbeat Canadian data on inflation and retail sales released on Friday continued to weigh. As a result USD/CAD declined below the 50% Fibonacci retracement, approaching an important long-term support line. Will it manage to trigger a corrective upswing in the near future?
In our opinion the following forex trading positions are justified - summary:
EUR/USD
The situation in the medium term hasn’t changed much as EUR/USD is still trading in the consolidation between the support zone (created by the 38.2% Fibonacci retracement and last week’s low) and the June high, which is slightly below the long-term declining line at the moment. Are there any important changes in the very short-term chart?
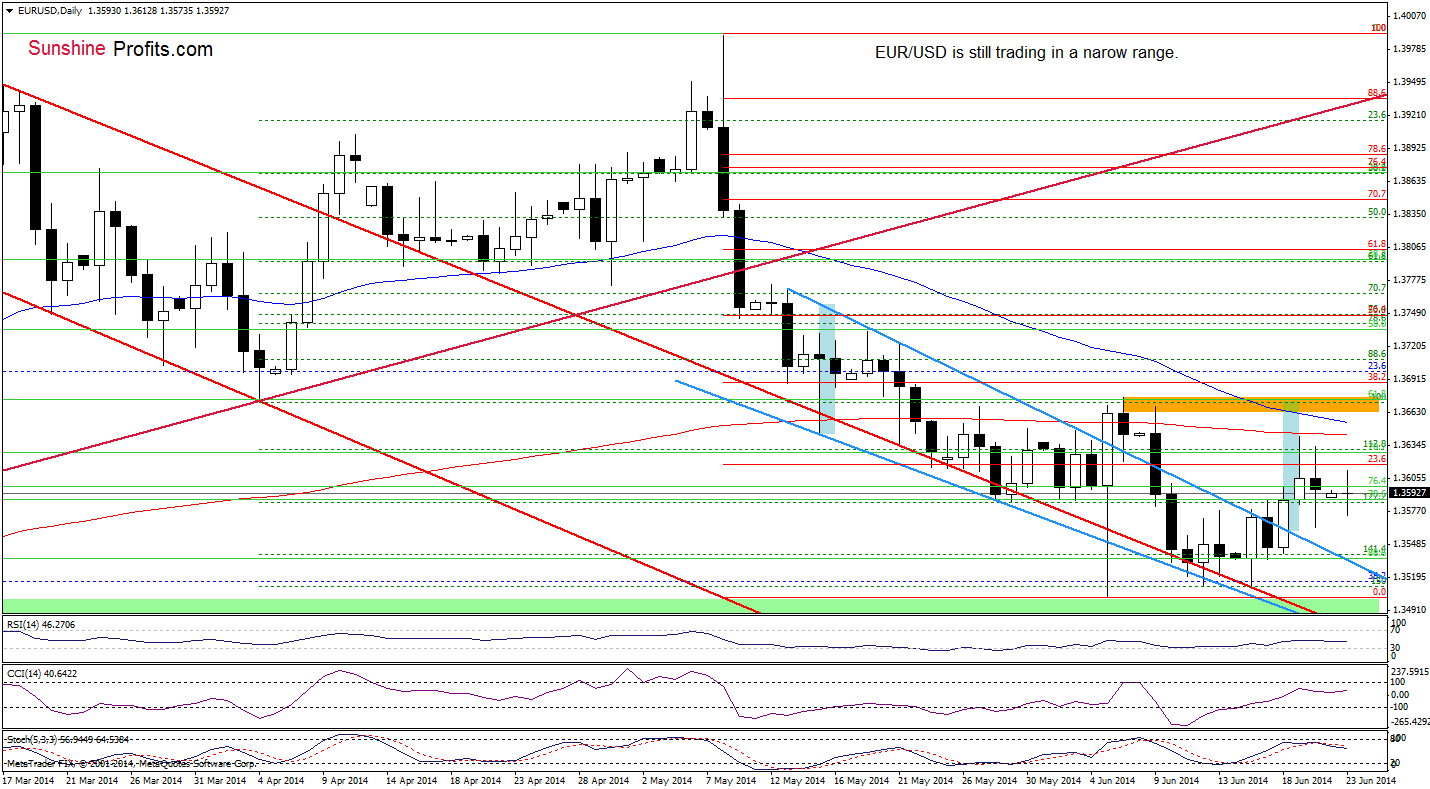
Looking at the above chart, we see that although the proximity to the previously-broken upper line of the declining wedge triggered a corrective upswing, EUR/USD is trading in a narrow range between Friday’s high and low. At this point it’s worth noting that slightly above the recent highs is the 200-day moving average, which successfully stopped further improvement on Thursday. Therefore, even if the exchange rate moves higher, it seems to us that history will repeat itself and we’ll see a pullback (especially when we factor in the proximity to the 50-day moving average and a sell signal generated by the Stochastic Oscillator). If this is the case, the initial downside target will be Friday’s low and if it is broken we’ll see another try to reach the upper line of the declining wedge.
Very short-term outlook: mixed
Short-term outlook: bearish
MT outlook: bearish
LT outlook: bearish
Trading position (short-term; our opinion): In our opinion no positions are justified from the risk/reward perspective. We will keep you informed should anything change, or should we see a confirmation/invalidation of the above.
USD/CAD
On Friday, we wrote the following:
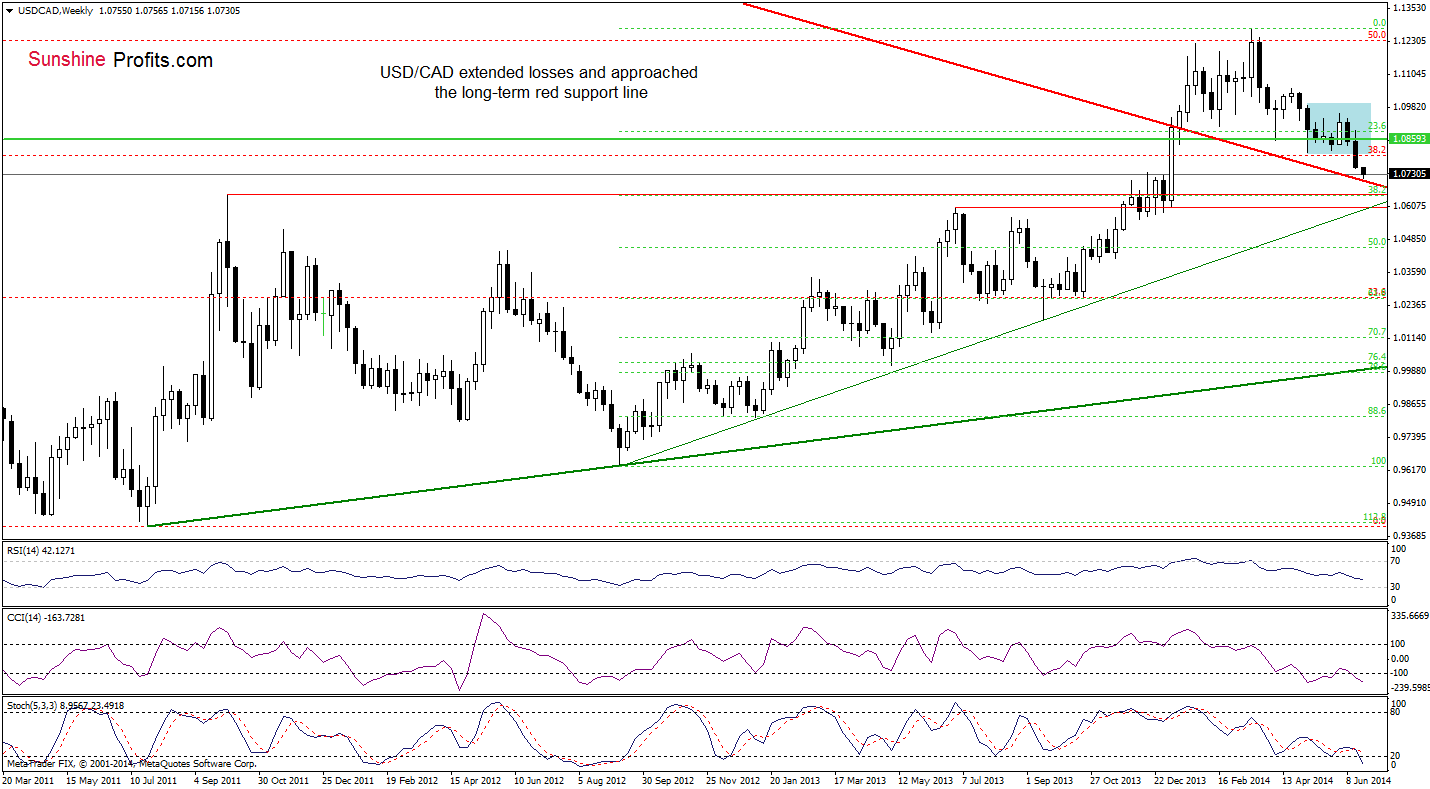
(…) USD/CAD declined below the 23.6% Fibonacci retracement, the 2010 high and more importantly, under the lower border of the consolidation. Taking this bearish event into account, we think that the pair will extend losses and test the strength of the previously-broken long-term red support line (currently around 1.0700).
As you see on the above chart, currency bears almost realized the above-mentioned scenario as USD/CAD approached its downside target. On one hand, if this strong support line encourage forex traders to push the buy button, we will see a corrective upswing in the coming week. On the other hand, we may see further improvement and a test of the strength of the major support line – especially when we factor in the current position of the indicators.
Will the short-term picture give us any interesting clues?
In our last commentary on this currency pair, we wrote the following:
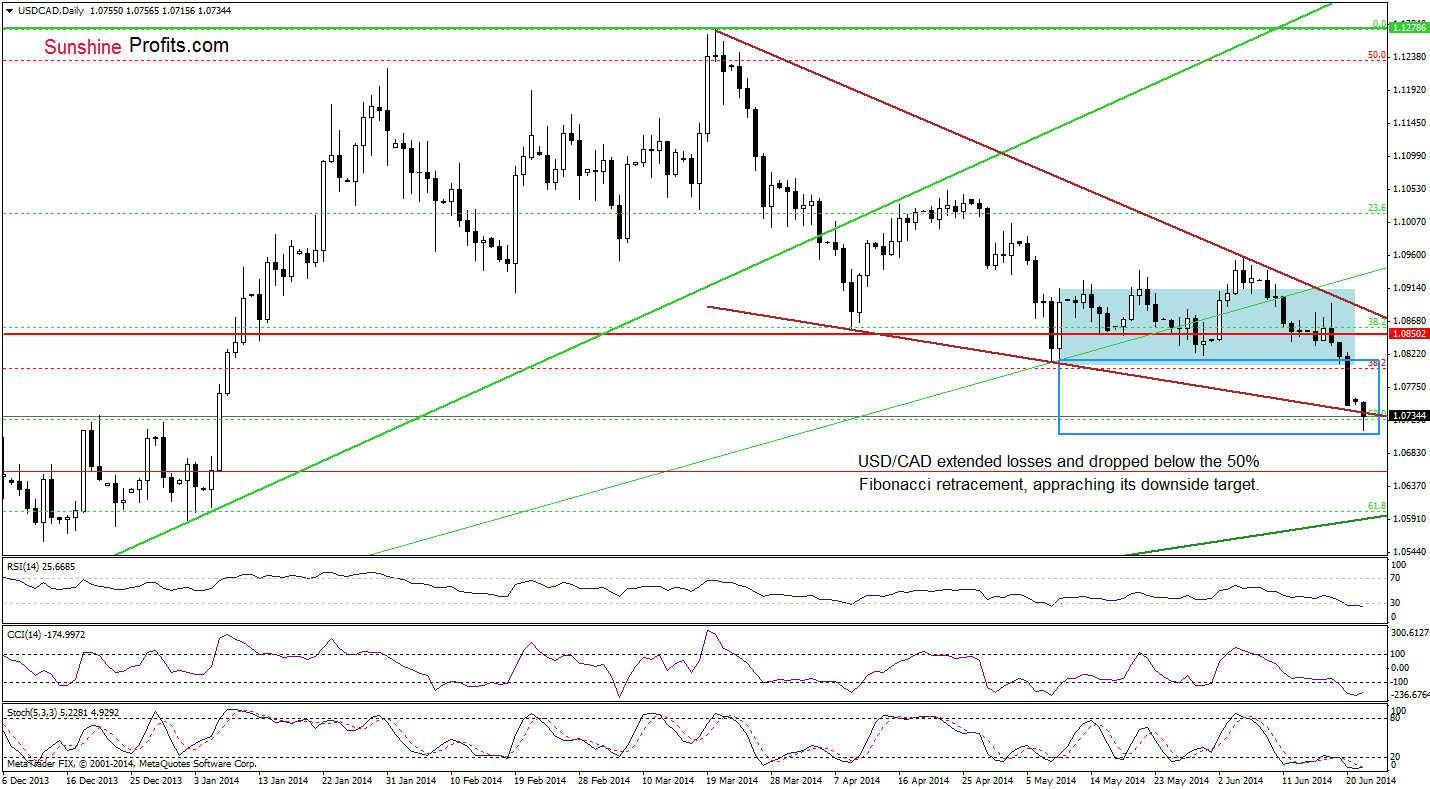
(…) If the lower border of the consolidation (…) is broken, the next downside target for currency bears will be the 50% Fibonacci retracement based on Sept.-March rally (around 1.0728).
(…) In our opinion, the pair will extend losses and reach its downside target in the coming week. Please note that if this support doesn’t withstand the selling pressure, we’ll see a drop to around 1.0710, where the size of the downswing will correspond to the height of the consolidation.
Looking at the daily chart, we see that USD/CAD moved lower once again and almost reached its downside target, hitting an intraday low of 1.0716. From this perspective, we see that although the pair rebounded slightly and came back above the 50% Fibonacci retracement, it still remains below the lower border of the declining wedge (marked with brown). This is a bearish signal, but taking into account the current position of the indicators (they are all oversold) and the proximity to the long-term support line (marked on the weekly chart), it seems to us that the space for further declines might be limited. If this is the case and currency bulls manage to push the exchange rate above this brown resistance line, we’ll see further improvement and a corrective upswing to the previously-broken lower border of the consolidation. Nevertheless, as long as the pair remains under its resistance, another attempt to move lower can’t be ruled out.
Very short-term outlook: bearish
Short-term outlook: bearish
MT outlook: mixed
LT outlook: bearish
Trading position (short-term): In our opinion no positions are justified from the risk/reward perspective as the space for further declines may be limited. We will keep you informed should anything change, or should we see a confirmation/invalidation of the above.
AUD/USD
The situation in the medium term hasn’t change much. Today, we’ll focus only on the very short-term changes.
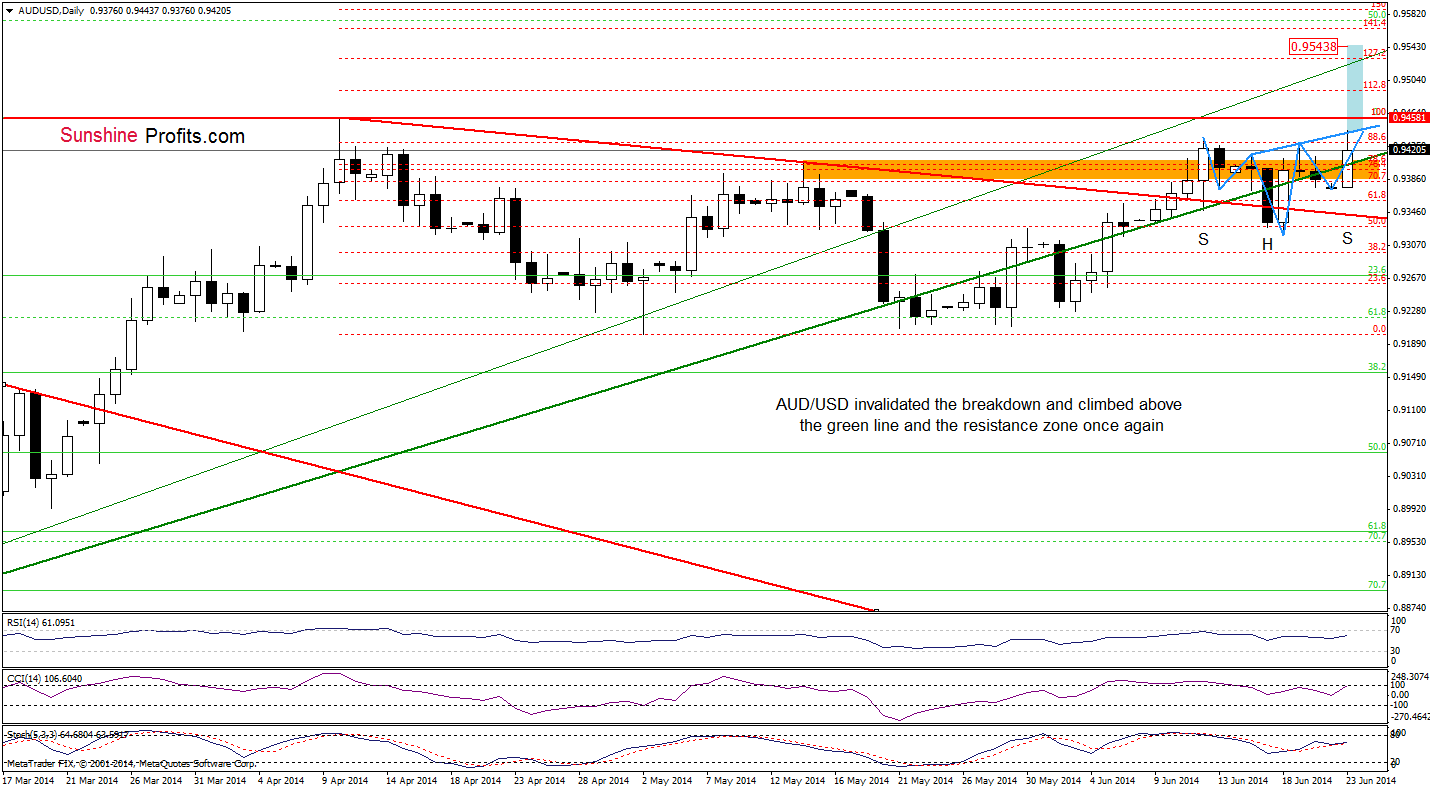
Looking at the daily chart, we see that the very short-term situation has improved once again as AUD/USD rebounded sharply and invalidated the breakdown below the resistance zone and the green support line. Although this is a bullish signal, we saw similar price action in mid-June (and also in the previous week). Back then, this was a “fakeout”, which triggered a pullback in the following days. Therefore, it seems that we may see a similar correction from here in the near future.
Nevertheless, we should keep in mind that we noticed an unconfirmed reverse head and shoulders pattern (marked with blue). If currency bulls manage to push the pair above the neck line (currently around 0.9438), we’ll likely see further improvement and an increase to a fresh 2014 high around 0.9530, where the 127.2% Fibonacci extension and the medium-term upper green line are.
Very short-term outlook: mixed
Short-term outlook: mixed
MT outlook: bearish
LT outlook: bearish
Trading position (short-term): In our opinion, no positions are justified from the risk/reward perspective. We will keep you informed should anything change, or should we see a confirmation/invalidation of the above.
Thank you.
Nadia Simmons
Forex & Oil Trading Strategist
Przemyslaw Radomski, CFA
Founder, Editor-in-chief
Gold & Silver Trading Alerts
Forex Trading Alerts
Oil Investment Updates
Oil Trading Alerts

