
Earlier today, the data showed that retail sales in Canada rose 1.1% in April, beating expectations for a 0.4% gain. Additionally, core retail sales, without automobiles, increased by 0.7% in April, while analysts had expected a 0.4% rise. A separate report showed that CPI in Canada rose 0.5% in May, above expectations for a 0.2% gain. On top of that, core consumer price inflation, without the eight most volatile items, increased 0.5% in the previous month, beating expectations for a 0.2% gain. As a result, the U.S. dollar declined to a five-and-a-half-month low against its Canadian counterpart. What happened at the same time with other major currency pairs? Did their short-term outlook change since the beginning of the week?
In our opinion the following forex trading positions are justified - summary:
EUR/USD
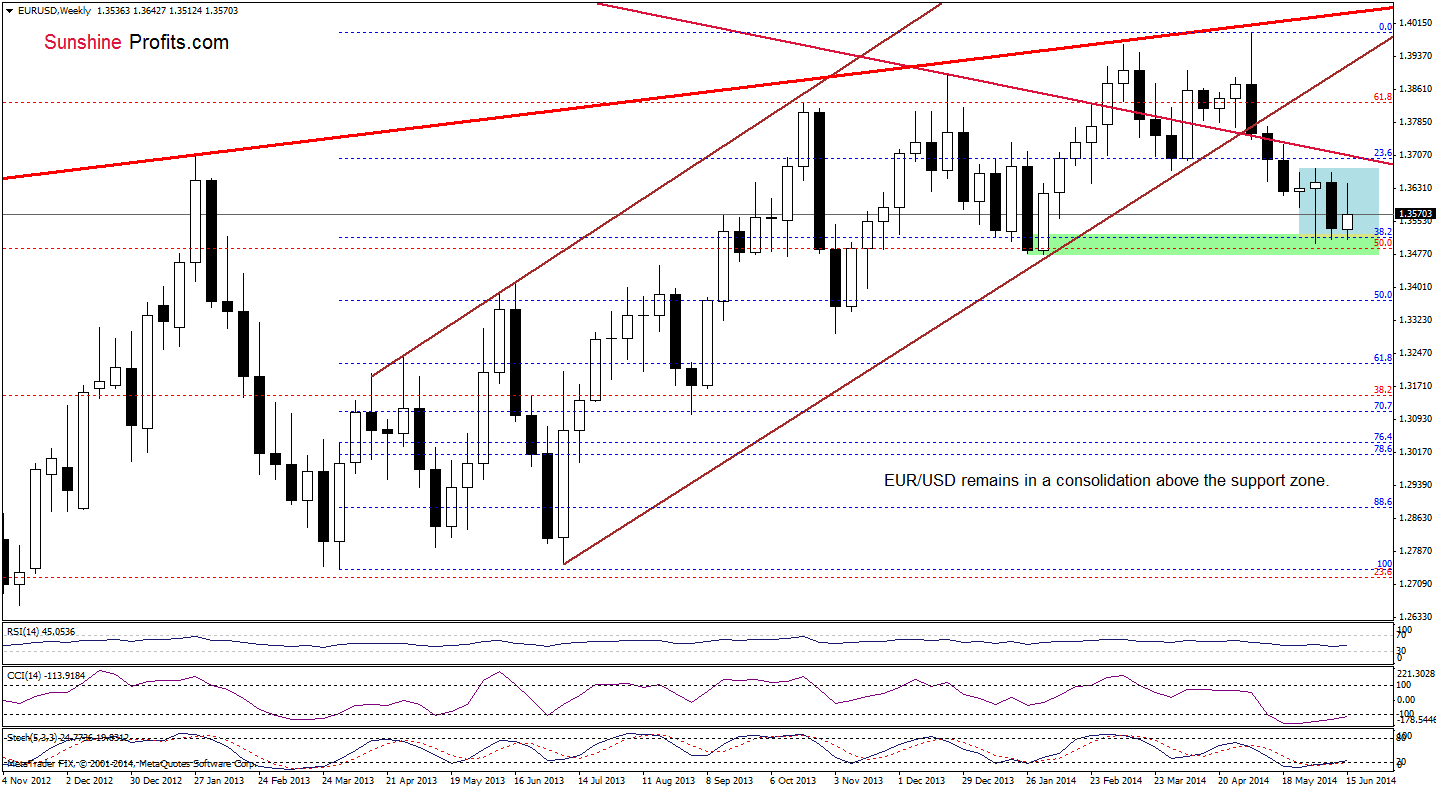
The overall situation in the medium term hasn’t changed much as EUR/USD is still trading in the consolidation between the support zone (created by the 38.2% Fibonacci retracement and last week’s low) and the June high, which is slightly below the long-term declining line at the moment. Taking into account the current position of the indicators, it seems to us that, we’ll see another attempt to reach the last week’s high of 1.3668. Nevertheless, as long as there is no breakout above the upper line of the consolidation (or breakdown below the lower border of the formation), another sizable move is not likely to be seen.
Having say that, let’s check the very short-term changes.
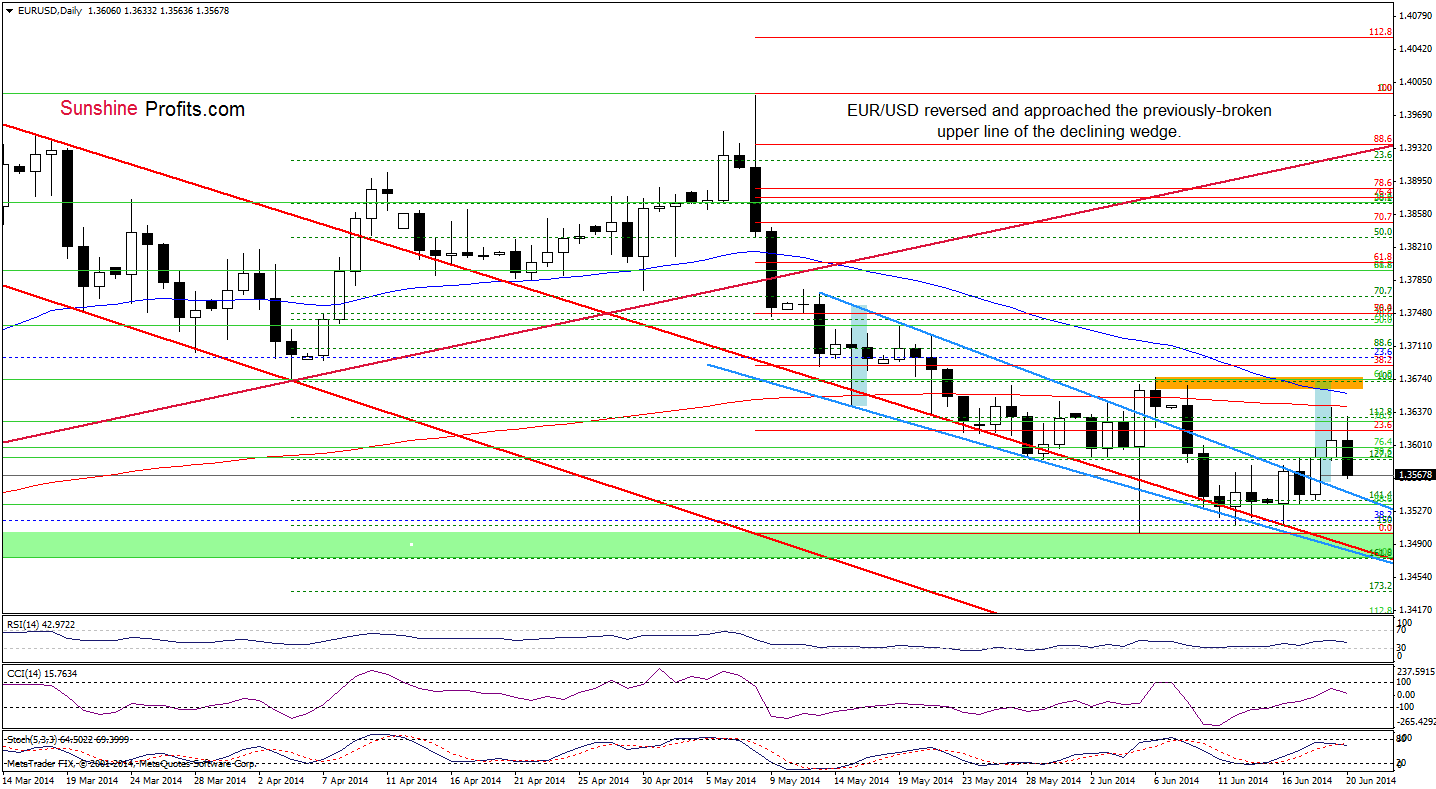
Looking at the above chart, we see that EUR/USD reversed after an increase to the 200-day moving average. Earlier today, the exchange rate extended losses and approached the previously-broken upper line of the declining wedge. At this point, we should consider two scenarios. On one hand, if this support line withstands the selling pressure, we’ll see another attempt to break above the nearest resistance and reach the upside target around 1.3670, where the size of an upswing will correspond to the height of the declining wedge (marked with blue). However, if the pair invalidates the breakout (similarly to what we noticed earlier this month), we’ll see further deterioration and a drop to at least Monday’s low of 1.3579.
Very short-term outlook: mixed
Short-term outlook: bearish
MT outlook: bearish
LT outlook: bearish
Trading position (short-term; our opinion): In our opinion no positions are justified from the risk/reward perspective. We will keep you informed should anything change, or should we see a confirmation/invalidation of the above.
GBP/USD
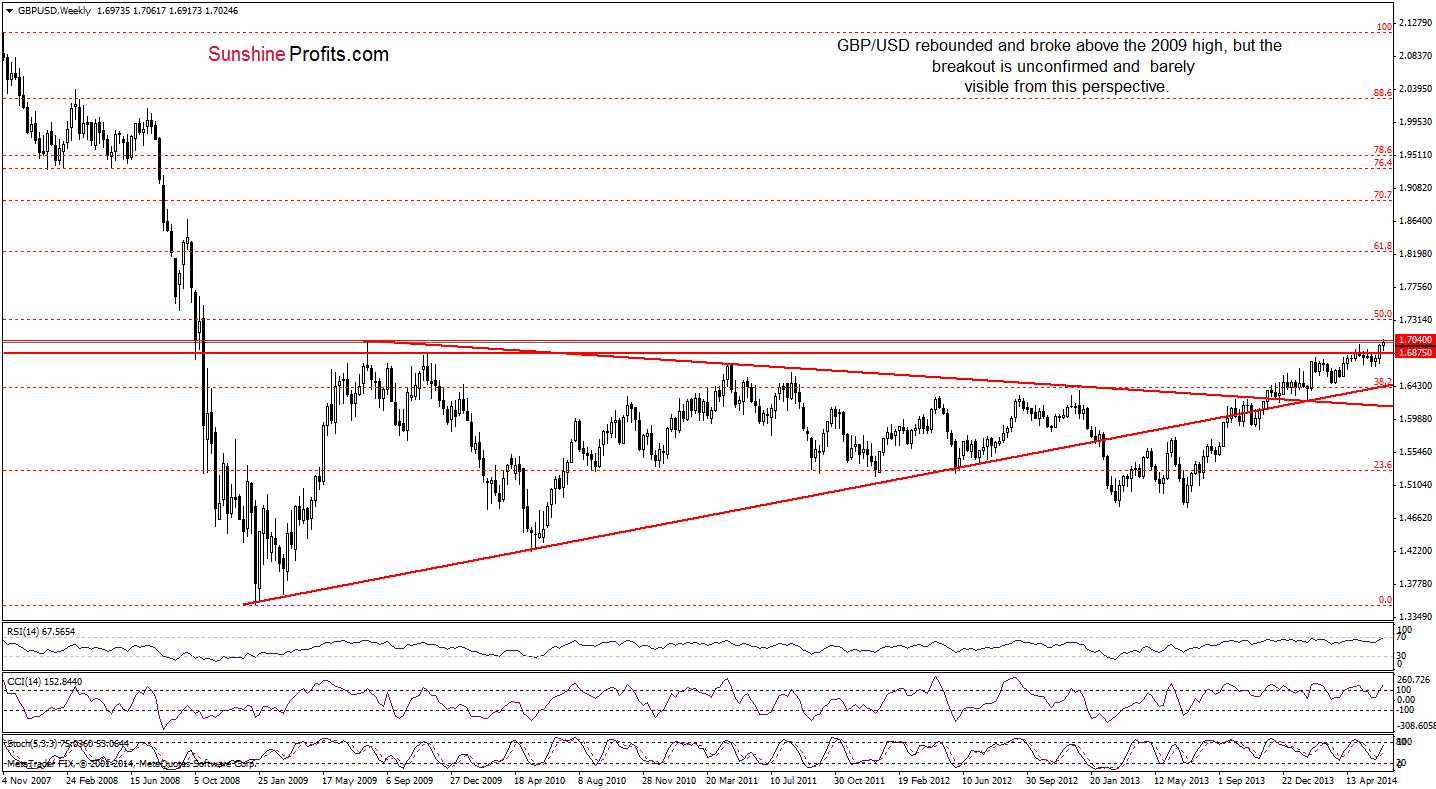
Looking at the above chart, we noticed that GBP/USD rebounded and broke above the 2009 high. Although this is a bullish signal, the breakout is unconfirmed and barely visible from this perspective. Therefore, to have a more complete picture of this currency pair, let’s zoom in our picture and take a look at the daily chart.
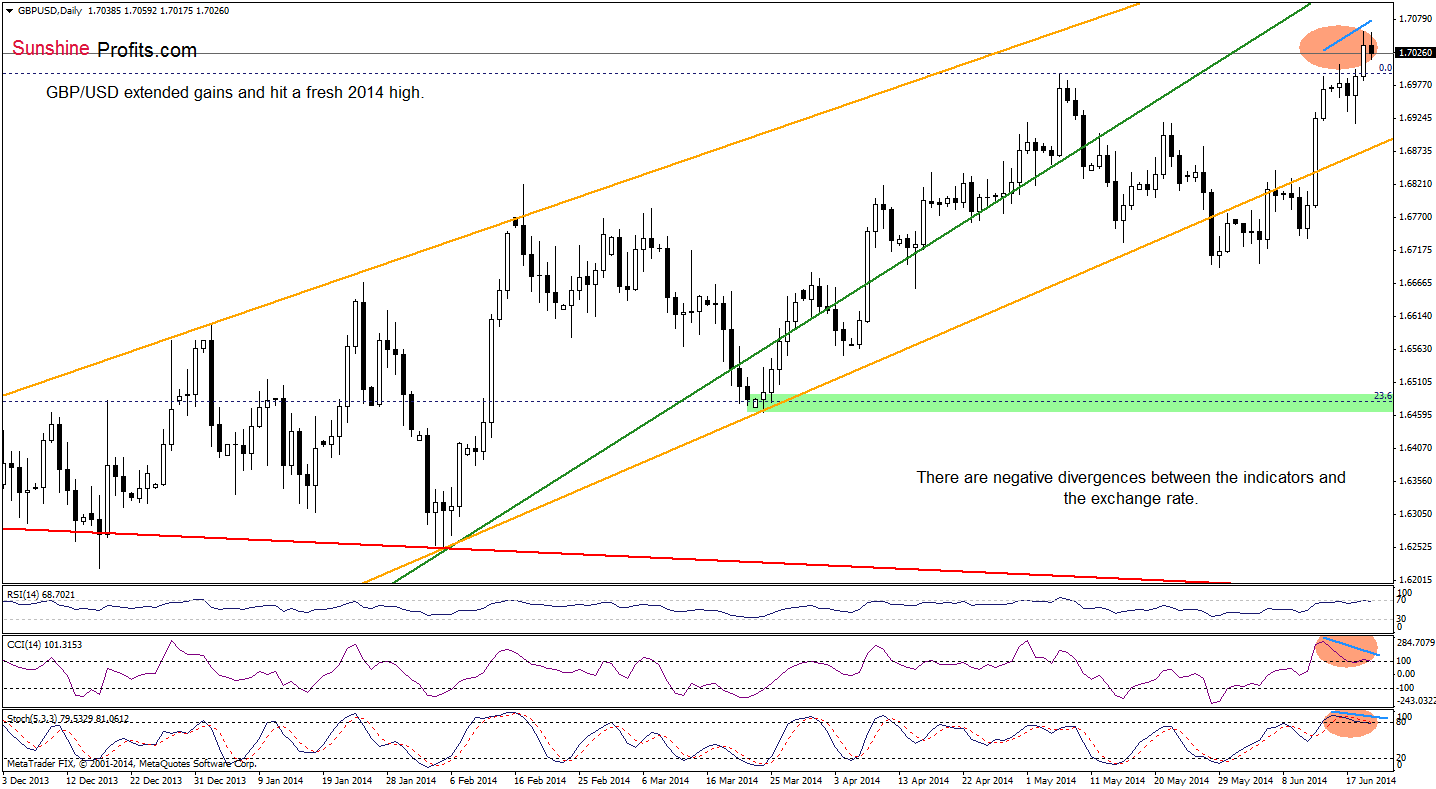
From this perspective, we see that GBP/USD climbed above the previous highs, hitting a fresh annual peak. Similarly to what we wrote earlier, discussing the medium-term picture, although this is a bullish signal, the breakout is unconfirmed. Additionally, it seems to us that we’ll call this upswing “the fakeout” as the RSI reached the level of 70, while the CCI and Stochastic Oscillator are overbought and very close to generating sell signals. On top of that, there are clearly visible negative divergences between these indicators and the exchange rate, which provides us with bearish implications, suggesting that a pause or correction is just around the corner. If this is the case, we think that the initial downside target will be around 1.6917, where the Wednesday’s low is.
Very short-term outlook: mixed with bearish bias
Short-term outlook: mixed with bearish bias
MT outlook: bearish
LT outlook: mixed
Trading position (short-term): In our opinion, no positions are justified from the risk/reward perspective. We will keep you informed should anything change, or should we see a confirmation/invalidation of the above.
USD/JPY
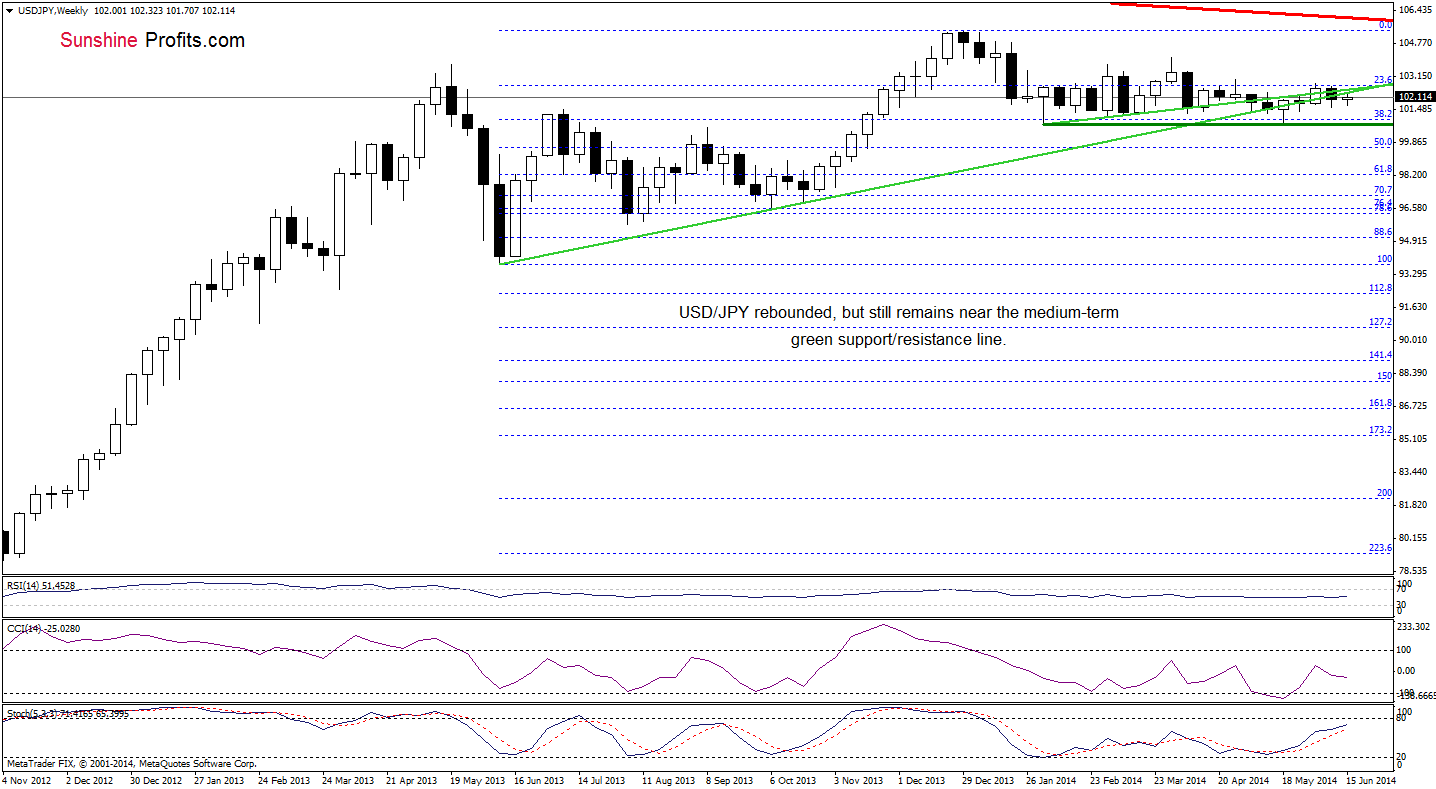
The situation on the weekly chart has deteriorated slightly as USD/JPY declined below the medium-term support line once again. Although the exchange rate rebounded, the pair is still trading around this major support/resistance line. If USD/JPY moves higher, it seems that the next upside target will be around 103, where the 50% Fibonacci retracement based on the entire decline is. However, if the exchange rate extends losses, we may see a decline even to the May low.
Once we know the medium-term situation, let’s take a closer look at the short-term picture.
A week ago, we wrote the following:
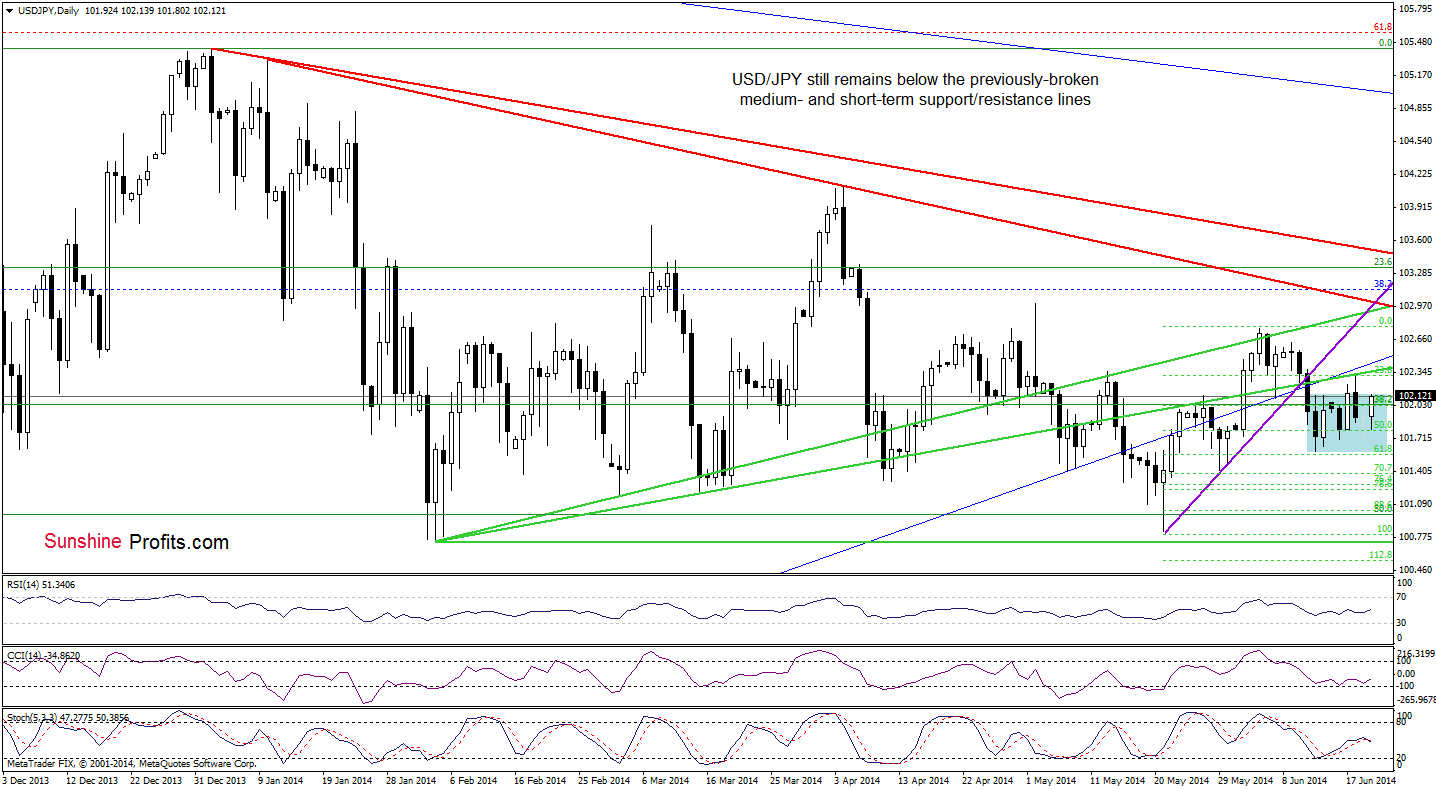
(…) USD/JPY extended declines and dropped to the 61.8% Fibonacci retracement based on the recent rally. This strong support encouraged forex traders to push the buy button and the pair rebounded. Despite today’s upswing, the exchange rate still remains below the previously-broken medium-term blue rising line and the lower green line. They serve as major resistance at the moment and it seems that as long as they remain in play, the space for further growth is limited.
Looking at the daily chart, we see that the above-mentioned resistance lines successfully stopped further improvement in the recent days. As a result, USD/JPY reversed and declined to the 50% Fibonacci retracement, which triggered a corrective upswing earlier today. Although the pair moved little higher, it still remains below major resistance lines. Therefore, we are convinced that we’ll see another sizable move only if the pair breaks above them. If we see such price action, the upside target will be around 102.90, where the purple resistance line intersects the upper green line. Nevertheless, we should keep in mind that if currency bulls fail once again and the pair declines below the 61.8% retracement, we’ll see further deterioration and a drop to the May 29 low (or even to the May low of 100.81).
Very short-term outlook: mixed
Short-term outlook: mixed
MT outlook: mixed
LT outlook: bearish
Trading position (short-term): In our opinion no positions are justified from the risk/reward perspective at the moment. We will keep you informed should anything change, or should we see a confirmation/invalidation of the above.
USD/CAD
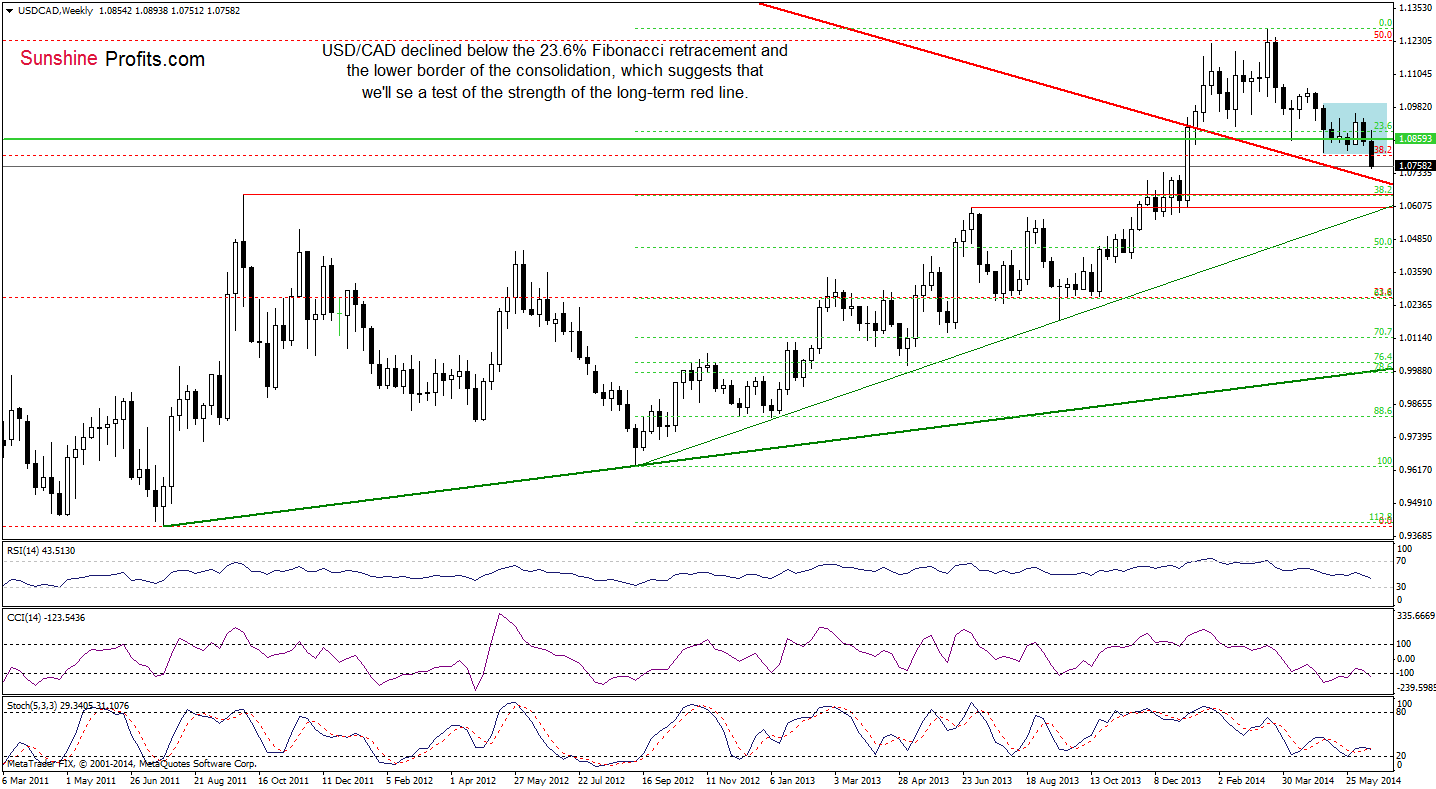
The medium-term outlook has deteriorated as USD/CAD declined below the 23.6% Fibonacci retracement, the 2010 high and more importantly, under the lower border of the consolidation. Taking this bearish event into account, we think that the pair will extend losses and test the strength of the previously-broken long-term red support line (currently around 1.0700). Will the short-term picture give us a confirmation of this bearish scenario?
In our last commentary on this currency pair, we wrote the following:
(…) the exchange rate reversed and declined below the upper line of the consolidation. An invalidation of the breakout was a strong bearish signal that triggered further deterioration and a drop under the medium-term green support line. With this downswing, USD/CAD reached the horizontal red support line based on the 2010 high. (…) if the pair moves lower, we’ll see a re-test of the strength of the lower line of this formation.
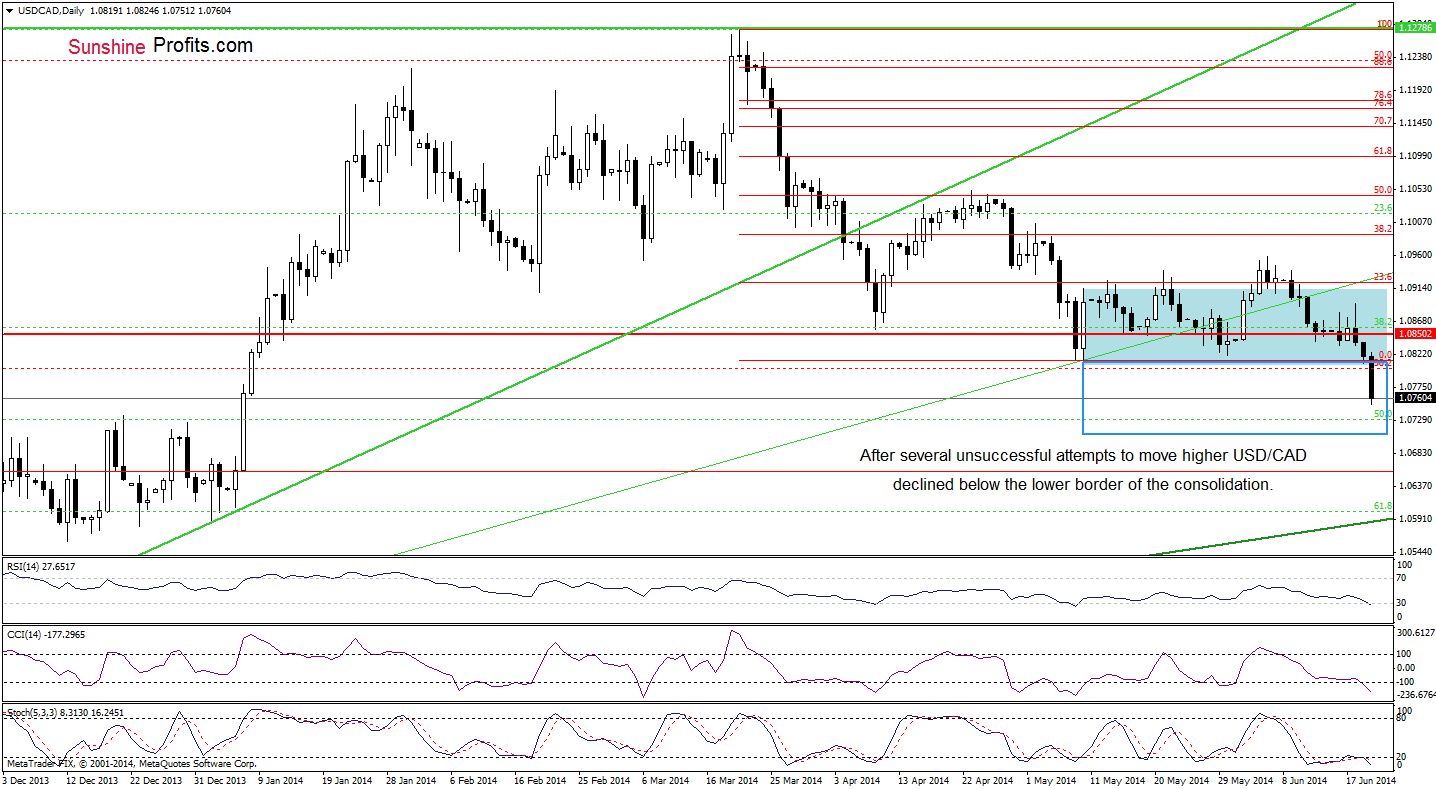
As you can see on the above chart, the situation developed exactly as we expected it to. After the decline, bears pushed the exchange rate even below the lower border of the formation. Taking this breakdown into account, we would like to quote our Forex Trading Alert posted on May 30:
(…) If the lower border of the consolidation (…) is broken, the next downside target for currency bears will be the 50% Fibonacci retracement based on Sept.-March rally (around 1.0728).
In our opinion, the pair will extend losses and reach its downside target in the coming week. Please note that if this support doesn’t withstand the selling pressure, we’ll see a drop to around 1.0710, where the size of the downswing will correspond to the height of the consolidation.
Very short-term outlook: bearish
Short-term outlook: bearish
MT outlook: mixed
LT outlook: bearish
Trading position (short-term): In our opinion no positions are justified from the risk/reward perspective as the space for further declines may be limited. We will keep you informed should anything change, or should we see a confirmation/invalidation of the above.
USD/CHF
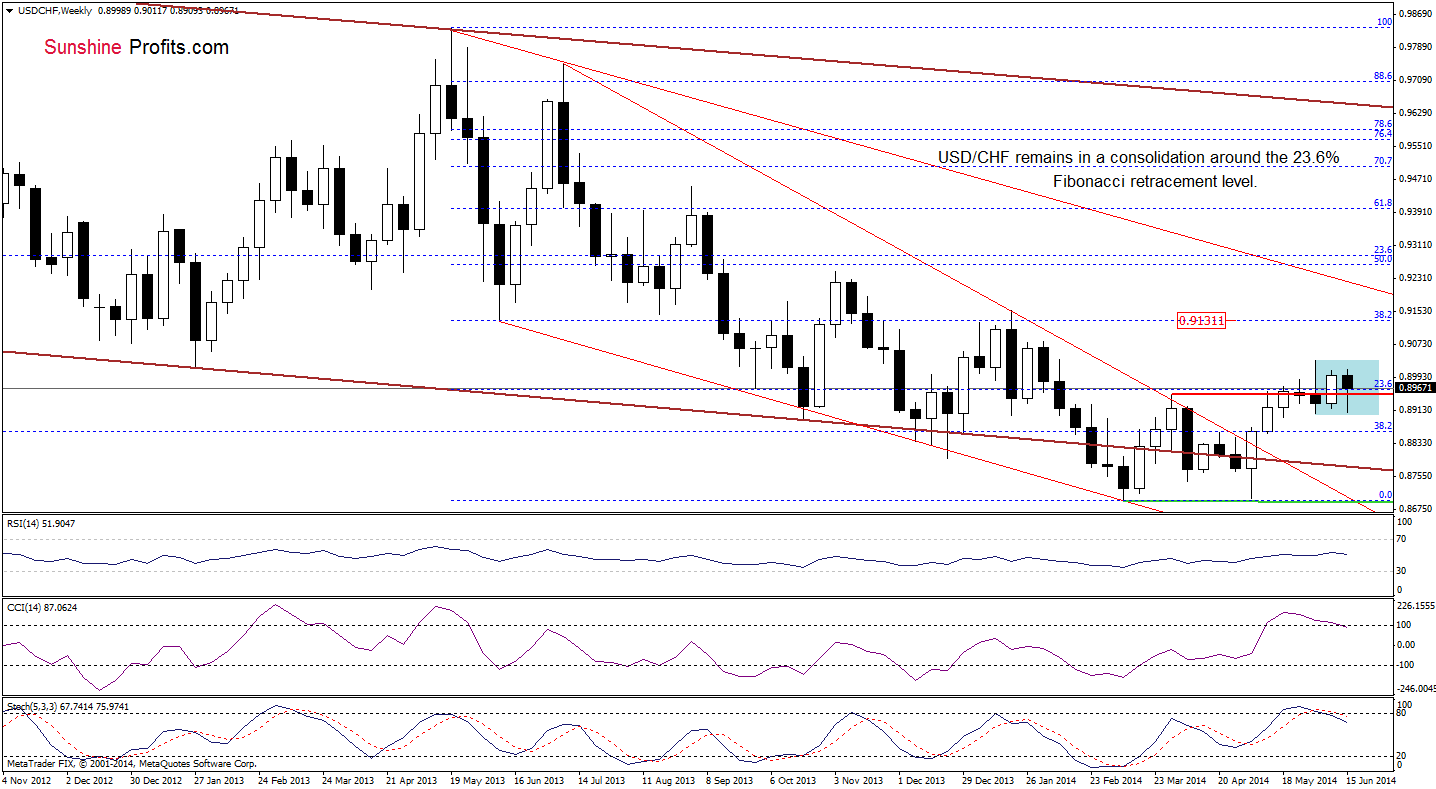
From this prspective, we see that the overall situation in the medium term hasn’t changed much as USD/CHF still remains in the consolidation around the 23.6% Fibonacci retracement and the April high. In our opinion, as long as there is no breakout above the June high (or breakdon below 0.8931), another sizable move is not likely to be seen. Nevertheless, we should keep in mind that the CCI and Stochastic Oscillator generated sell signals, which suggests that we’ll see another attempt to move lower in the coming week. Please note that if the pair drops below the lower border of the consolidation, the initial downside targert, will be around 0.8780, where the lower line of the declining trend channel (marked with brown) is.
Can we infer something more from the short-term picture?
In our Forex Trading Alert posted a week ago, we wrote the following:
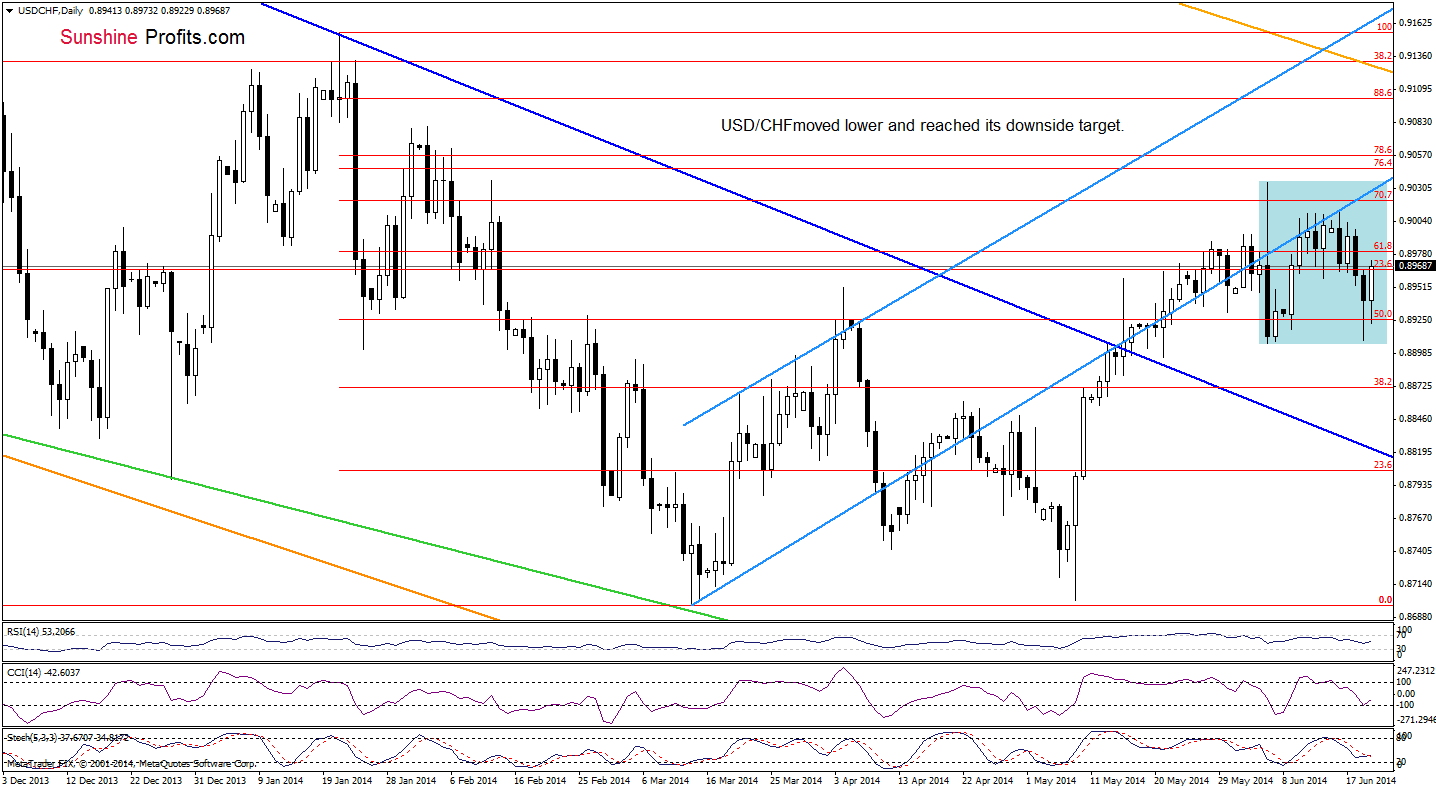
(…) the pair is still trading below the blue resistance line. In our opinion, as long as this line is in play another attempt to move lower can’t be ruled out – especially when we take into account the current position of the indicators (the CCI is overbought, Stochastic Oscillator reached the level of 80 and the RSI is at its highest level since the beginning of June). If this is the case, the downside target will be the lower border of the consolidation (around 0.8907).
On Monday, we added:
(…) the pair reversed and declined sharply after another unsuccessful attempt to break above the blue resistance line. Taking this bearish fact into account, it seems to us that we’ll see realization of the above-mentioned scenario in the coming days.
From today’s point of view, we see that currency bears successfully pushed USD/CHF to its downside target yesterday. So far, the support line created by the lower border of the consolidation triggered a corrective upswing that took the pair higher. Despite this rebound, the exchange rate still remains below the previously-broken blue resistance line. Therefore, we think that as long as there is no breakout above this line (which currently intersects the June high) or a breakdown below 0.8907, another sizable move is not likely. Nevertheless, we should keep in mind that the current position of the indicators favors currency bulls at the moment.
Very short-term outlook: mixed
Short-term outlook: mixed
MT outlook: mixed with bullish bias
LT outlook: bearish
Trading position (short-term): In our opinion no positions are justified from the risk/reward perspective. We will keep you informed should anything change, or should we see a confirmation/invalidation of the above.
AUD/USD
Quoting our yesterday’s Forex Trading Alert:
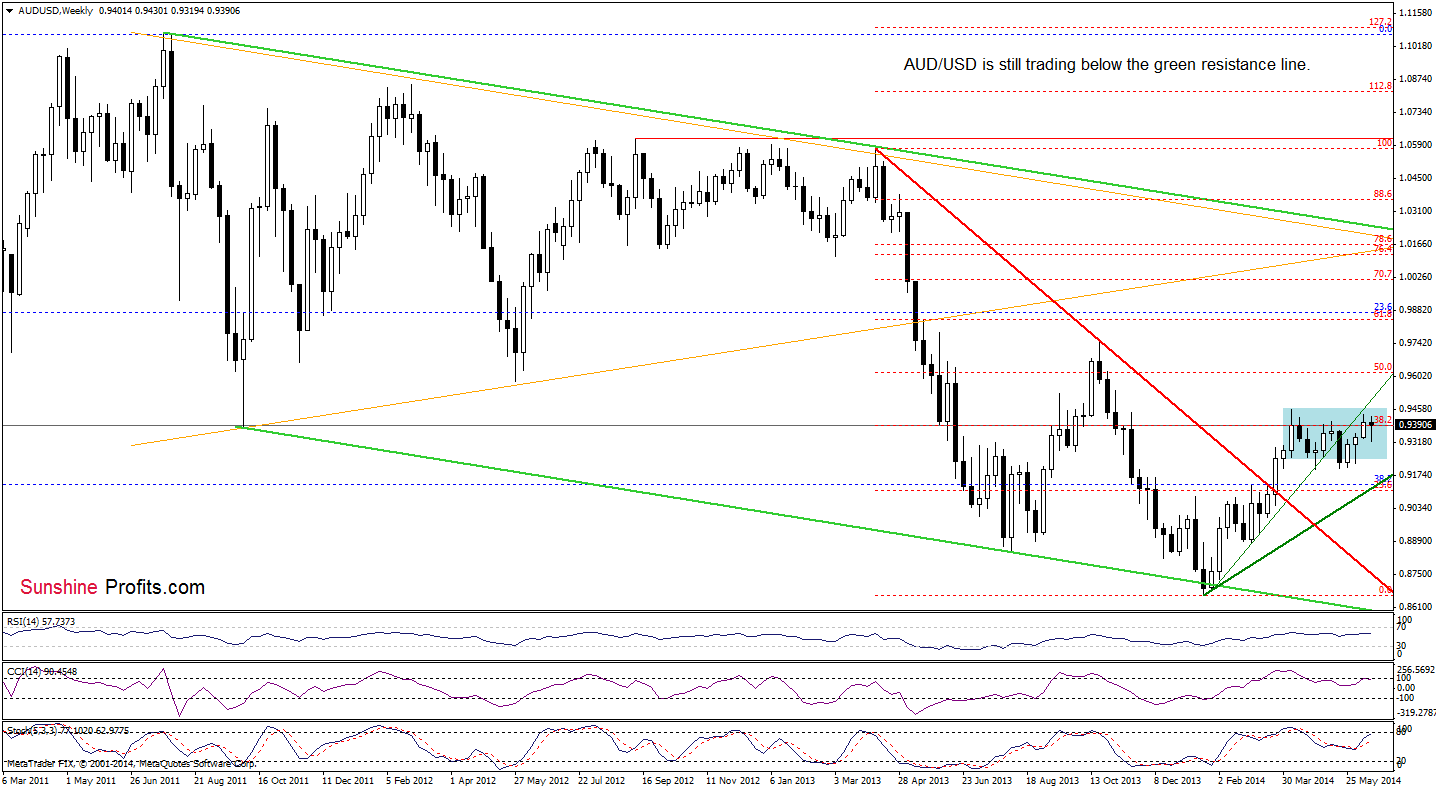
(…) the situation in the medium term hasn’t changed much, but the very short-term outlook improved significantly as AUD/USD rebounded sharply, invalidating earlier breakdown below both resistance lines. With this upswing, the exchange rate also broke above the resistance zone created by the 76.4% and 78.6% Fibonacci retracements, approaching the last week’s high. If the 88.6% and the last Thursday high hold, we’ll see a pullback from here and the initial downside target will be the medium-term green line.
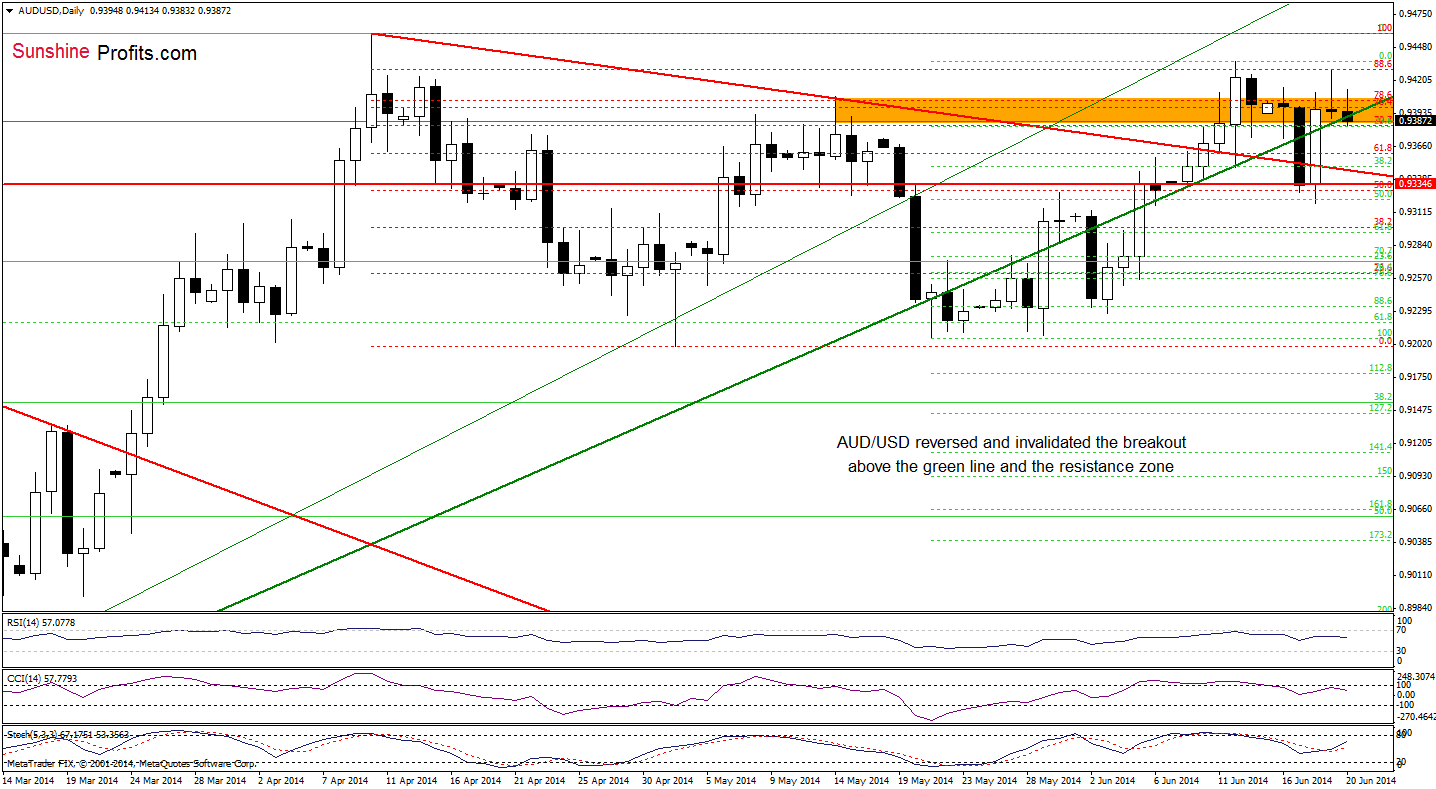
Looking at the daily chart, we see that currency bears realized the above-mentioned scenario earlier today. From this perspective, it seems to us that if this major support line is successfully broken (and the pair closes the day below it), the next downside target will be around 0.9347, where the red declining support line is.
Very short-term outlook: mixed with bearish bias
Short-term outlook: mixed
MT outlook: bearish
LT outlook: bearish
Trading position (short-term): In our opinion, no positions are justified from the risk/reward perspective. We will keep you informed should anything change, or should we see a confirmation/invalidation of the above.
Thank you.
Nadia Simmons
Forex & Oil Trading Strategist
Przemyslaw Radomski, CFA
Founder, Editor-in-chief
Gold & Silver Trading Alerts
Forex Trading Alerts
Oil Investment Updates
Oil Trading Alerts

