
Earlier today, the Australian dollar declined against its U.S. counterpart after the Reserve Bank of Australia comments. Later in the day, we saw further deterioration as the Labor Department reported that the U.S. CPI rose 2.1% on year in May (and 0.4% from April). This the fastest increase in annual inflation since October 2008 sparked demand for the greenback and pushed AUD/USD below two important support lines. How low could the exchange rate drop from here?
In our opinion the following forex trading positions are justified - summary:
- EUR/USD: none
- GBP/USD: none
- USD/JPY: none
- USD/CAD: none
- USD/CHF: none
- AUD/USD: short (stop-loss order: 0.9403)
EUR/USD
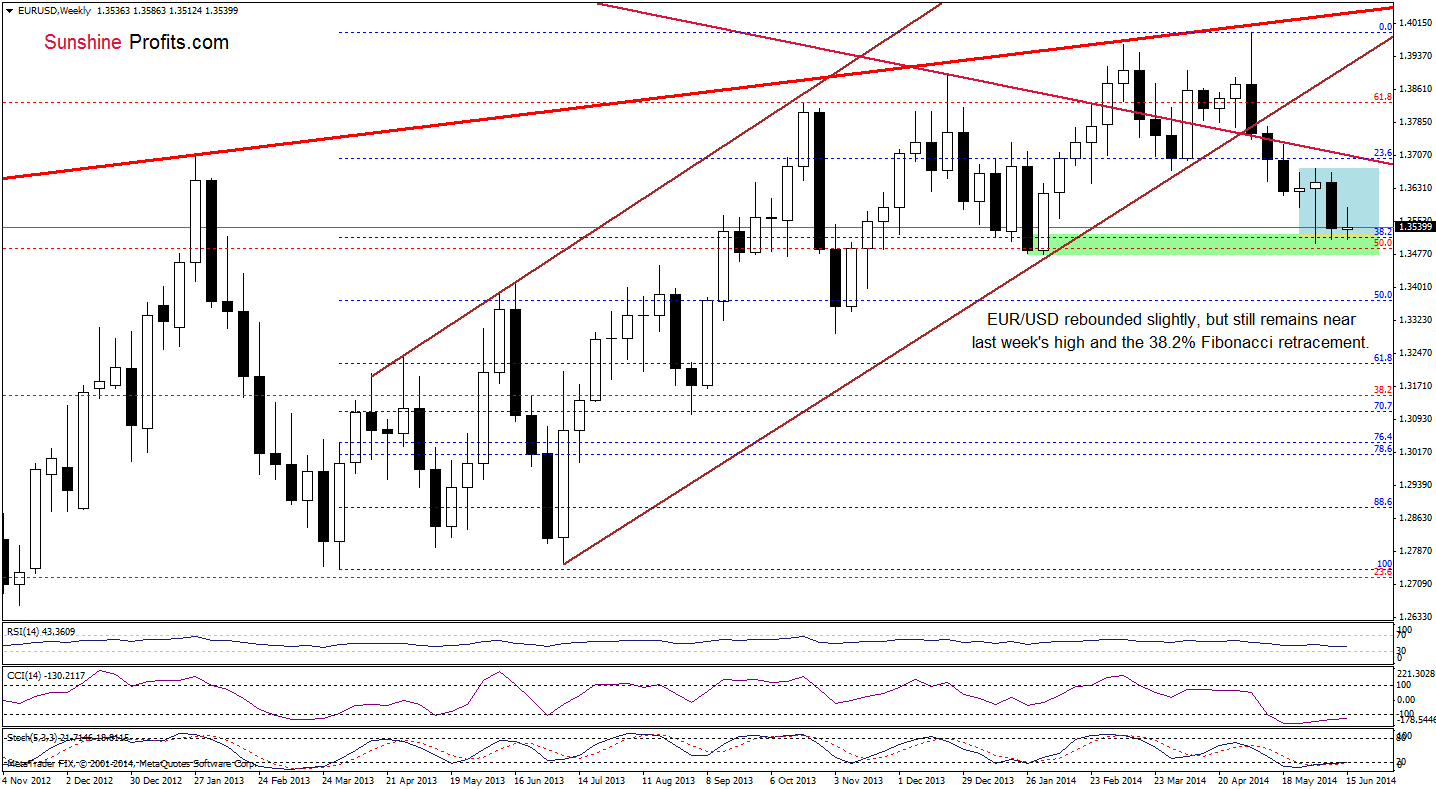
On the above chart, we see that EUR/USD gave up some gains and declined, approaching the support zone created by the 38.2% Fibonacci retracement and last week’s low once again. As a reminder, slightly below these levels are also the Jan. and Feb. lows, which serve as an additional support. Therefore, we think that if this area holds, we’ll see another attempt to break above the major resistance line. Please note that this scenario is currently reinforced by the position of the indicators (the CCI and Stochastic Oscillator are oversold).
Having say that, let’s take a closer look at the daily chart.
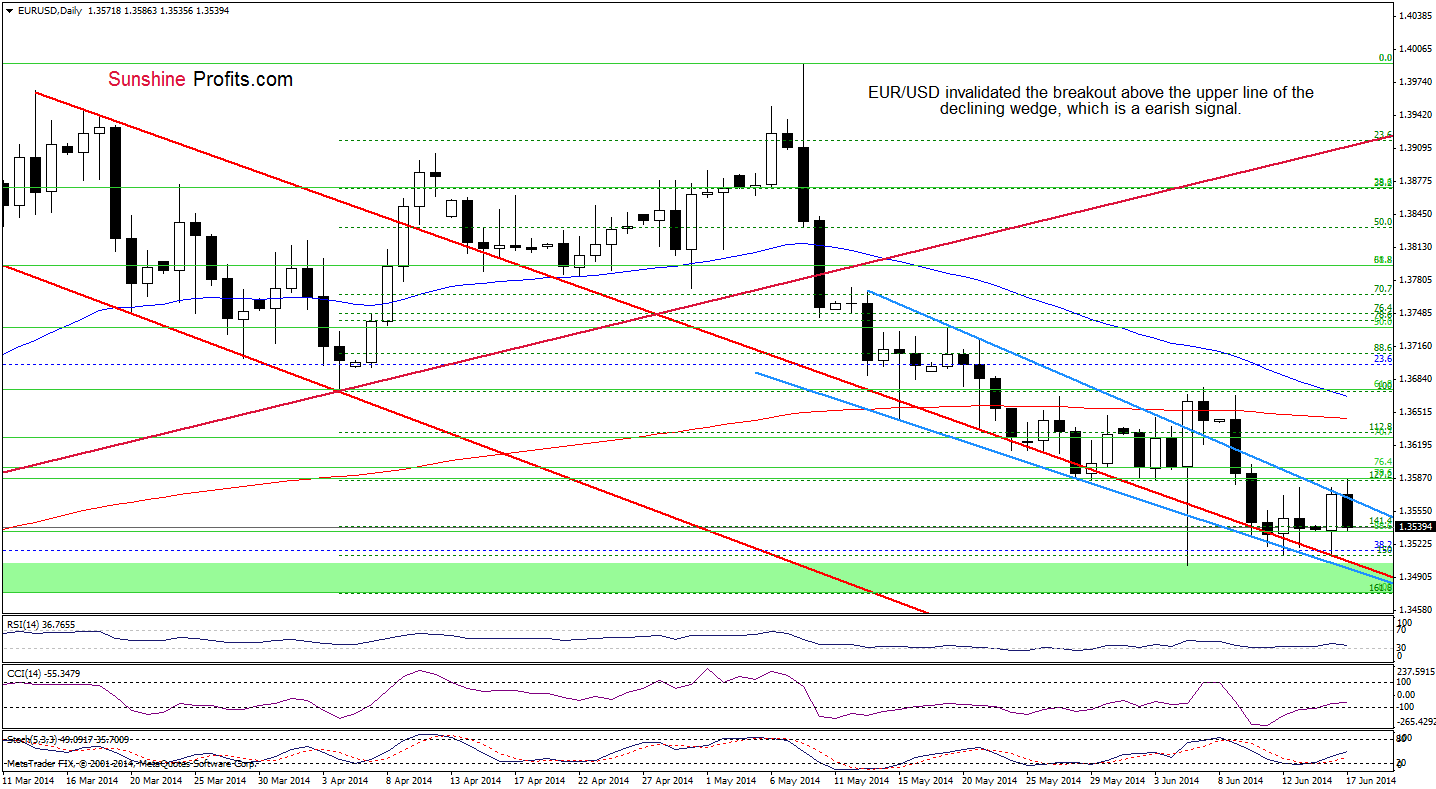
Looking at the above chart, we see that although the exchange rate broke above the upper blue line, currency bulls didn’t manage to hold gained levels. As a result, EUR/USD reversed, invalidating earlier breakout. This strong bearish signal triggered a sharp decline, which took the pair to the 88.6% Fibonacci retracement and the 141.4% Fibonacci extension once again. As you see on the above chart, in the previous week we noticed several drops below this support area, therefore, we think that if history repeats itself once again, we’ll see similar price action in the coming day (or days). If this is the case, and the exchange rate declines from here, we’ll see a re-test of the strength of the strong support zone created by the lower border of the declining wedge (marked with blue) and the upper line of the declining trend channel (marked with red). Nevertheless, we should keep in mind that buy signals generated by the indicators remain in place, which suggests that another attempt to move higher can’t be ruled out.
Very short-term outlook: mixed
Short-term outlook: bearish
MT outlook: bearish
LT outlook: bearish
Trading position (short-term; our opinion): In our opinion no positions are justified from the risk/reward perspective. We will keep you informed should anything change, or should we see a confirmation/invalidation of the above.
GBP/USD
On Friday, we wrote the following:
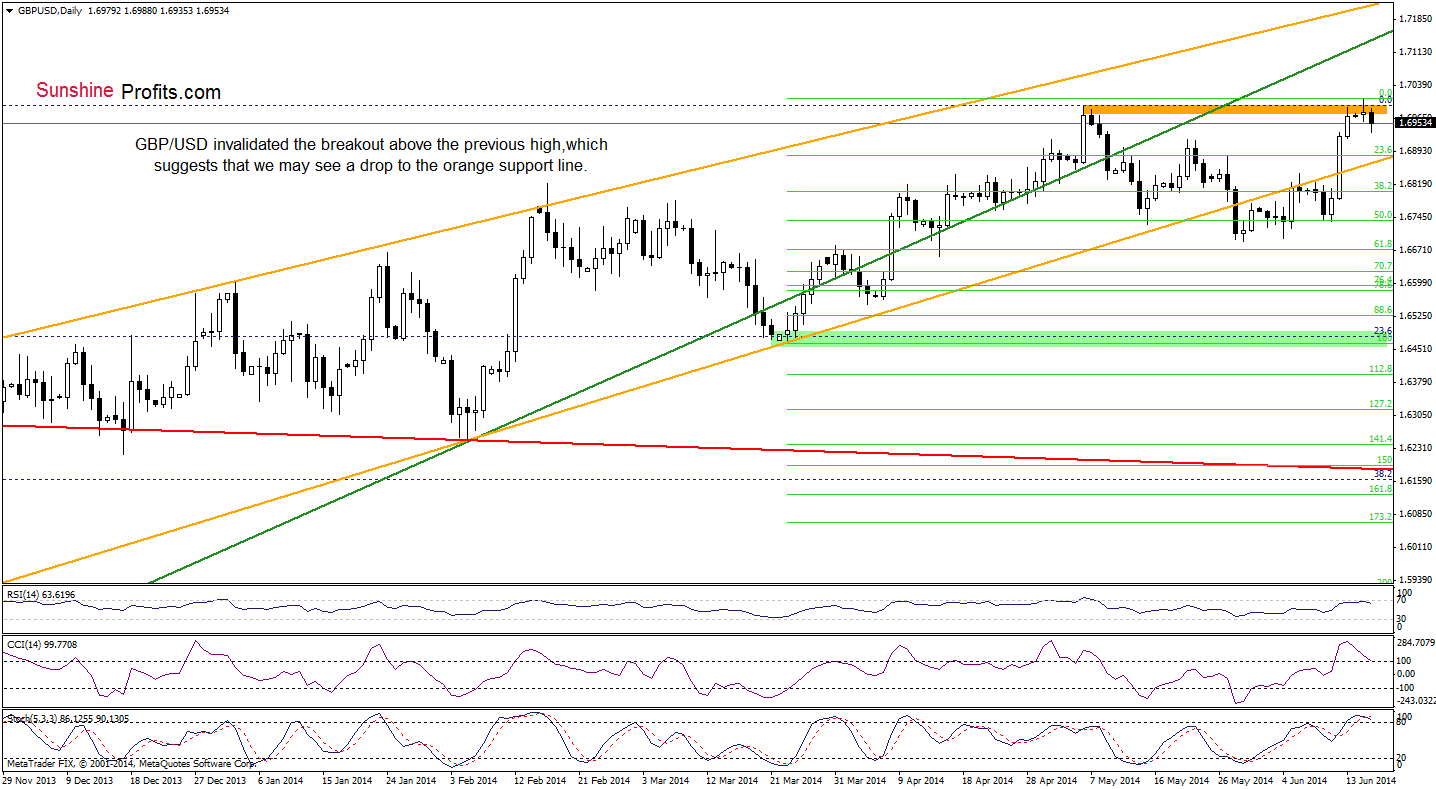
(…) an upswing (…) took the exchange rate to the May high. (…) if this resistance holds, we’ll see a pullback from here and the first downside target will be the orange line (currently at 1.6847). (…) Please note that the RSI and CCI reached their highest levels since the beginning of May. Back then such high readings of the indicators preceded the recent decline. Therefore, if history repeats itself, we may see a similar drop in the coming days.
Looking at the daily chart, we see that although GBP/USD climbed above the previous 2014 high, the pair reversed, invalidating the breakout. This strong bearish sign triggered a pullback, which suggests that we will likely see further deterioration in the coming day (or days) and the first downside target will be the above-mentioned orange support line (currently at 1.6860). Additionally, the RSI declined from the level of 67, while the CCI and Stochastic Oscillator generated sell signals, which supports the bearish case at the moment.
Very short-term outlook: bearish
Short-term outlook: mixed with bearish bias
MT outlook: bearish
LT outlook: mixed
Trading position (short-term): In our opinion, no positions are justified from the risk/reward perspective. We will keep you informed should anything change, or should we see a confirmation/invalidation of the above.
AUD/USD
The situation in the medium term has deteriorated as AUD/USD still declined, moving away from the previously-broken green resistance line. Therefore, what we wrote yesterday is still valid:
(…) we are convinced that if this major resistance encourages forex traders to push the sell button, we’ll see a pulback and the downside target will be around 0.9228, where the June low is.
What can we infer from the short-term picture? Let’s check.
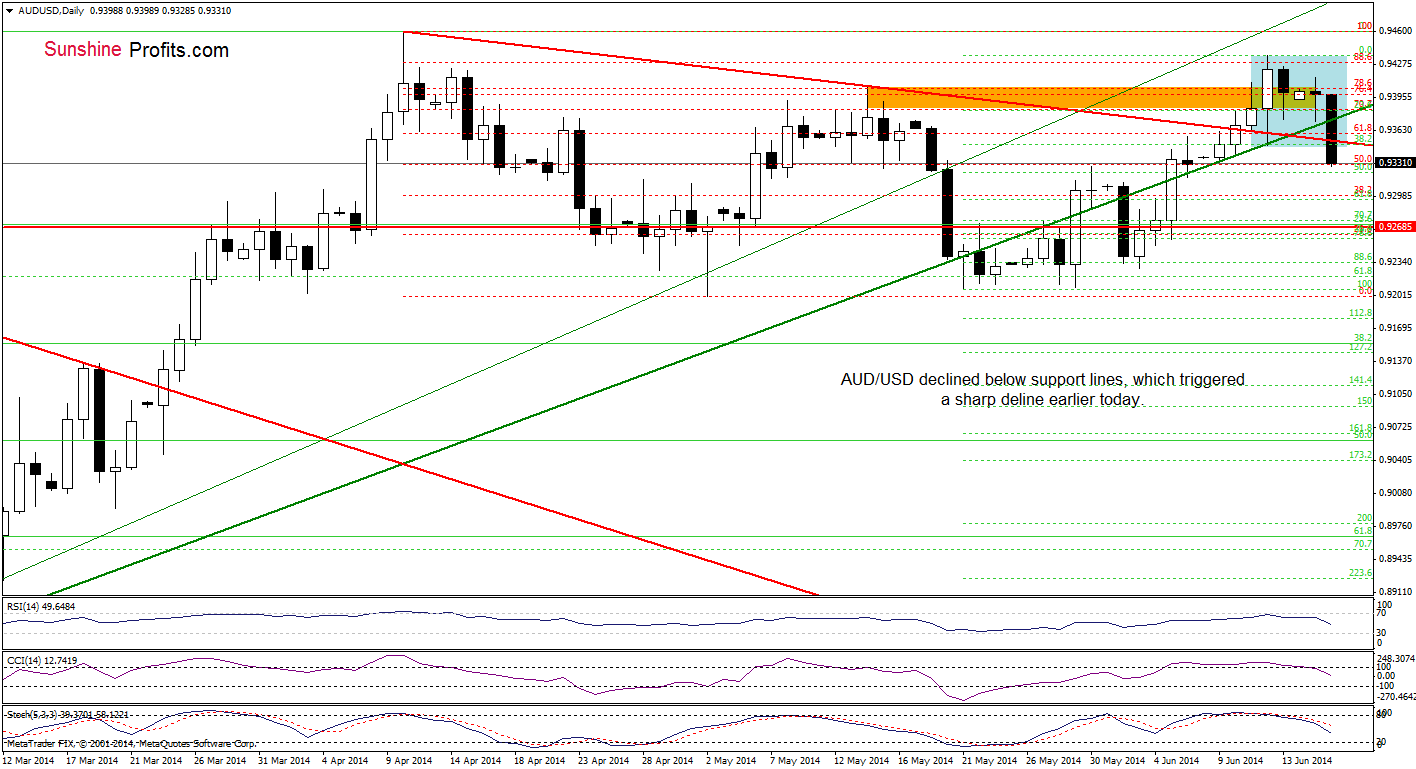
Quoting our last Forex Trading Alert:
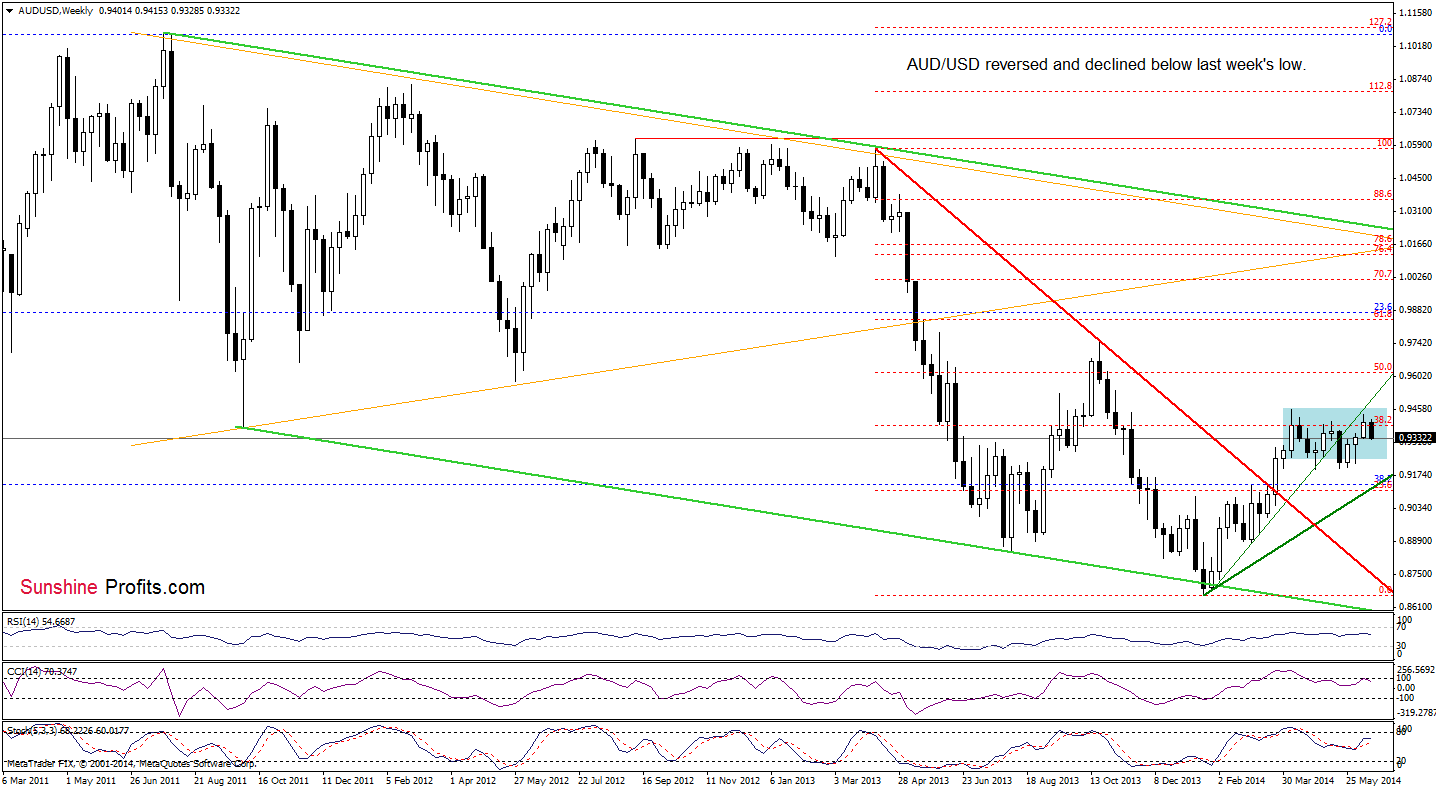
(…) AUD/USD is trading in a narrow range between the resistance zone created by the 76.4% and the 78.6% Fibonacci retracement levels and the support zone based on the red declining support line and the medium-term green line (…) if the exchange rate breaks below them, the correction will accelerate and we’ll see a drop to at least 0.9323, where the 50% Fibonacci retracement based on the entire recent rally is. Please note that the position of the indicators supports the bearish case at the moment.
As you see on the above chart, currency bears almost realized the above-mentioned scenario as AUD/USD broke below both support lines and approached its downside target earlier today. If the 50% Fibonacci retracement withstand the selling pressure, we’ll see an attempt to comeback above the red and green lines. However, taking into account sell signals generated by the indicators, it seems to us that we’ll see further deterioration and the next downside target will be around 0.9295, where the 61.8% Fibonacci retracement is.
Very short-term outlook: bearish
Short-term outlook: mixed with bearish bias
MT outlook: bearish
LT outlook: bearish
Trading position (short-term; our opinion): In our opinion, short positions with 0.9403 as a stop-loss order are justified from the risk/reward perspective. We will keep you informed should anything change, or should we see a confirmation/invalidation of the above.
Thank you.
Nadia Simmons
Forex & Oil Trading Strategist
Przemyslaw Radomski, CFA
Founder, Editor-in-chief
Gold & Silver Trading Alerts
Forex Trading Alerts
Oil Investment Updates
Oil Trading Alerts

