
Earlier today, the Federal Reserve Bank of New York reported that manufacturing activity in the Empire state expanded more quickly than expected this month. Additionally, U.S. industrial production rose by a seasonally adjusted 0.6% last month, beating forecasts for a 0.5% gain. Despite these numbers, the greenback moved lower against the euro as concerns over the conflict in Iraq overweighed this positive news. In this way, the common currency climbed to its important upside target. Will we see a breakout in the near future?
In our opinion the following forex trading positions are justified - summary:
EUR/USD
Quoting our last commentary:
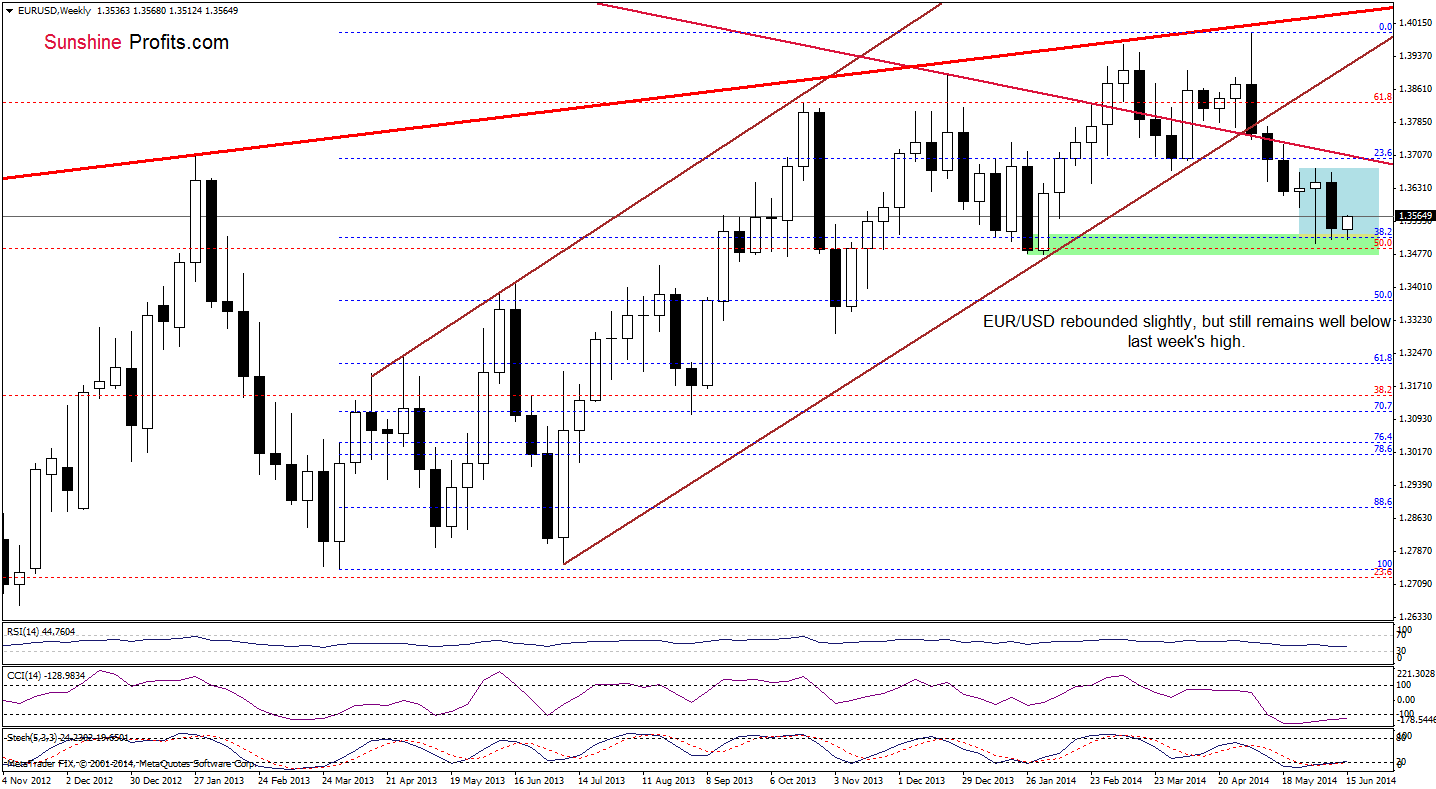
(…) EUR/USD still remains near the 38.2% Fibonacci retracement and last week’s low (…) slightly below these levels are also the Jan. and Feb. lows, which serve as an additional support. Therefore, we think that if this area holds, we’ll see another attempt to break above the major resistance line.
On the above chart, we see that although EUR/USD bounced off the above-mentioned support zone, the exchange rate remains in a consolidation (marked with blue), still well below last week’s high and long-term resistance line. Nevertheless, taking into account the current position of the indicators, it seems to us that the situation in the medium term will improve, if they generate buy signals and the pair breaks above the short-term resistance. Which one? Let’s take a closer look at the daily chart.
On Thursday, we wrote the following:
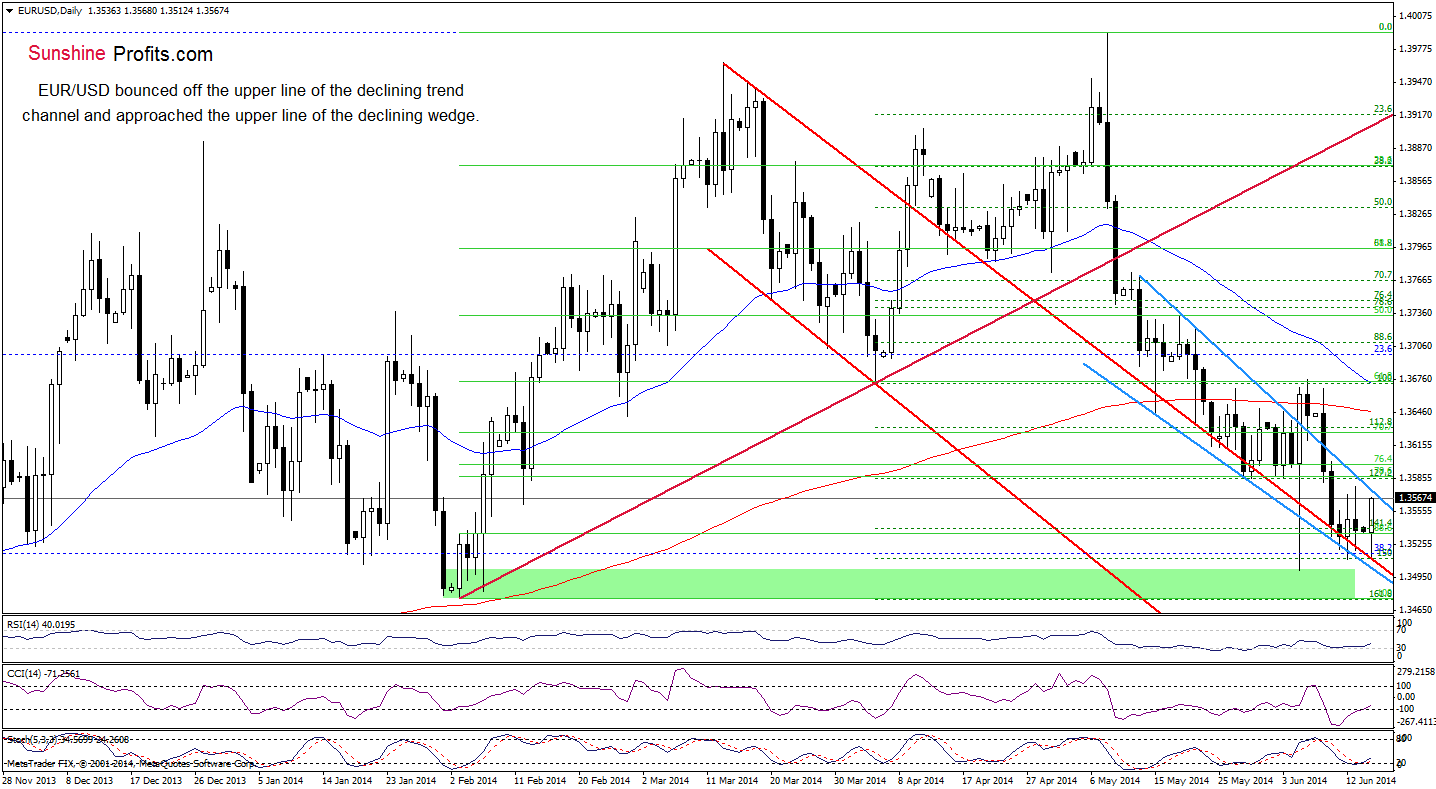
(…) the pair reversed and still remains above two important support lines: the lower border of the declining wedge (marked with blue) and the upper line of the declining trend channel (marked with red) (…) we think that if this support area withstands the selling pressure, the pair will rebound to the upper blue line.
Looking at the above chart, we see that the exchange rate bounced off the support zone and approached the above-mentioned upside target earlier today. Taking this fact into account, we should consider two scenarios. On one hand, if this resistance holds, we’ll see a pullback from here and the downside target for currency bears will be the nearest support zone. However, if EUR/USD climbs higher and doesn’t invalidate the breakout (just like in the first week of June), we’ll see further improvement and an increase to around 1.3647, where the 200-day moving average is.
Very short-term outlook: mixed
Short-term outlook: bearish
MT outlook: bearish
LT outlook: bearish
Trading position (short-term; our opinion): In our opinion no positions are justified from the risk/reward perspective. We will keep you informed should anything change, or should we see a confirmation/invalidation of the above.
USD/CHF
Quoting our Friday’s Forex Trading Alert :
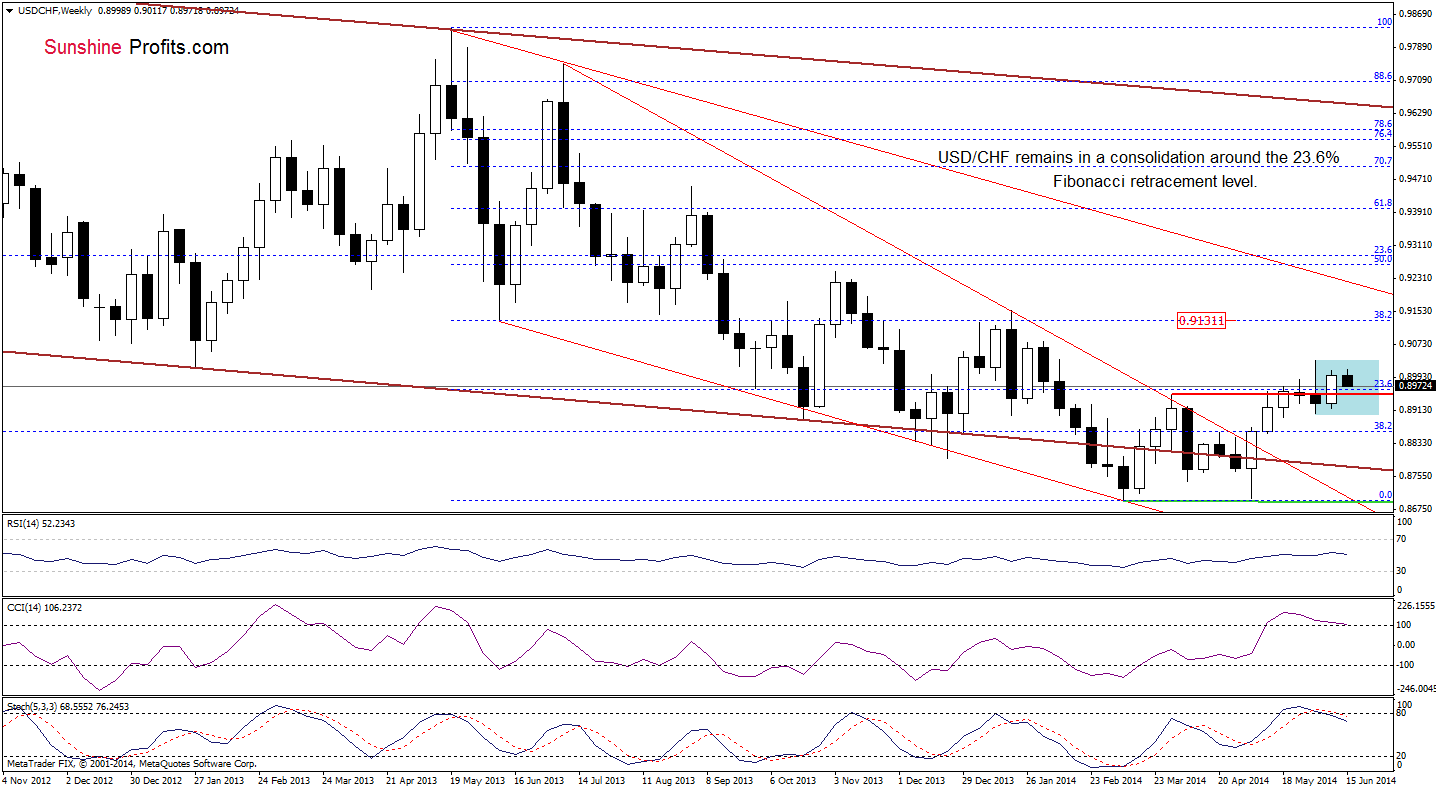
(…) USD/CHF invalidated the breakdown below the 23.6% Fibonacci retracement(…) which suggests further improvement and an increase to at least the June high. Nevertheless, we should keep in mind that the CCI and Stochastic Oscillator are not only overbought, but there are also negative divergences between them and the exchange rate, which indicates that correction is just around the corner.
From this prspective, we see that the exchange rate reversed and declined to around the 23.6% Fibonacci retracement. Additionally, the Stochastic Oscillator generated a sell signal, while the CCI is very close to doing it, which suggests that we’ll see further deterioration in the near future – especially if the pair declines below the April high. In this case, the initial downside targert, will be around 0.8907, where the lower border of a consolidation (marked with blue) is.
What is the short-term picture? Let’s check.
In our last Forex Trading Alert, we wrote the following:
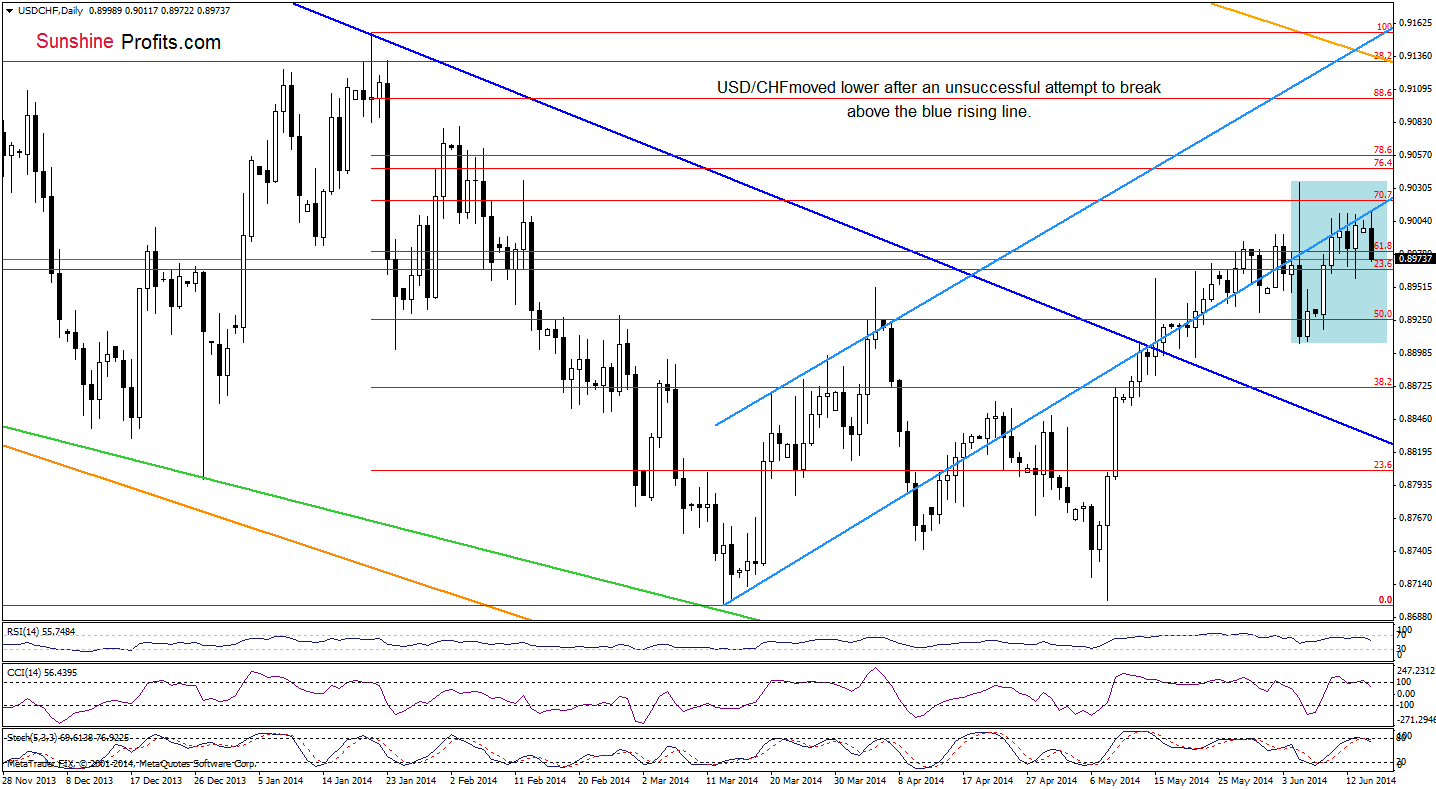
(…) the pair is still trading below the blue resistance line. In our opinion, as long as this line is in play another attempt to move lower can’t be ruled out – especially when we take into account the current position of the indicators (the CCI is overbought, Stochastic Oscillator reached the level of 80 and the RSI is at its highest level since the beginning of June). If this is the case, the downside target will be the lower border of the consolidation (around 0.8907).
Looking at the above chart, we see that the pair reversed and declined sharply after another unsuccessful attempt to break above the blue resistance line. Taking this bearish fact into account, it seems to us that we’ll see realization of the above-mentioned scenario in the coming days.
Very short-term outlook: bearish
Short-term outlook: mixed with bearish bias
MT outlook: mixed with bullish bias
LT outlook: bearish
Trading position (short-term): In our opinion no positions are justified from the risk/reward perspective. We will keep you informed should anything change, or should we see a confirmation/invalidation of the above.
AUD/USD
The situation in the medium term has’t changed much as AUD/USD still remains below the previously-broken green resistance line. Therefore, we are convinced that if this major resistance encourages forex traders to push the sell button, we’ll see a pulback and the downside target will be around 0.9228, where the June low is.
Will the short-term picture give us clues about future moves? Let’s check.
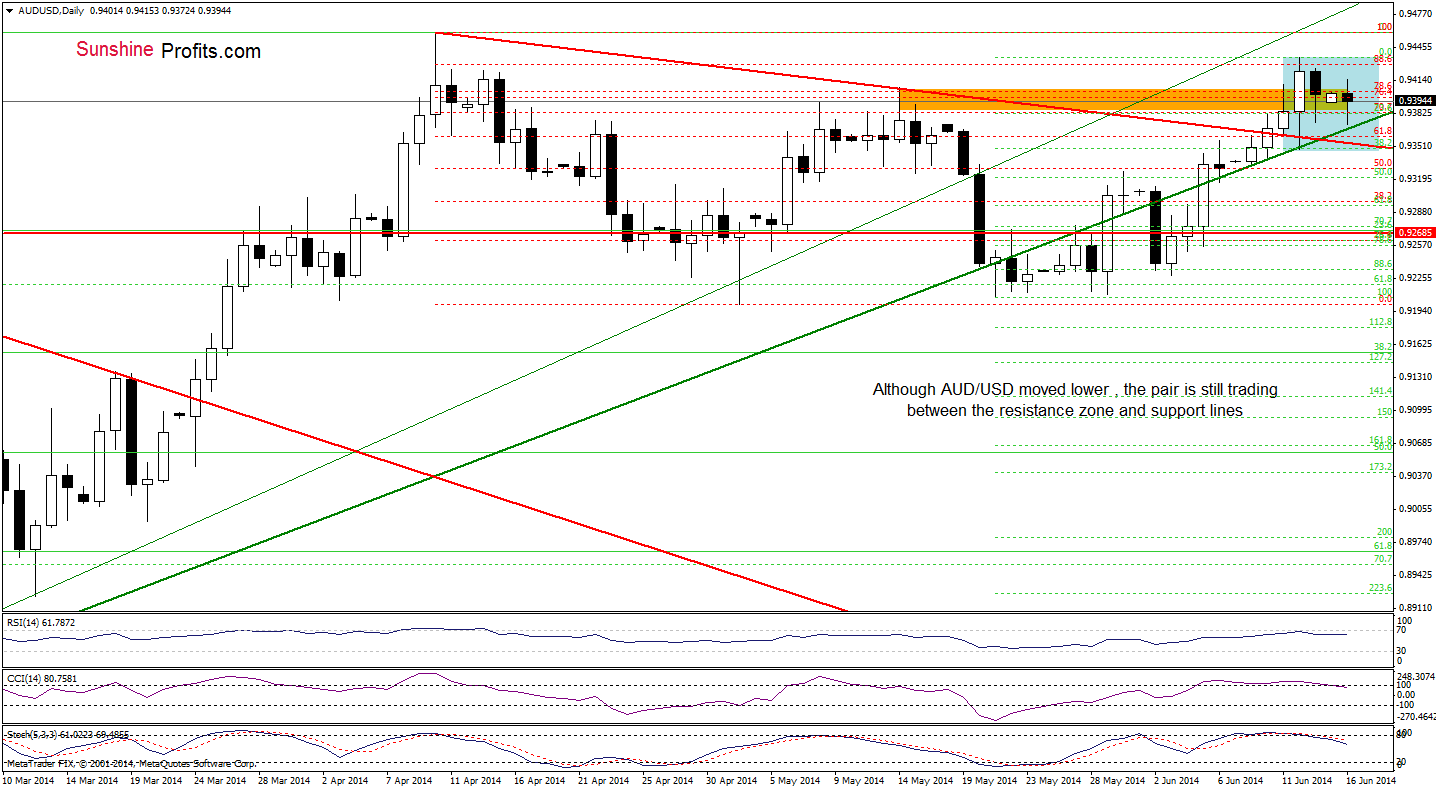
Looking at the above chart, we see that the situation hasn’t changed much as AUD/USD is trading in a narrow range between the resistance zone created by the 76.4% and the 78.6% Fibonacci retracement levels and the support zone based on the red declining support line and the medium-term green line. In our opinion, as long as the pair is trading above these lines, another attempt to move higher can’t be ruled out. However, if the exchange rate breaks below them, the correction will accelerate and we’ll see a drop to at least 0.9323, where the 50% Fibonacci retracement based on the entire recent rally is. Please note that the position of the indicators supports the bearish case at the moment.
Very short-term outlook: mixed with bearish bias
Short-term outlook: mixed with bearish bias
MT outlook: bearish
LT outlook: bearish
Trading position (short-term; our opinion): In our opinion no positions are justified from the risk/reward perspective at the moment. We will keep you informed should anything change, or should we see a confirmation/invalidation of the above.
Thank you.
Nadia Simmons
Forex & Oil Trading Strategist
Przemyslaw Radomski, CFA
Founder, Editor-in-chief
Gold & Silver Trading Alerts
Forex Trading Alerts
Oil Investment Updates
Oil Trading Alerts

