
Today, the U.S. currency moved higher against major currencies after official data showed that U.S. producer price inflation fell 0.2% in May, beating expectations for a 0.1% rise. Core producer price inflation (without food, energy and trade) slipped 0.1% last month, compared to expectations of 0.1% gain. As a result, EUR/USD declined to its major support lines, AUD/USD invalidated the breakout above the resistance zone, while USD/JPY erased all yesterday’s losses. How did these numbers influenced technical picture of other major currency pairs?
In our opinion the following forex trading positions are justified - summary:
EUR/USD
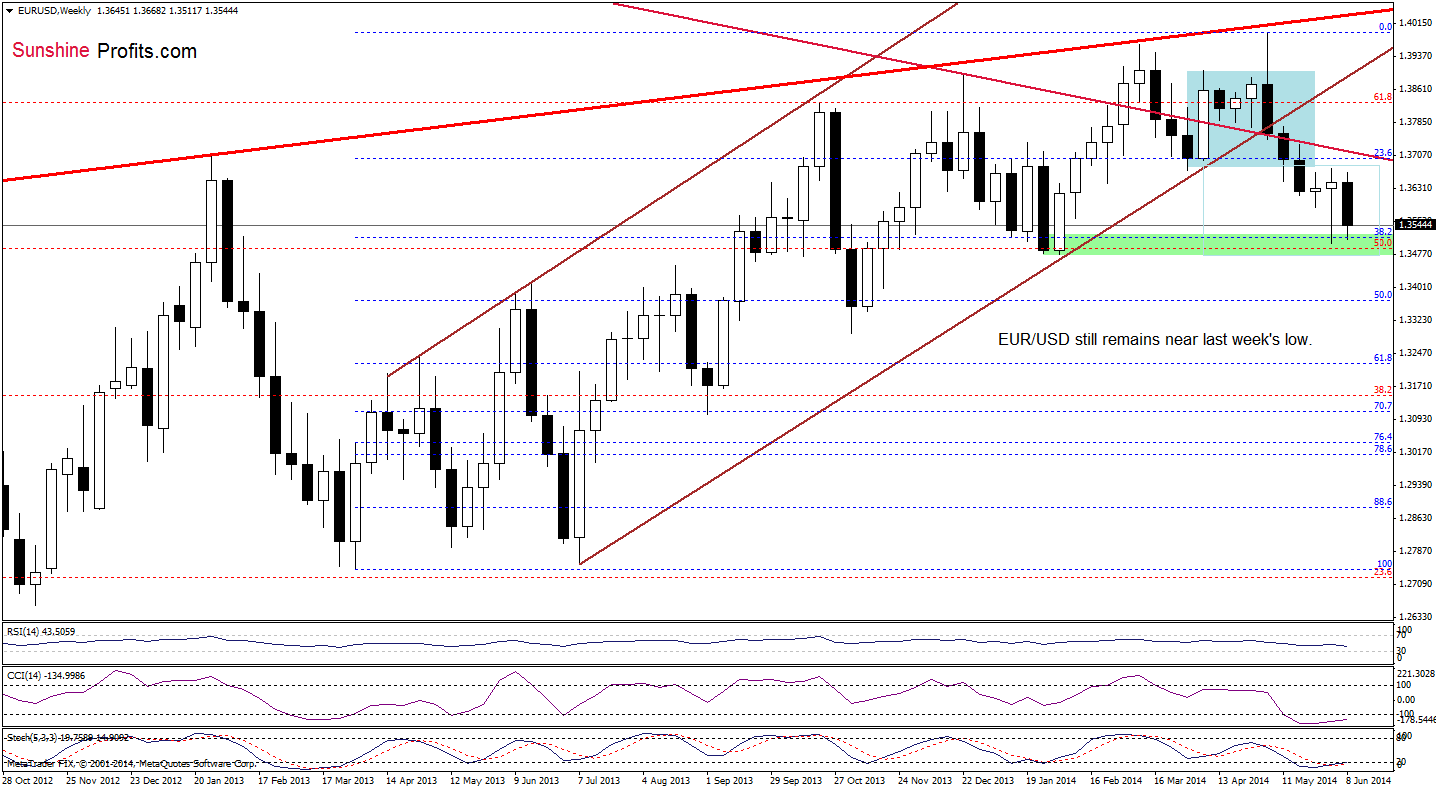
On the above chart, we see that the situation hasn’t changed much as EUR/USD still remains near the 38.2% Fibonacci retracement and last week’s low. Therefore, what we wrote yesterday remains up-to-date:
(…) it’s worth noting that slightly below these levels are also the Jan. and Feb. lows, which serve as an additional support. Therefore, we think that if this area holds, we’ll see another attempt to break above the major resistance line. However, if it is broken, the next downside target will be around 1.3367, where the 50% Fibonacci retracement is.
Once we know the above, let’s check the short-term changes.
Quoting our last Forex Trading Alert:
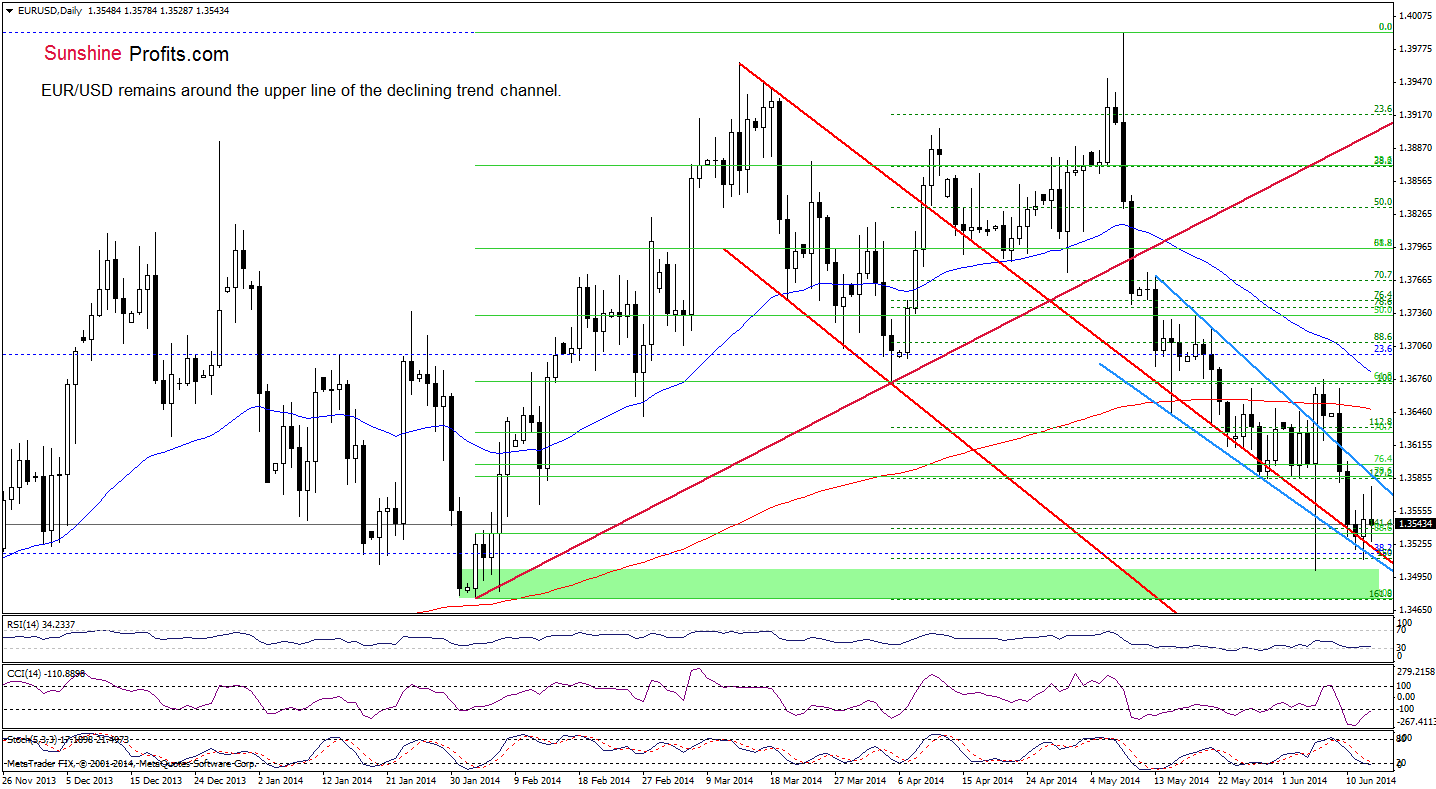
(…) the pair reversed and still remains above two important support lines: the lower border of the declining wedge (marked with blue) and the upper line of the declining trend channel (marked with red) (…) we think that if this support area withstands the selling pressure, the pair will rebound to the upper blue line.
Looking at the above chart, we see that currency bulls tried to realized the above-mentioned scenario earlier today, but they failed and the exchange rate reversed, declining to the major support lines. This is a bearish signal, but taking into account the current position of the indicators it seems to us that these lines will hold and we’ll see another attempt to break above the upper blue line (currently around 1.3587).
Very short-term outlook: mixed
Short-term outlook: bearish
MT outlook: bearish
LT outlook: bearish
Trading position (short-term; our opinion): In our opinion no positions are justified from the risk/reward perspective. We will keep you informed should anything change, or should we see a confirmation/invalidation of the above.
GBP/USD
In our last commentary on this currency pair, we wrote the following:
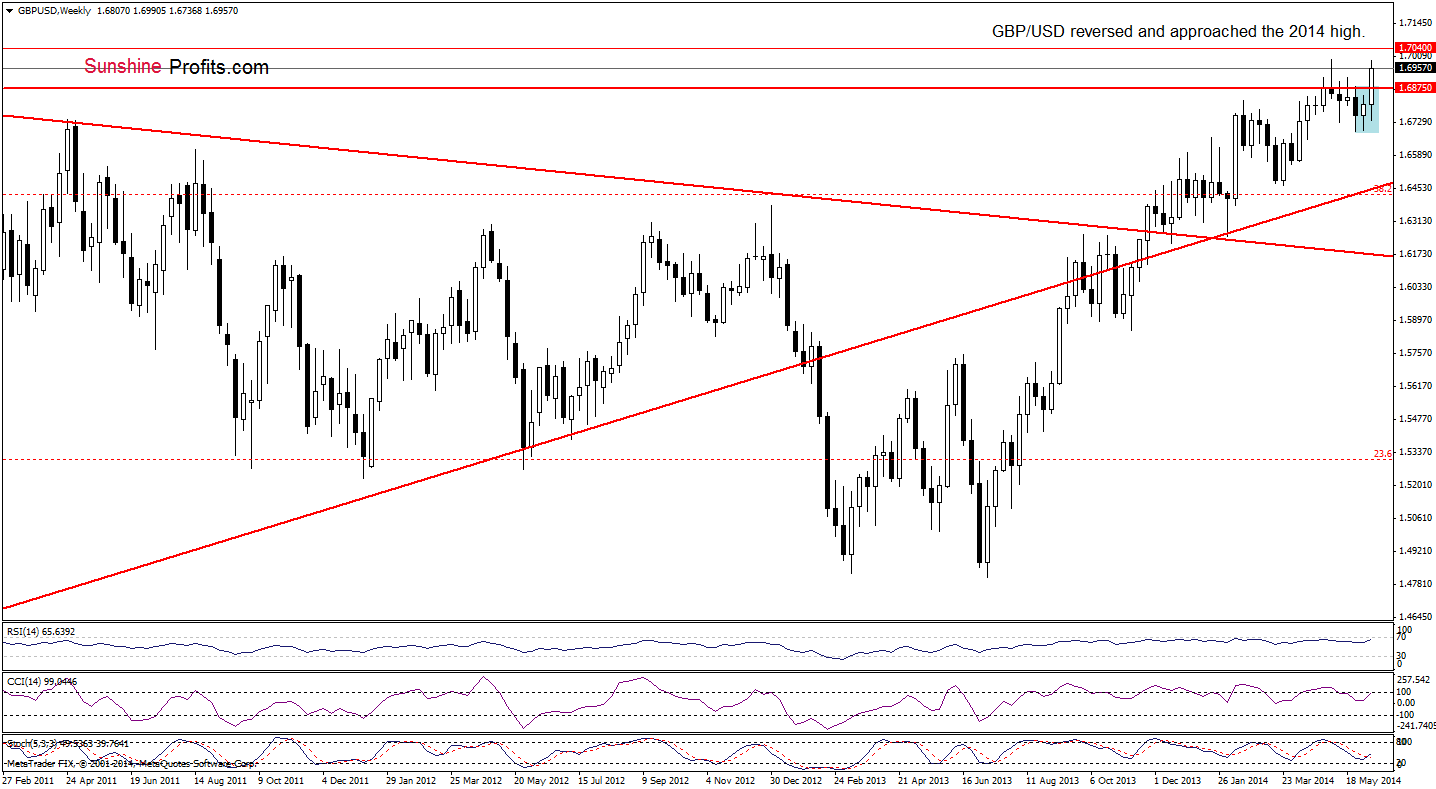
(…) GBP/USD remains in a consolidation below the resistance level created by the 2010 high. Taking this fact into account, it seems to us that as long as there is no breakout above the upper border of the formation (or a breakdown below 1.6691) another sizable move is not likely to be seen.
As you see on the weekly chart, the situation in the medium term has improved as GBP/USD broke above the upper border of the consolidation and rebounded sharply, approaching the 2014 high. Taking this fact into account, we should consider two scenarios. On one hand, if the resistance level based on the annual high holds, we’ll see a pullback from here and the first downside target will be the lower border of the consolidation at 1.6691. However, if currency bulls do not give up, we may see an increase to around 1.7040, where the 2009 high is.
Can we infer something more from the short-term picture?
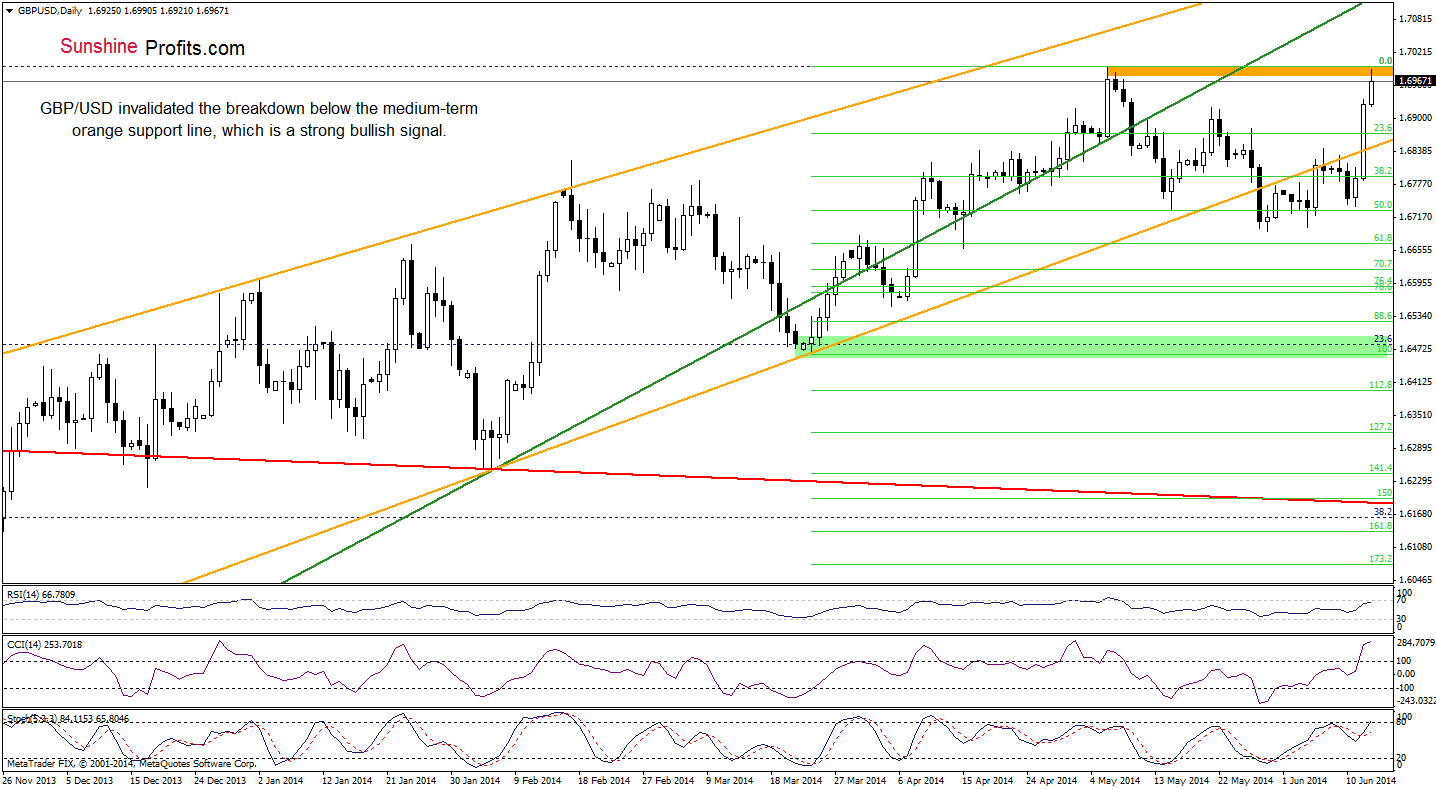
The first thing that catches the eye on the daily chart is an invalidation of the breakdown below the medium-term orange support/resistance line. This strong bullish sign triggered an upswing, which took the exchange rate to the May high. As we mentioned earlier, if this resistance holds, we’ll see a pullback from here and the first downside target will be the orange line (currently at 1.6847). On the other hand, if the pair moves higher, the initial upside target will be the 2009 high. Please note that the RSI and CCI reached their highest levels since the beginning of May. Back then such high readings of the indicators preceded the recent decline. Therefore, if history repeats itself, we may see a similar drop in the coming days.
Very short-term outlook: mixed
Short-term outlook: mixed
MT outlook: bearish
LT outlook: mixed
Trading position (short-term): In our opinion, no positions are justified from the risk/reward perspective. We will keep you informed should anything change, or should we see a confirmation/invalidation of the above.
USD/JPY
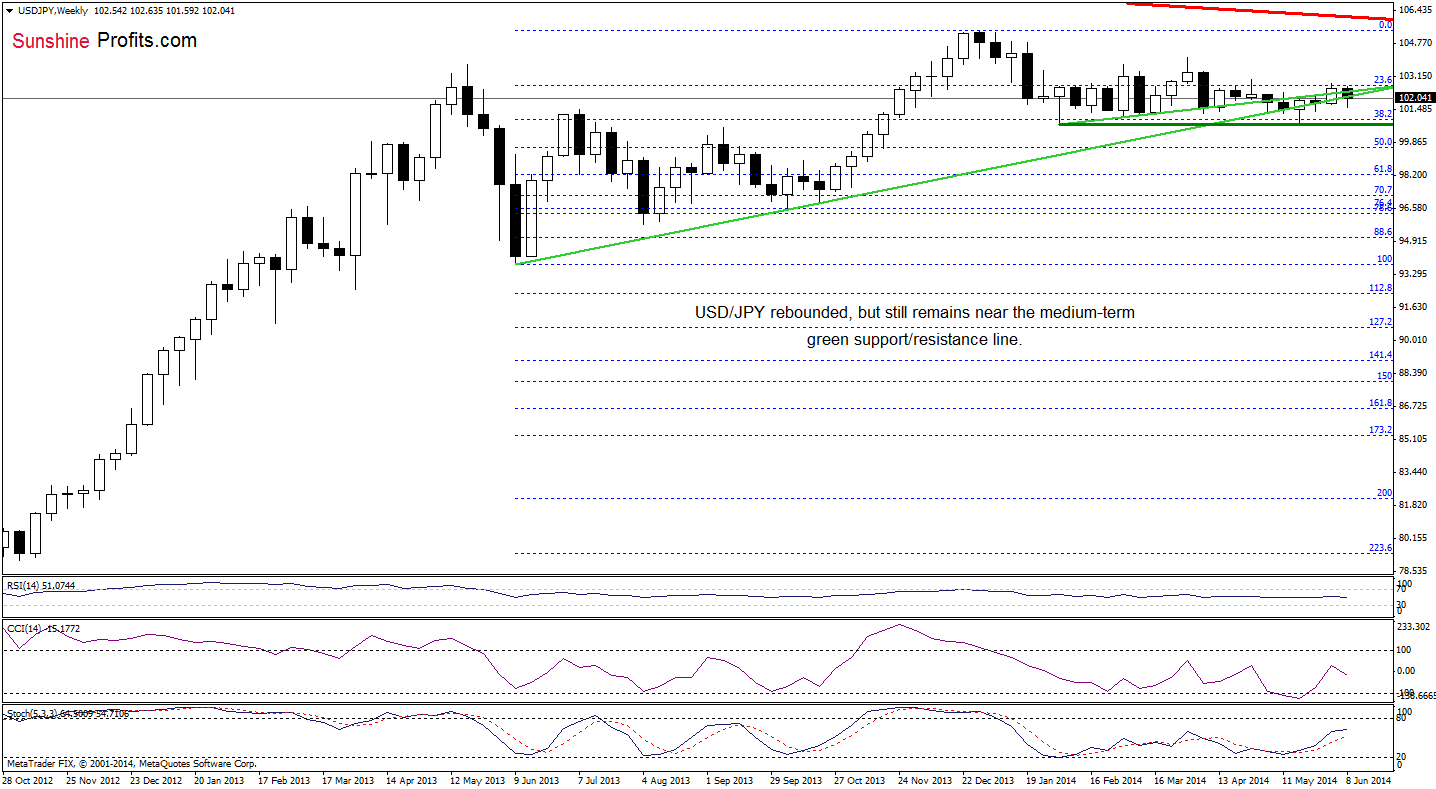
The situation on the weekly chart has deteriorated slightly as USD/JPY reversed and declined below the medium-term support line once again. Although the exchange rate rebounded, the pair is still trading around this major support/resistance line. If USD/JPY moves higher, it seems that the next upside target will be around 103, where the 50% Fibonacci retracement based on the entire decline is. However, if the exchange rate extends losses, we may see a decline even to the May low.
Let’s take a closer look at the short-term picture.
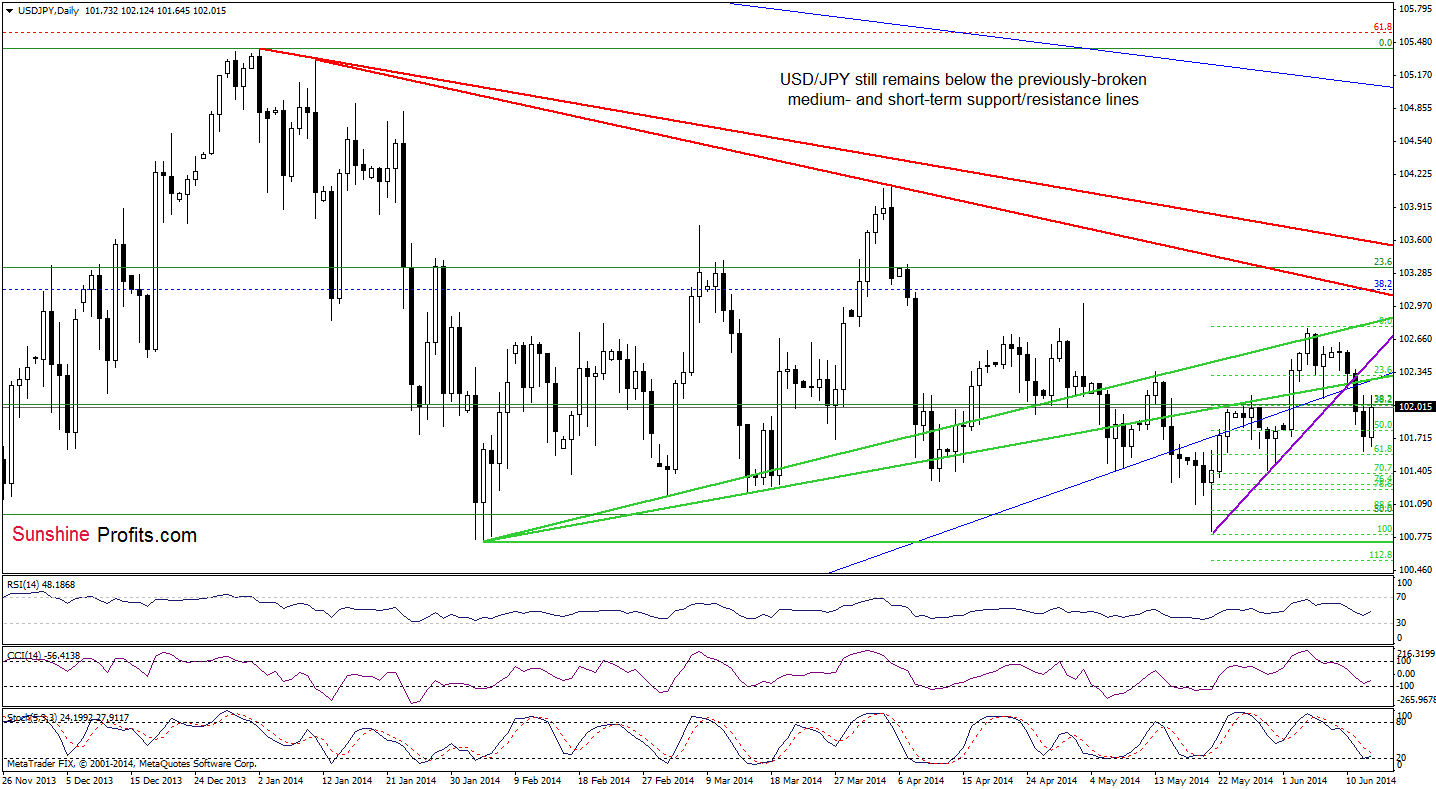
On the above chart, we see that USD/JPY extended declines and dropped to the 61.8% Fibonacci retracement based on the recent rally. This strong support encouraged forex traders to push the buy button and the pair rebounded. Despite today’s upswing, the exchange rate still remains below the previously-broken medium-term blue rising line and the lower green line. They serve as major resistance at the moment and it seems that as long as they remain in play, the space for further growth is limited. Please note that sell signals still support the bearish case, indicating that if USD/JPY declines below the 61.8% retracement, we’ll see further deterioration and a drop to the May 29 low (or even to the May low of 100.81).
Very short-term outlook: mixed with bearish bias
Short-term outlook: mixed
MT outlook: mixed
LT outlook: bearish
Trading position (short-term): In our opinion no positions are justified from the risk/reward perspective at the moment. We will keep you informed should anything change, or should we see a confirmation/invalidation of the above.
USD/CAD
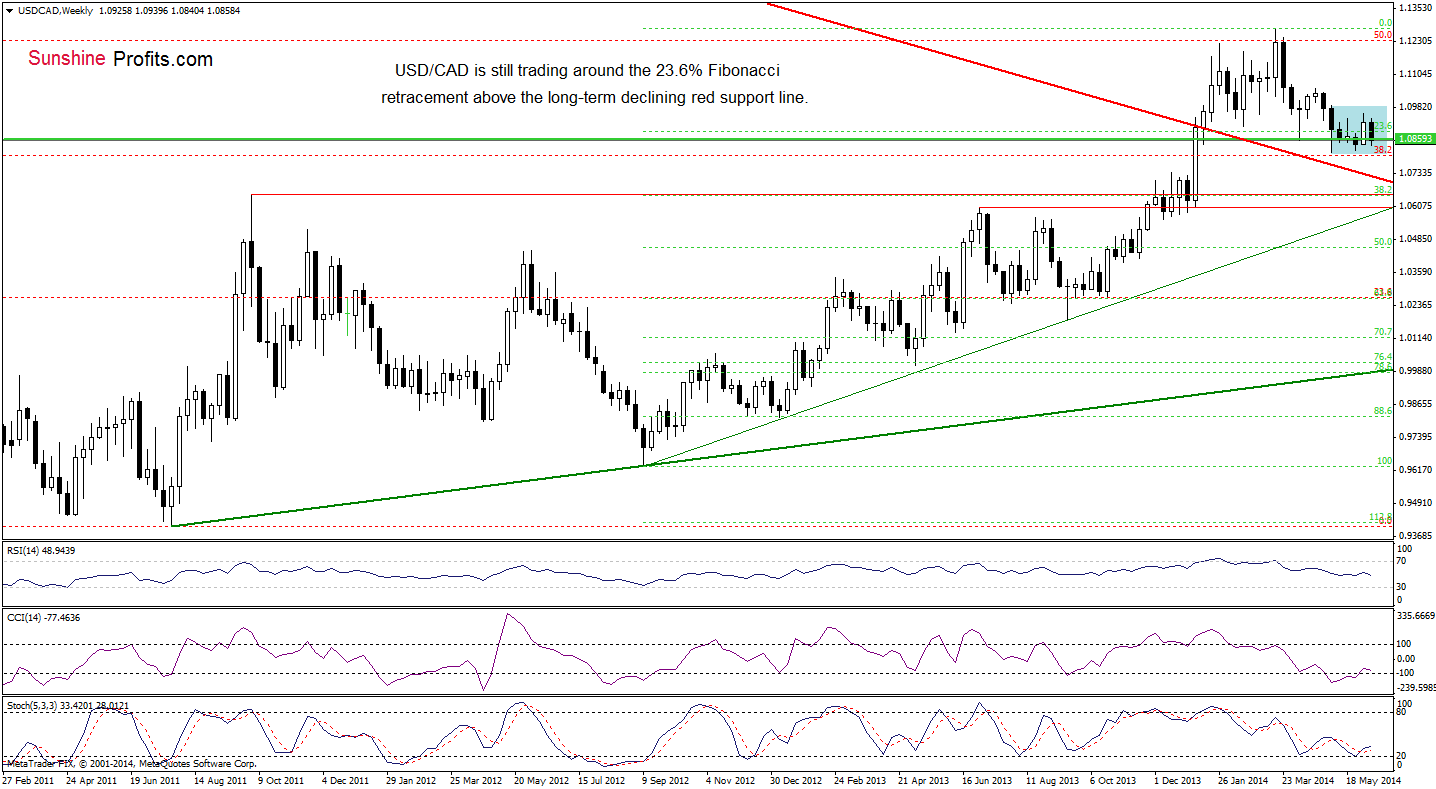
Although the exchange rate declined, the medium-term outlook hasn’t changed much as USD/CAD remains in a consolidation around the 23.6% Fibonacci retracement and the 2010 high. Therefore, it seems doubtful that we’ll see another sizable move before an earlier breakout above the upper line of the formation (or a breakdown below the lower line).
What can we infer from the daily chart?
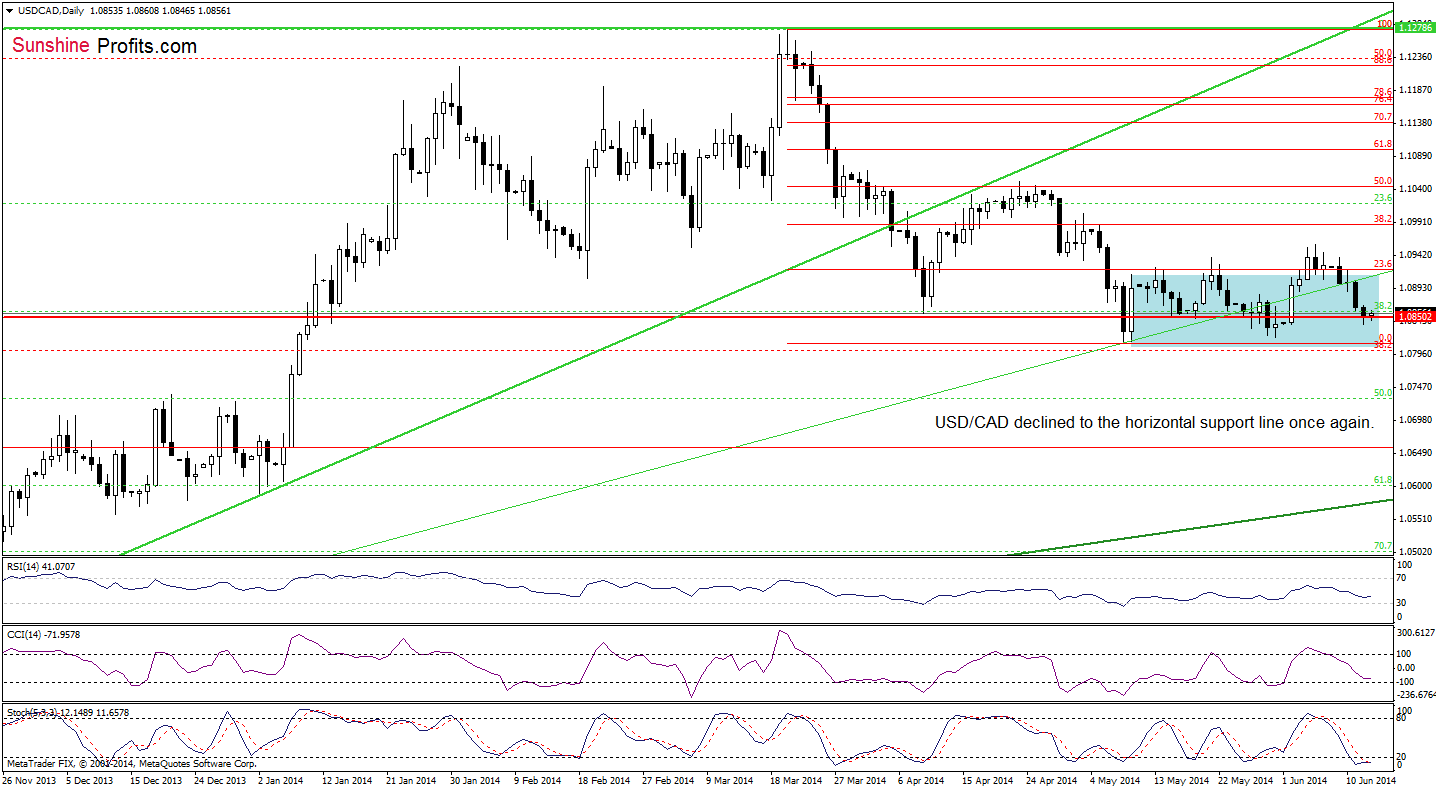
Looking at the above chart, we see that the exchange rate reversed and declined below the upper line of the consolidation. An invalidation of the breakout was a strong bearish signal that triggered further deterioration and a drop under the medium-term green support line. With this downswing, USD/CAD reached the horizontal red support line based on the 2010 high. If it holds, we’ll see another try to break above the upper border of the consolidation. However, if the pair moves lower, we’ll see a re-test of the strength of the lower line of this formation.
Very short-term outlook: mixed
Short-term outlook: mixed
MT outlook: mixed
LT outlook: bearish
Trading position (short-term): In our opinion no positions are justified from the risk/reward perspective as the space for further declines may be limited. We will keep you informed should anything change, or should we see a confirmation/invalidation of the above.
USD/CHF
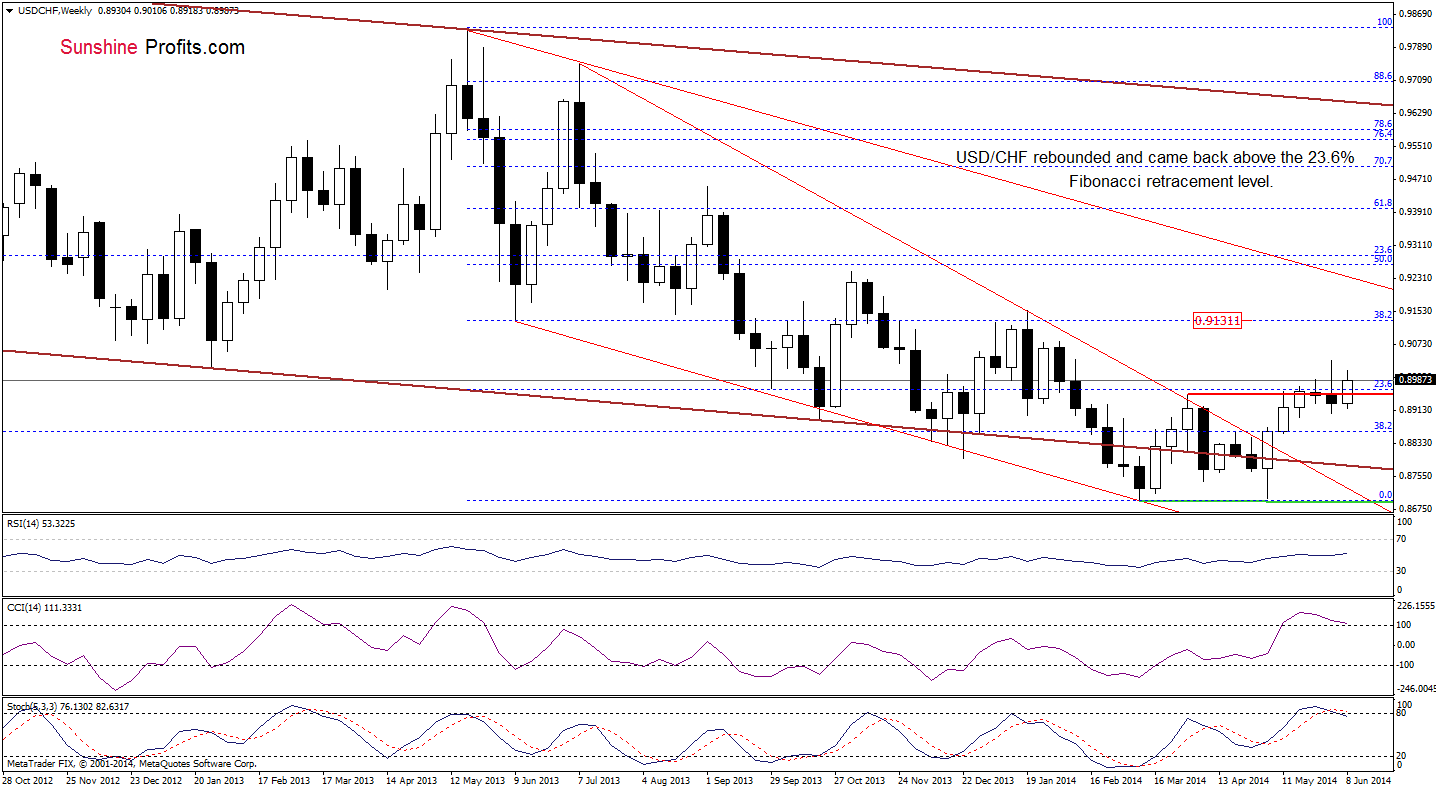
From the weekly perspective, we see that the situation in the medium term has improved as USD/CHF invalidated the breakdown below the 23.6% Fibonacci retracement. An invalidation of the breakdown is a strong bullish signal, which suggests further improvement and an increase to at least the June high. Nevertheless, we should keep in mind that the CCI and Stochastic Oscillator are not only overbought, but there are also negative divergences between them and the exchange rate, which indicates that correction is just around the corner.
What is the short-term picture? Let’s check.
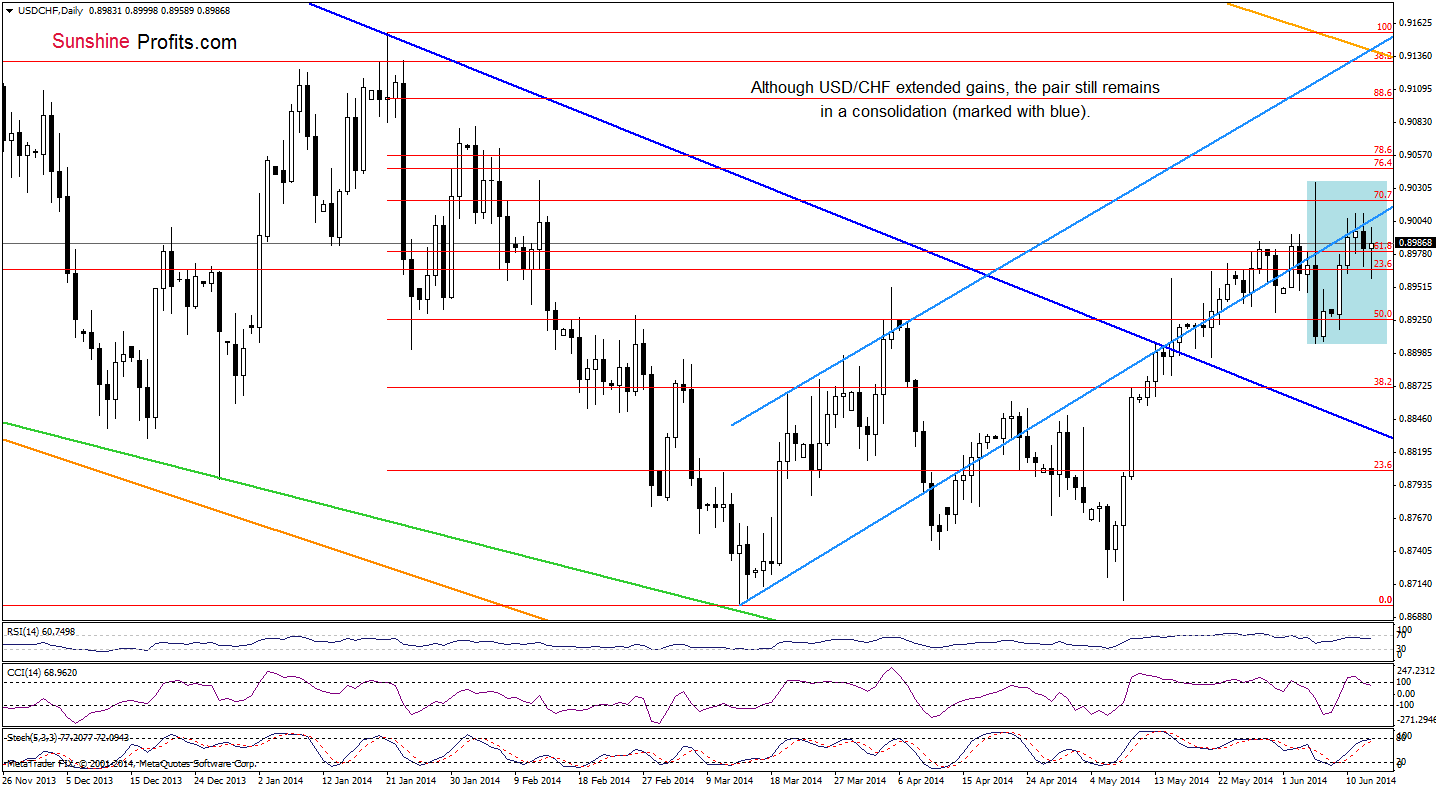
As you see on the above chart, although USD/CHF moved higher since our last commentary on this currency pair was posted, the exchange rate still remains in a consolidation between the June 5 high and low. Additionally, the pair is still trading below the blue resistance line. In our opinion, as long as this line is in play another attempt to move lower can’t be ruled out – especially when we take into account the current position of the indicators (the CCI is overbought, Stochastic Oscillator reached the level of 80 and the RSI is at its highest level since the beginning of June). If this is the case, the downside target will be the lower border of the consolidation (around 0.8907). However, if the pair climbs above this key resistance line, the upside target will be around 0.9035, where the upper line of the formation is.
Very short-term outlook: mixed
Short-term outlook: mixed with bearish bias
MT outlook: mixed with bullish bias
LT outlook: bearish
Trading position (short-term): In our opinion no positions are justified from the risk/reward perspective. We will keep you informed should anything change, or should we see a confirmation/invalidation of the above.
AUD/USD
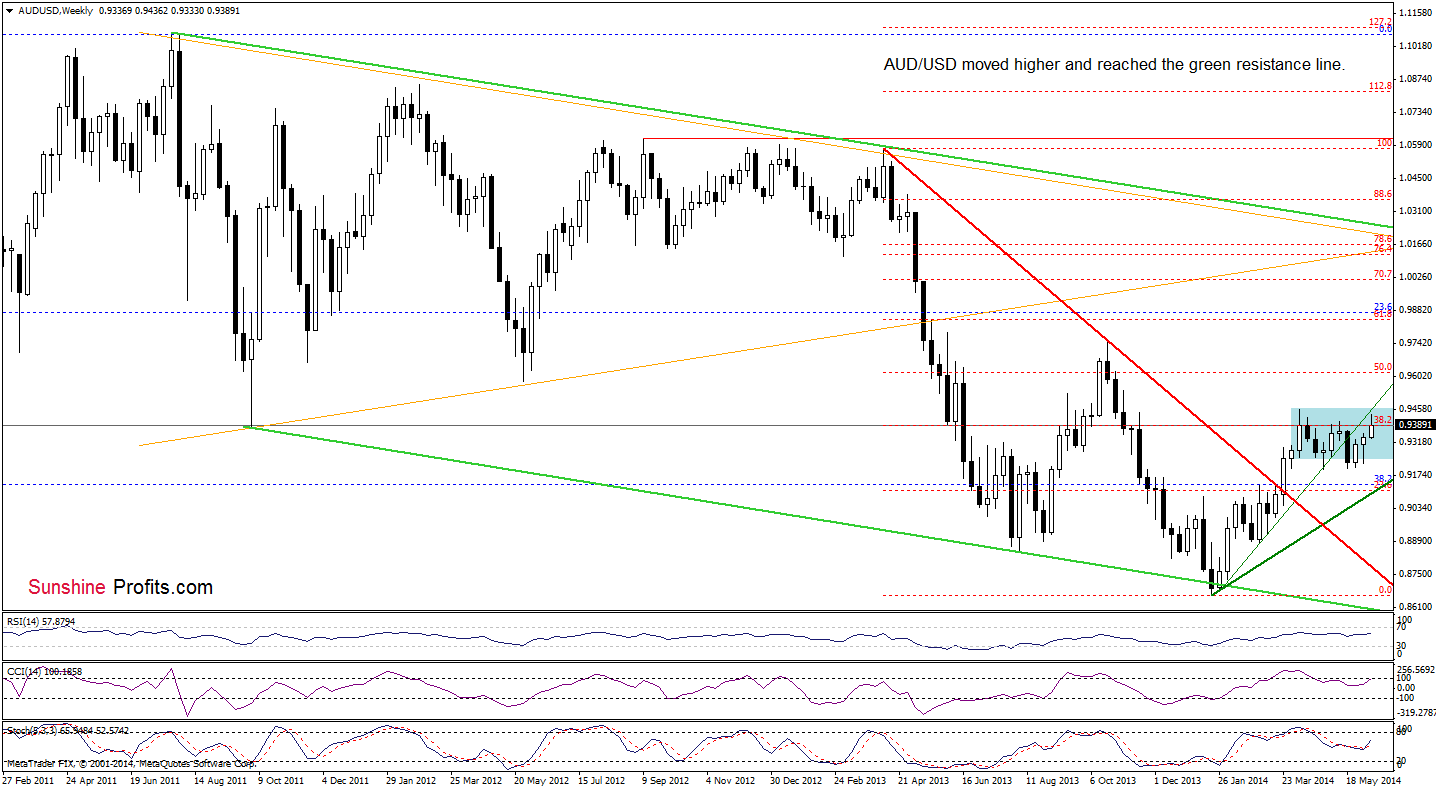
The situation in the medium term has improved as AUD/USD climbed above the 38.2% Fibonacci rettracement level based on the entire Apr.2013-Jan.2014 decline and approached the previously-broken green resistance line. As you see on the above chart, this major resistance still holds and if it encourages forex traders to push the sell button, we’ll see a pulback form here. If this case, the downside target will be around 0.9228, where the June low is. However, if currency bulls manage to push AUD/USD above this line, the initial upside target will be the 2014 high.
Having say that, let’s examine the daily chart.
Yesterday, we wrote the following:
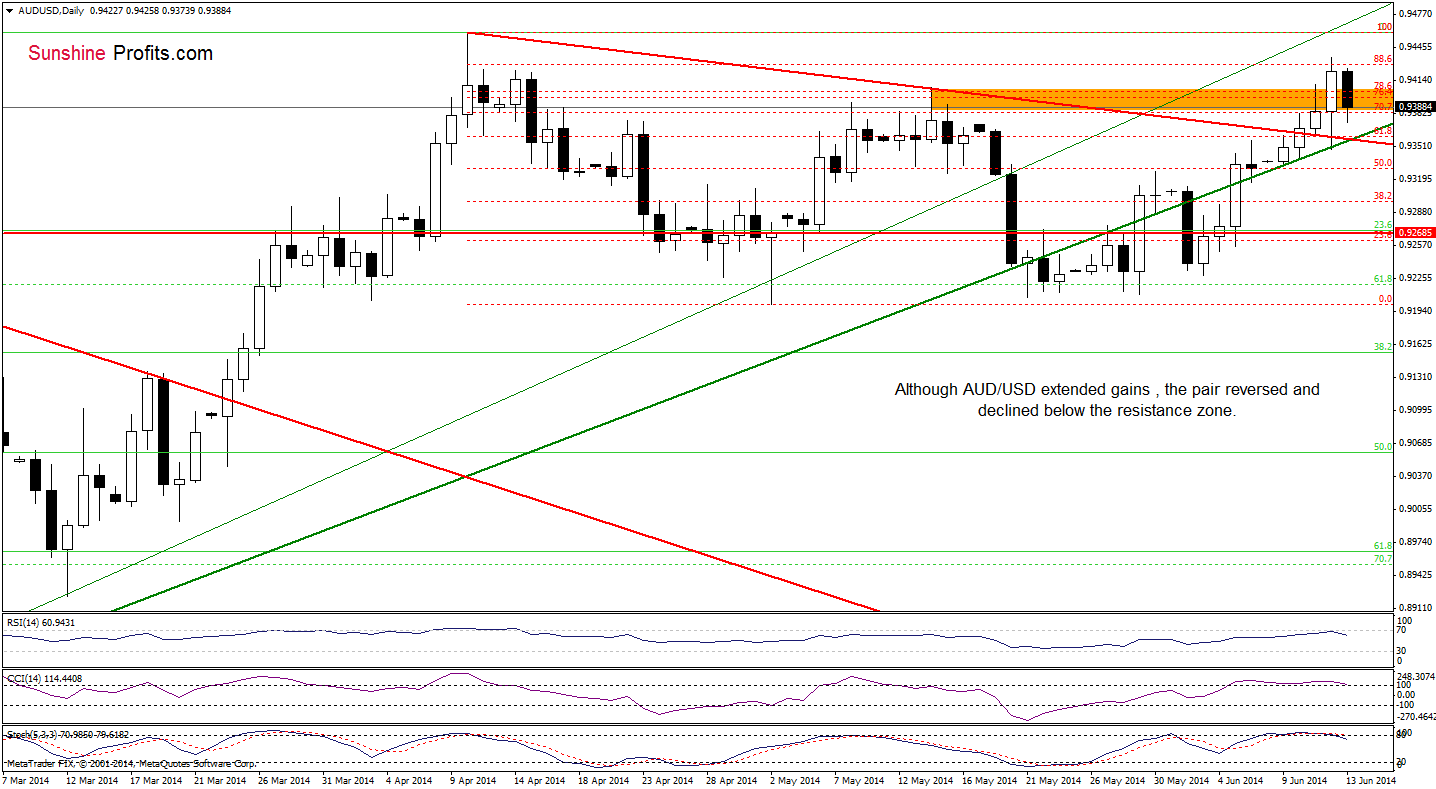
(…) In our opinion, the next upside target will be the 88.6% Fibonacci retracement (around 0.9430), which is slightly above the Apr.14 high. (…) Although the very short-term situation looks bullish at the moment, we should keep in mind that the RSI reached its highest level since mid-April, while the CCI and Stochastic Oscillator are overbought. Additionally, there are negative divergences between them and the exchange rate, which suggests that correction is just around the corner.
Looking at the above chart, we see that AUD/USD reversed and declined below the previously-broken resistance zone created by the 76.4% and the 78.6% Fibonacci retracement levels (based on the entire Apr.-May decline) and the May high, which is a bearish signal. If the exchange rate extends losses, the initial downside target will be the red declining support line, which intersects the medium-term green line at the moment. In our opinion, as long as the pair is trading above these lines, another attempt to move higher can’t be ruled out. However, if the exchange rate breaks below them, the correction will accelerate and we’ll see a drop to at least 0.9323, where the 50% Fibonacci retracement based on the entire recent rally is. Please note that the current position of the indicators supports the bearish case at the moment.
Very short-term outlook: mixed with bearish bias
Short-term outlook: mixed with bearish bias
MT outlook: bearish
LT outlook: bearish
Trading position (short-term; our opinion): In our opinion no positions are justified from the risk/reward perspective at the moment. We will keep you informed should anything change, or should we see a confirmation/invalidation of the above.
Thank you.
Nadia Simmons
Forex & Oil Trading Strategist
Przemyslaw Radomski, CFA
Founder, Editor-in-chief
Gold & Silver Trading Alerts
Forex Trading Alerts
Oil Investment Updates
Oil Trading Alerts

