
Official data showed that the number of employed people in Australia declined by 4,800 in the previous month, contrary to expectations of a 10,000 rise. Thanks to these disappointing numbers, the Australian dollar declined against its U.S. counterpart, reaching an important medium-term support. Later in the day, AUD/USD rebounded from here, supported by mixed U.S. economic data. As a result, the pair broke above the resistance zone, but is the situation as bullish as it seems at the first glance?
In our opinion the following forex trading positions are justified - summary:
EUR/USD
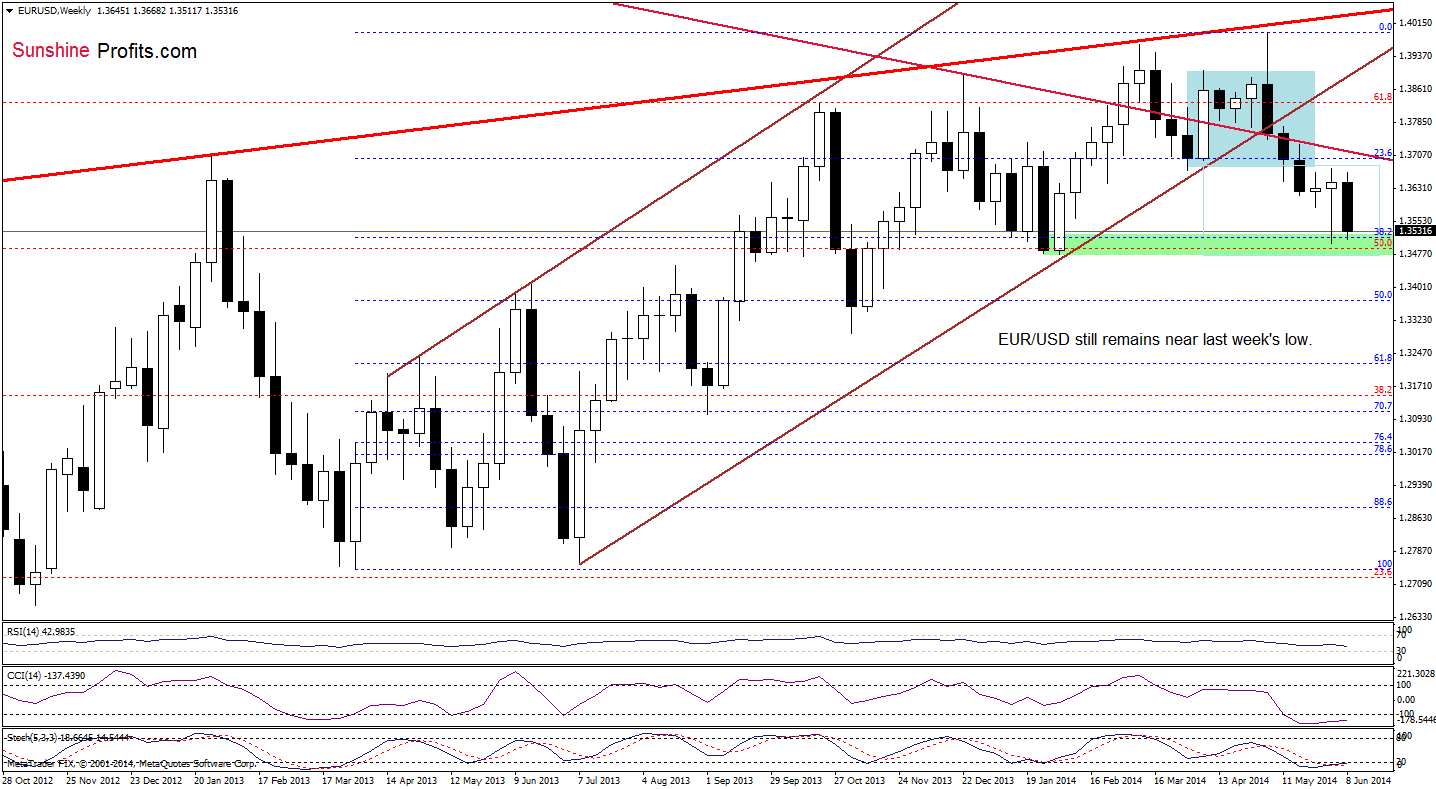
On the above chart, we see that the situation hasn’t changed much as EUR/USD still remains around the 38.2% Fibonacci retracement and last week’s low. Therefore, we believe that what we wrote yesterday remains up-to-date:
(…) it’s worth noting that slightly below these levels are also the Jan. and Feb. lows, which serve as an additional support. Therefore, we think that if this area holds, we’ll see another attempt to break above the major resistance line. However, if it is broken, the next downside target will be around 1.3367, where the 50% Fibonacci retracement is.
Once we know the above, let’s check the short-term changes.
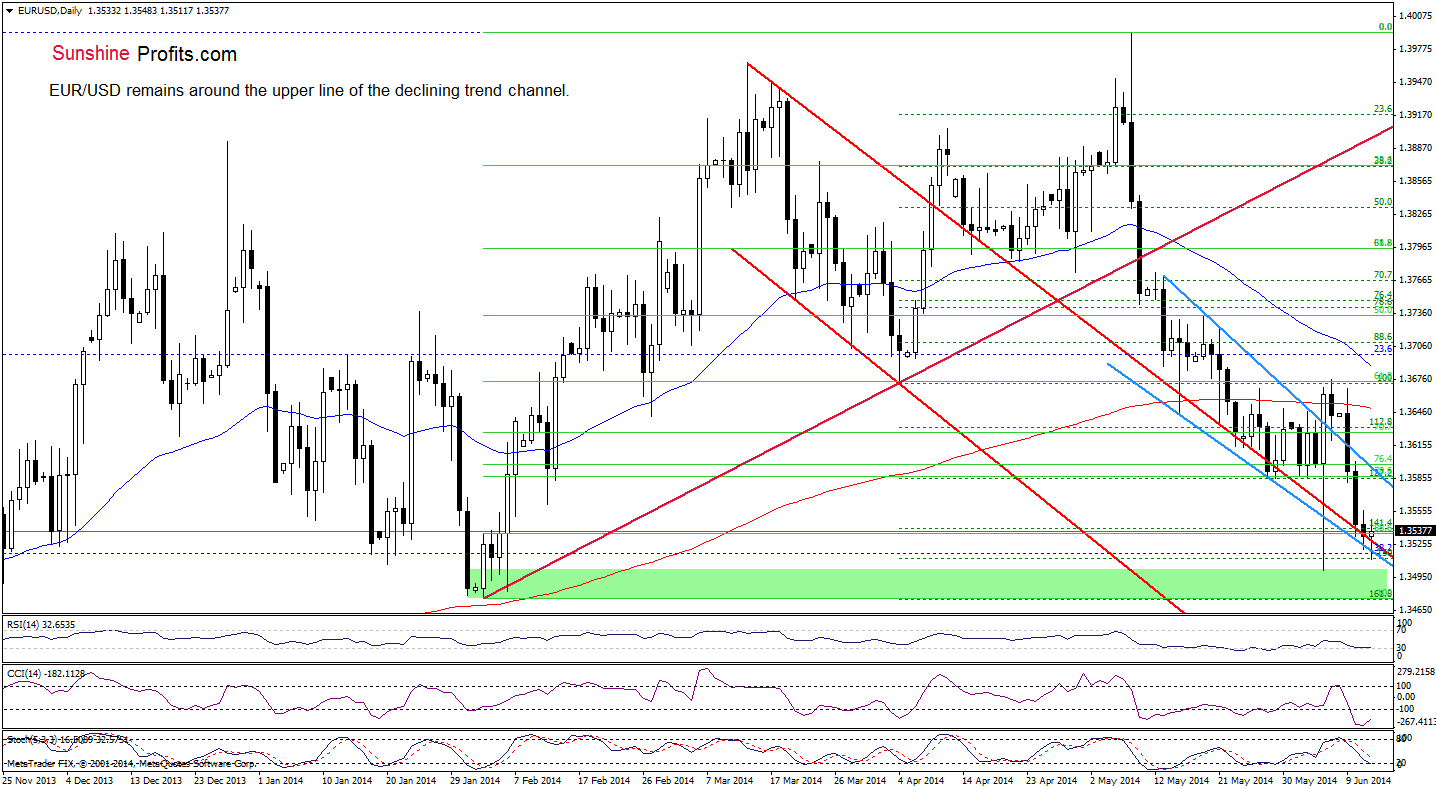
As you see on the daily chart, although EUR/USD moved lower once again, the pair reversed and still remains above two important support lines: the lower border of the declining wedge (marked with blue) and the upper line of the declining trend channel (marked with red). Taking this fact into account, we think that if this support area withstands the selling pressure, the pair will rebound to the upper blue line (currently around 1.3596). However, if it is broken, we may see a drop even to the Feb. low of 1.3476.
Very short-term outlook: mixed
Short-term outlook: bearish
MT outlook: bearish
LT outlook: bearish
Trading position (short-term; our opinion): In our opinion no positions are justified from the risk/reward perspective as the space for further declines may be limited. We will keep you informed should anything change, or should we see a confirmation/invalidation of the above.
USD/JPY
Today we’ll focus on the short-term changes.
Quoting our last commentary on this currency pair:
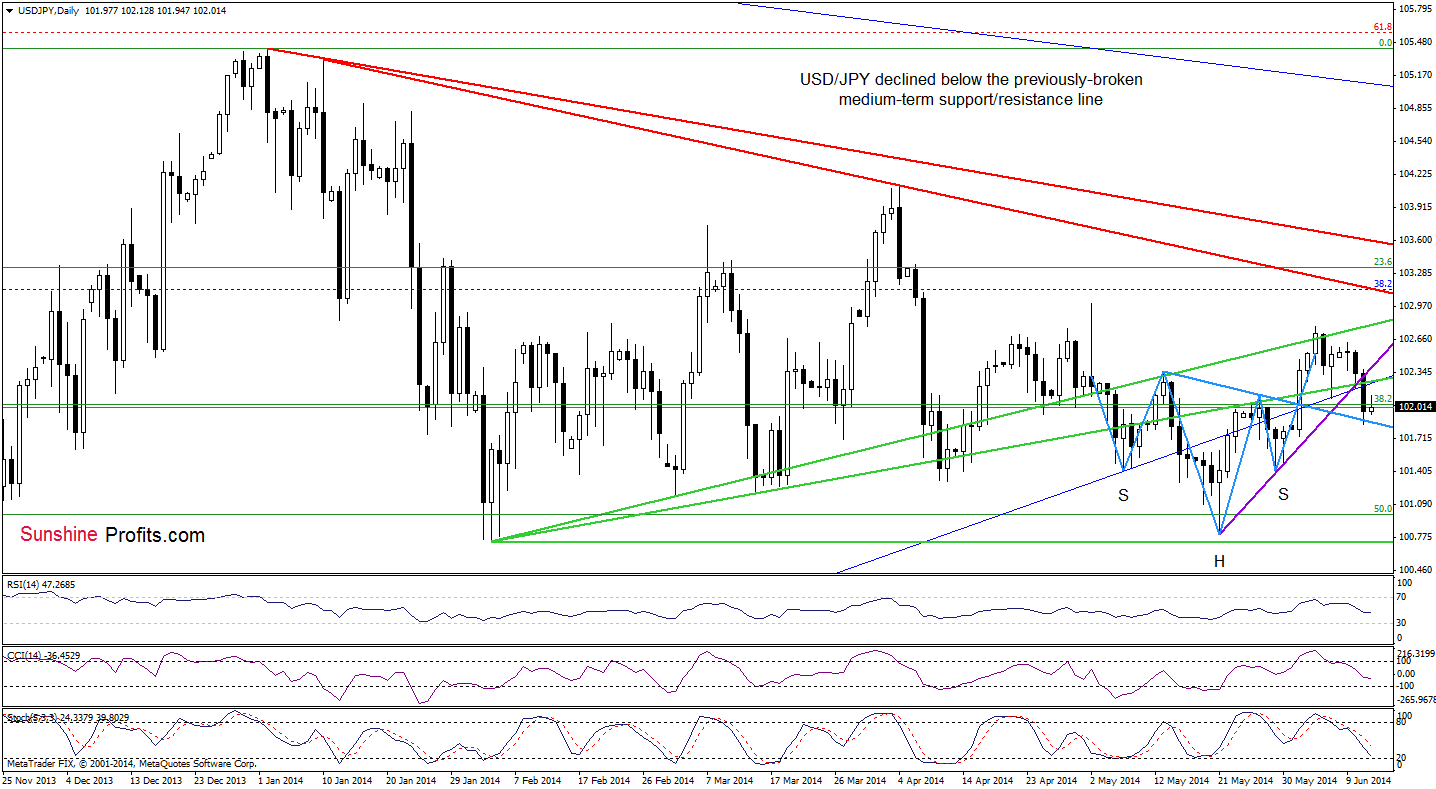
(…) USD/JPY extended losses and declined below the support zone created by the medium-term blue rising line and the previously-broken lower green line (…) the exchange rate also dropped below the support line based on the May 21 and May 29 lows (marked with purple), while sell signals generated by the CCI and Stochastic Oscillator remain in place. All the above provides us with bearish implications (…) Nevertheless, we should keep in mind that the neck line of the reverse head and shoulders pattern still holds, which may result in a corrective upswing to the previously-broken support zone.
As you see on the above chart, the exchange rate is still trading above the neck line of the reverse head and shoulders pattern, which suggests that another attempt to reach the medium-term blue rising line and the previously-broken lower green line can’t be ruled out. On the other hand, sell signals still support the bearish case, indicating that if USD/JPY declines below the major support, we’ll see further deterioration and a drop to the May 29 low (or even to the May low of 100.81).
Very short-term outlook: mixed with bearish bias
Short-term outlook: mixed
MT outlook: mixed
LT outlook: bearish
Trading position (short-term): In our opinion no positions are justified from the risk/reward perspective at the moment. We will keep you informed should anything change, or should we see a confirmation/invalidation of the above.
AUD/USD
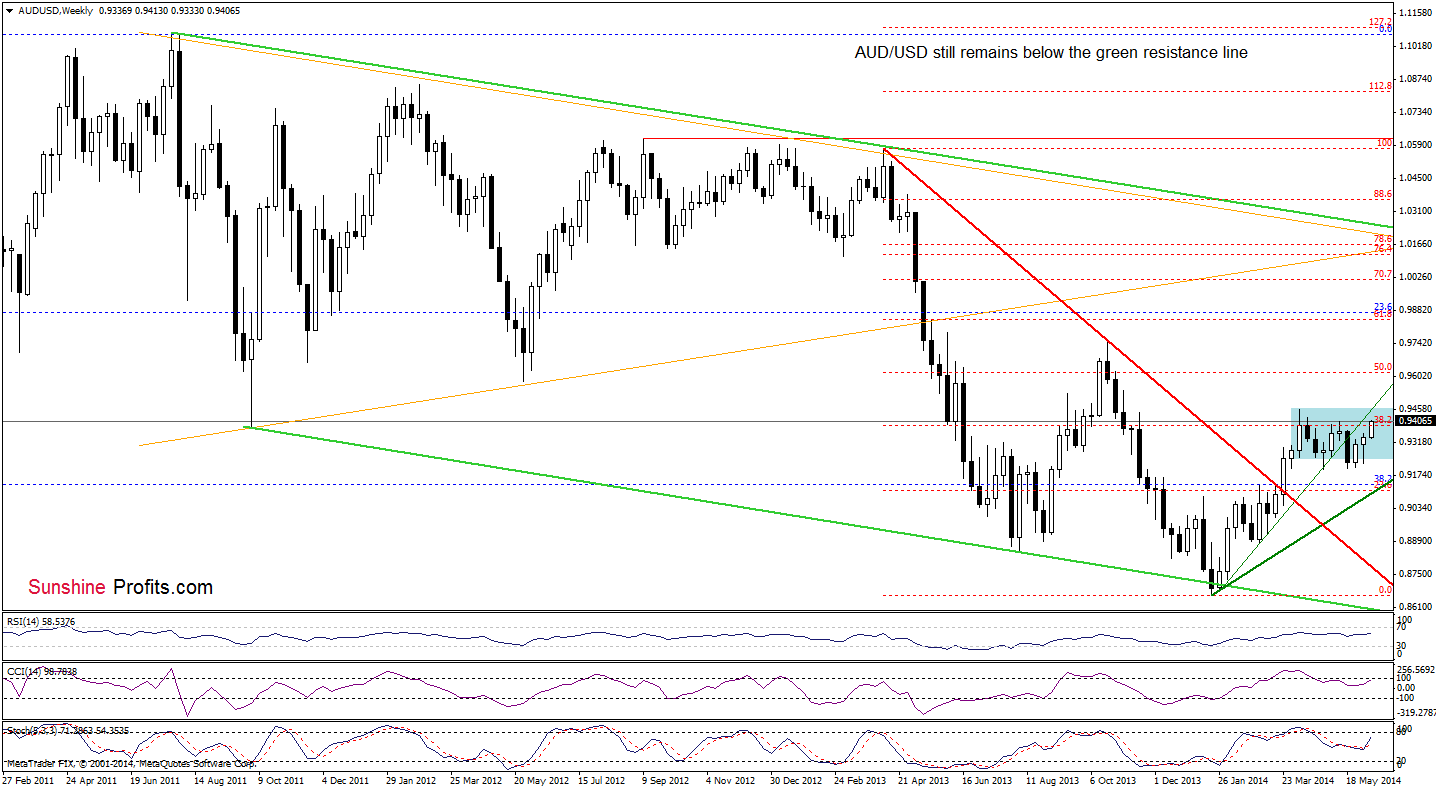
The situation in the medium term has improved slightly as AUD/USD climbed above the 38.2% Fibonacci rettracement level based on the entire Apr.2013-Jan.2014 decline. Despite this improvement, the pair still remains below the previously-broken green resistance line, which corresponds to the Apr. high at the moment.
Having say that, let’s examine the daily chart.
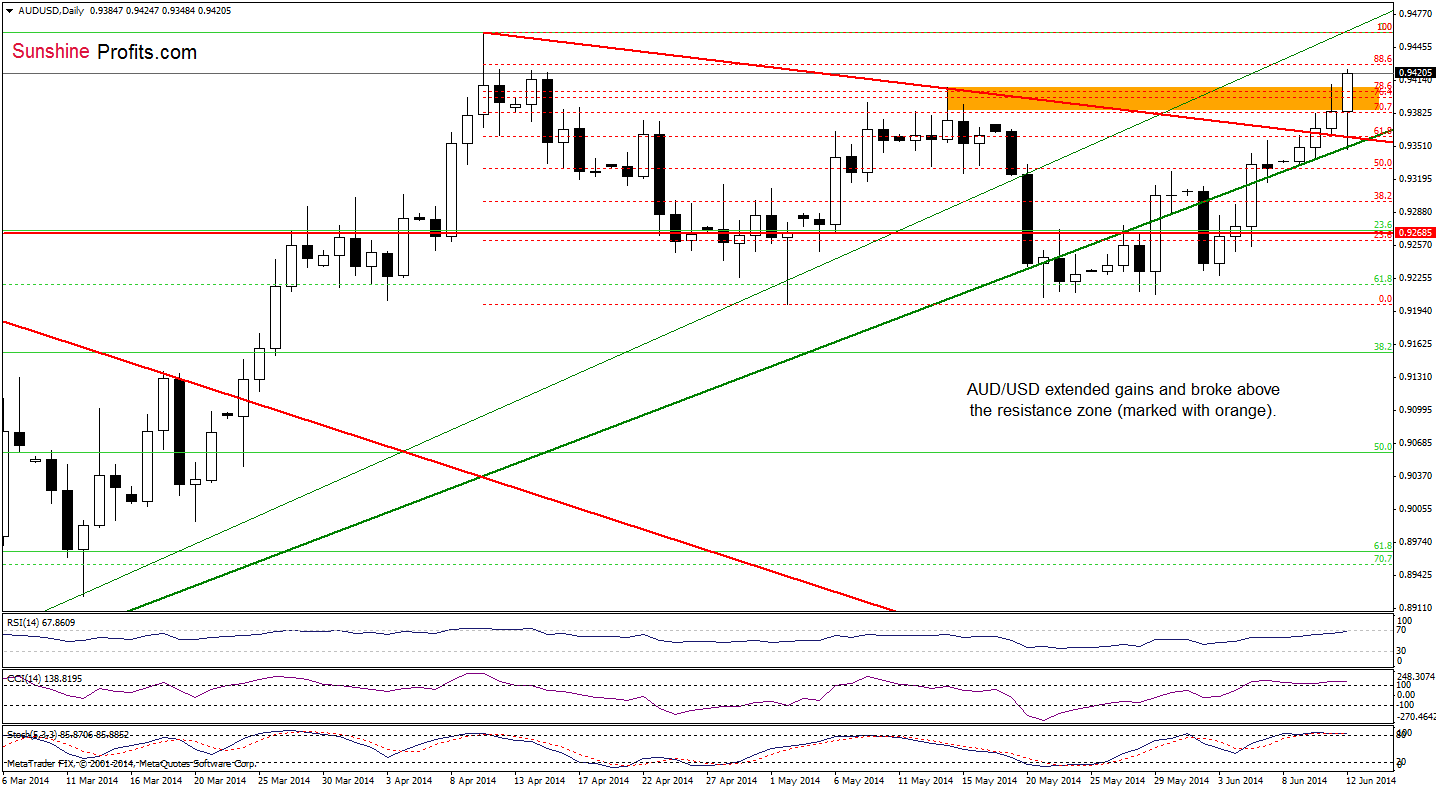
Looking at the daily chart, we see that although AUD/USD declined below the red declining line (which serves as support at the moment), the medium-term green line stopped further deterioration and the pair rebounded sharply. With this upswing, the pair broke above the resistance zone created by the 76.4% and the 78.6% Fibonacci retracement levels (based on the entire Apr.-May decline) and the May high, which is a bullish signal. In our opinion, the next upside target will be the 88.6% Fibonacci retracement (around 0.9430), which is slightly above the Apr.14 high. Please note that if it is broken, the exchange rate will test the strength of the resistance level created by the 2014 high of 0.9459.
Although the very short-term situation looks bullish at the moment, we should keep in mind that the RSI reached its highest level since mid-April, while the CCI and Stochastic Oscillator are overbought. Additionally, there are negative divergences between them and the exchange rate, which suggests that correction is just around the corner.
Very short-term outlook: mixed
Short-term outlook: mixed
MT outlook: bearish
LT outlook: bearish
Trading position (short-term; our opinion): It turned out that our decision to close the short positions on June 4 was correct - the AUD/USD pair moved visibly higher shortly after that. In our opinion no positions are justified from the risk/reward perspective at the moment. We will keep you informed should anything change, or should we see a confirmation/invalidation of the above.
Thank you.
Nadia Simmons
Forex & Oil Trading Strategist
Przemyslaw Radomski, CFA
Founder, Editor-in-chief
Gold & Silver Trading Alerts
Forex Trading Alerts
Oil Investment Updates
Oil Trading Alerts

