
Today, the common currency extended losses and approached the four-month low against the greenback as higher U.S. Treasury yields continued to weigh. Thanks to these circumstances, EUR/USD re-tested the strength of the medium-term support line. Will it withstand the selling pressure?
In our opinion the following forex trading positions are justified - summary:
EUR/USD
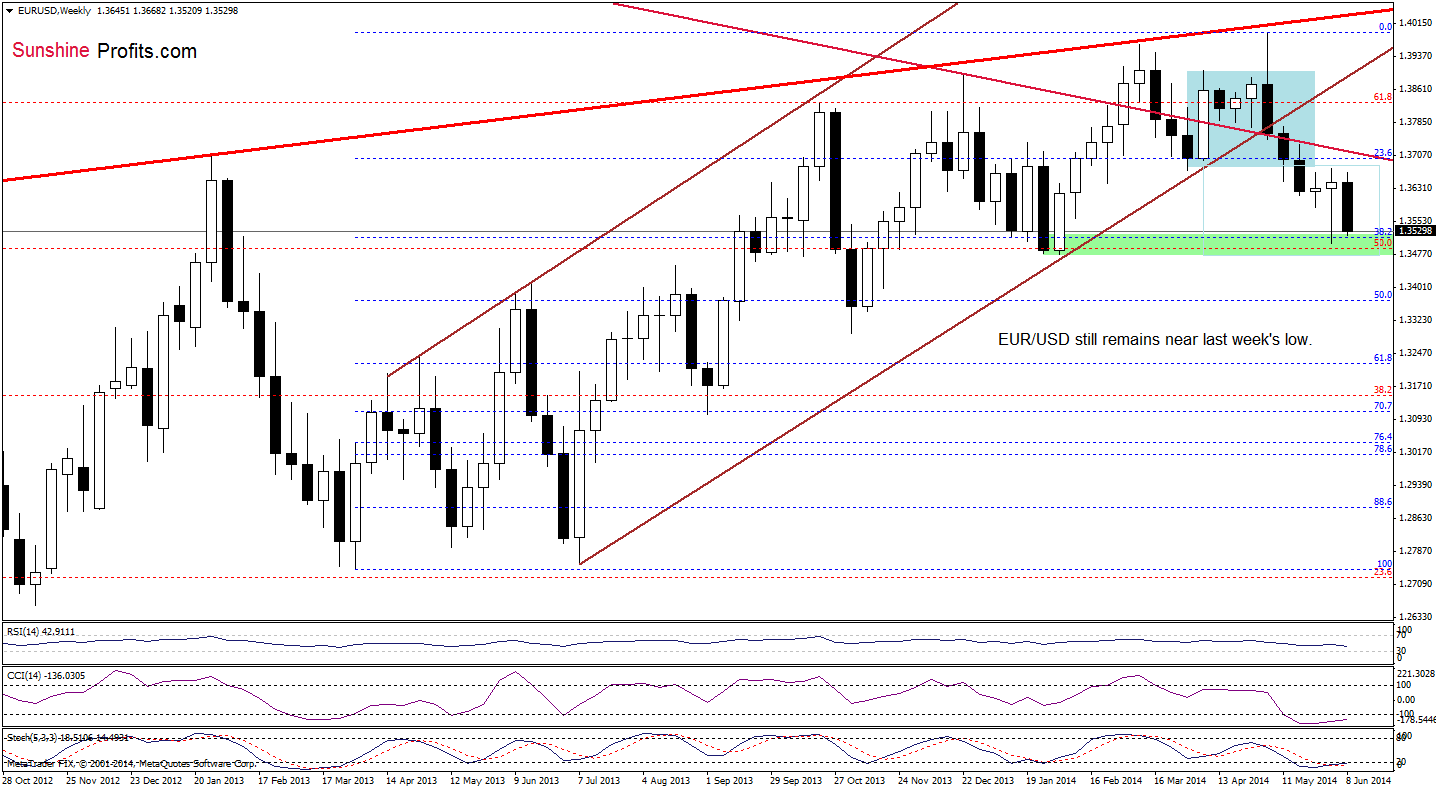
On the above chart, we see that the situation has deteriorated slightly as EUR/USD extended losses and reached the 38.2% Fibonacci retracement, approaching last week’s low. Taking this fact into account, we believe that what we wrote yesterday remains up-to-date:
(…) it’s worth noting that slightly below these levels are also the Jan. and Feb. lows, which serve as an additional support. Therefore, we think that if this area holds, we’ll see another attempt to break above the major resistance line. However, if it is broken, the next downside target will be around 1.3367, where the 50% Fibonacci retracement is.
Once we know the above, let’s check the short-term changes.
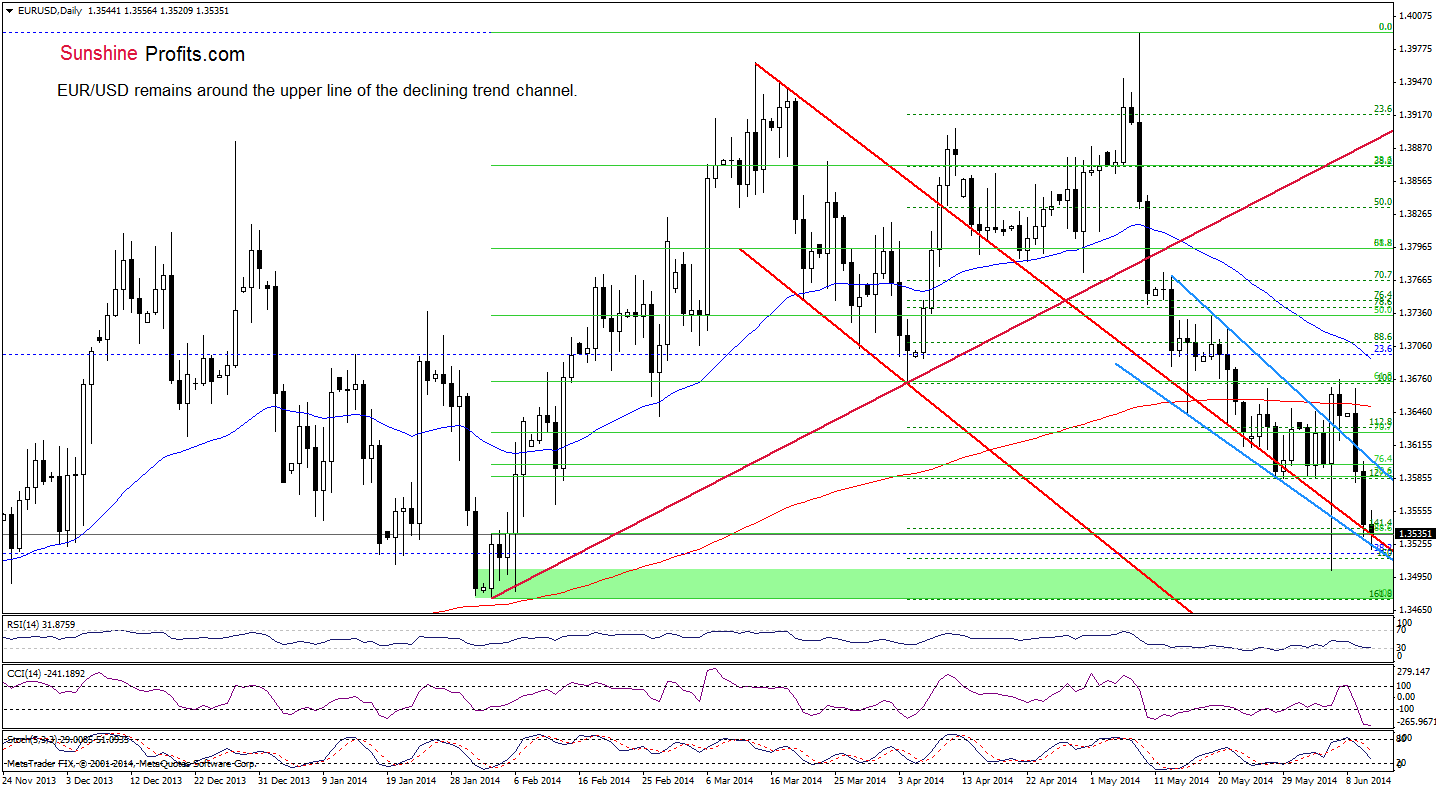
Looking at the daily chart, we see that although EUR/USD moved lower, the pair reversed and still remains around yesterday’s levels. Therefore, our last commentary on this currency pair is still valid:
(…) the exchange rate declined to the strong support zone created by the 88.6% Fibonacci retracement, 141.4% Fibonacci extension, the lower border of the declining wedge (marked with blue) and the upper line of the declining trend channel (marked with red). If it withstands the selling pressure, we’ll see a rebound to the upper blue line (currently around 1.3605). However, if this area is broken, we may see a drop even to the Feb. low of 1.3476.
Very short-term outlook: mixed with bearish bias
Short-term outlook: bearish
MT outlook: bearish
LT outlook: bearish
Trading position (short-term; our opinion): In our opinion no positions are justified from the risk/reward perspective as the space for further declines may be limited. We will keep you informed should anything change, or should we see a confirmation/invalidation of the above.
USD/JPY
Today we’ll take a closer look at the short-term picture.
Quoting our last commentary on this currency pair:
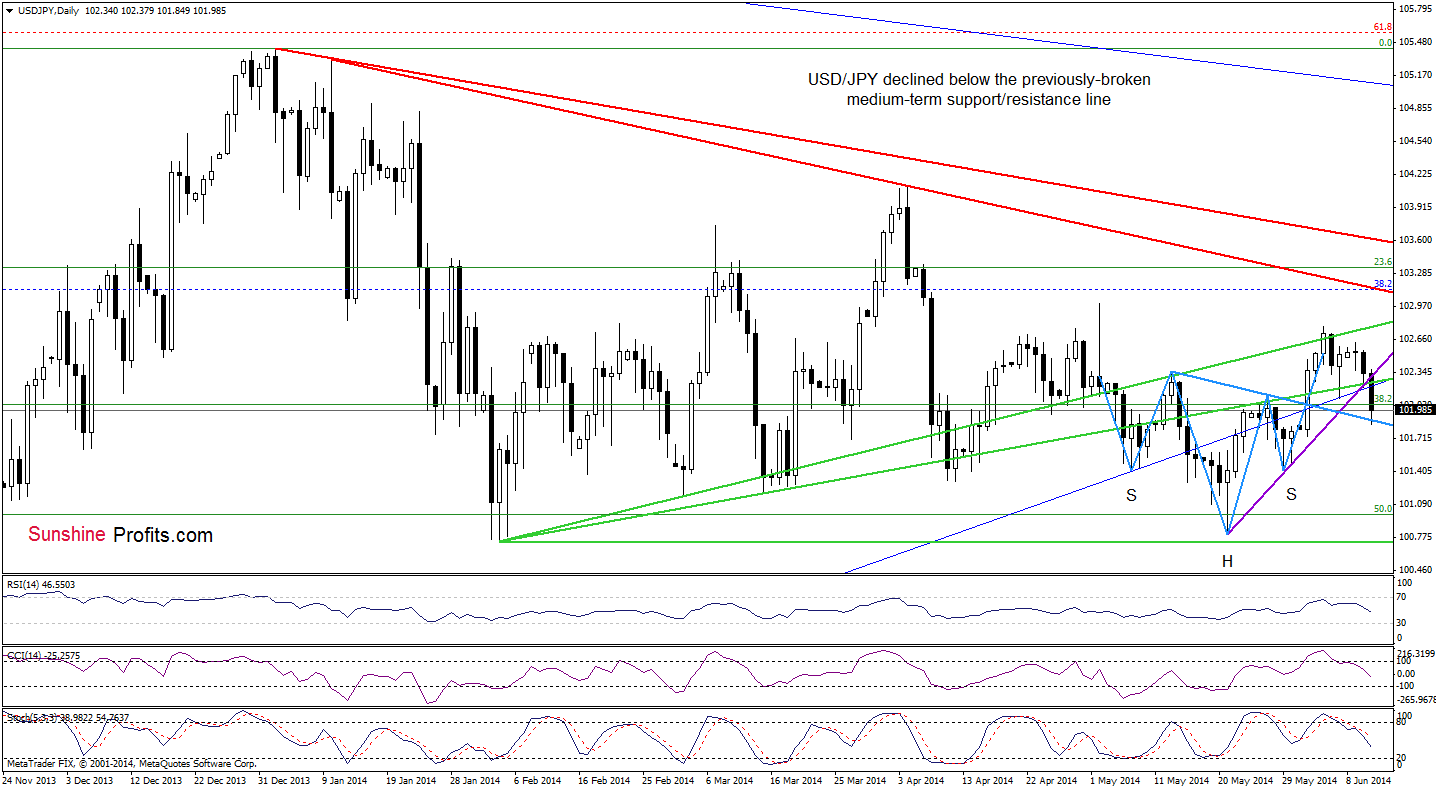
(…) the pair approached the upper green resistance line(…) it seems to us that as long as there is no breakout above this resistance another attempt to test the strength of the support zone can’t be ruled out – especially when we take into account the current position of the indicators (the CCI and Stochastic Oscillator are very close to generating sell signals) (…) if the support zone doesn’t withstand the selling pressure, we’ll see an invalidation of the reversed head and shoulders formation, which may result in a correction to the May 29 low (or even to the May low of 100.81).
As you see on the daily chart, USD/JPY extended losses and declined below the support zone created by the medium-term blue rising line and the previously-broken lower green line, which is a bearish signal. With today’s downswing the exchange rate also dropped below the support line based on the May 21 and May 29 lows (marked with purple), while sell signals generated by the CCI and Stochastic Oscillator remain in place. All the above provides us with bearish implications, suggesting further deterioration and realization the above-mentioned scenario. Nevertheless, we should keep in mind that the neck line of the reverse head and shoulders pattern still holds, which may result in a corrective upswing to the previously-broken support zone.
Very short-term outlook: mixed with bearish bias
Short-term outlook: mixed
MT outlook: mixed
LT outlook: bearish
Trading position (short-term): In our opinion no positions are justified from the risk/reward perspective at the moment. We will keep you informed should anything change, or should we see a confirmation/invalidation of the above.
AUD/USD
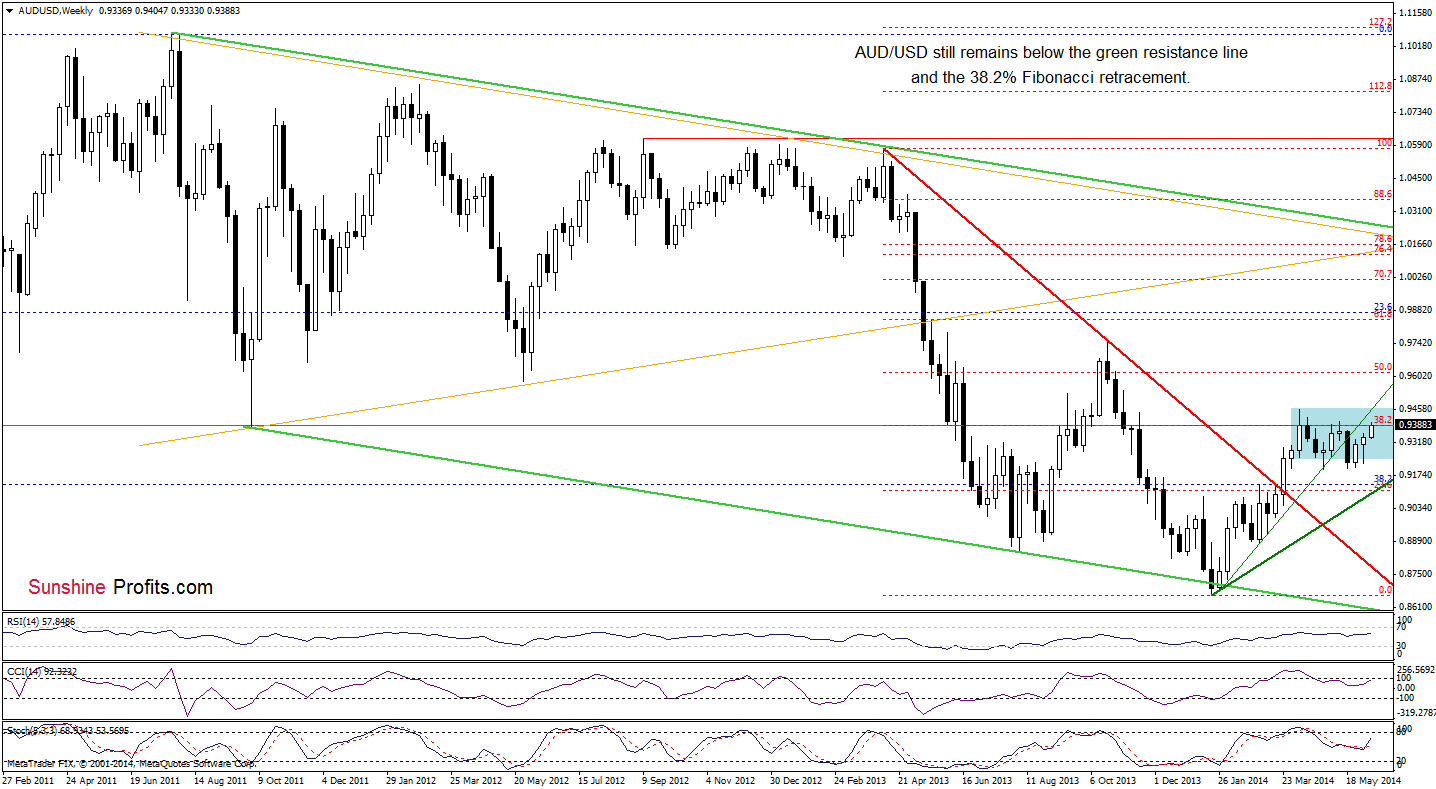
The situation in the medium term hasn’t changed much as AUD/USD is trading around the 38.2% Fibonacci rettracement level based on the entire Apr.2013-Jan.2014 decline. Therefore, what we wrote yesterday is up-to-date:
(…) In the previous weeks this resistance level succesfully stopped further improvement. Therefore, if history repeats itself once again, we will see another pullback from here. On the other hand, if currency bulls do not give up and push the pair above this resistance, it seems to us that the previously-broken green resistance line (which corresponds to the Apr. high at the moment) will be strong enough to stop them.
Having say that, let’s examine the daily chart.
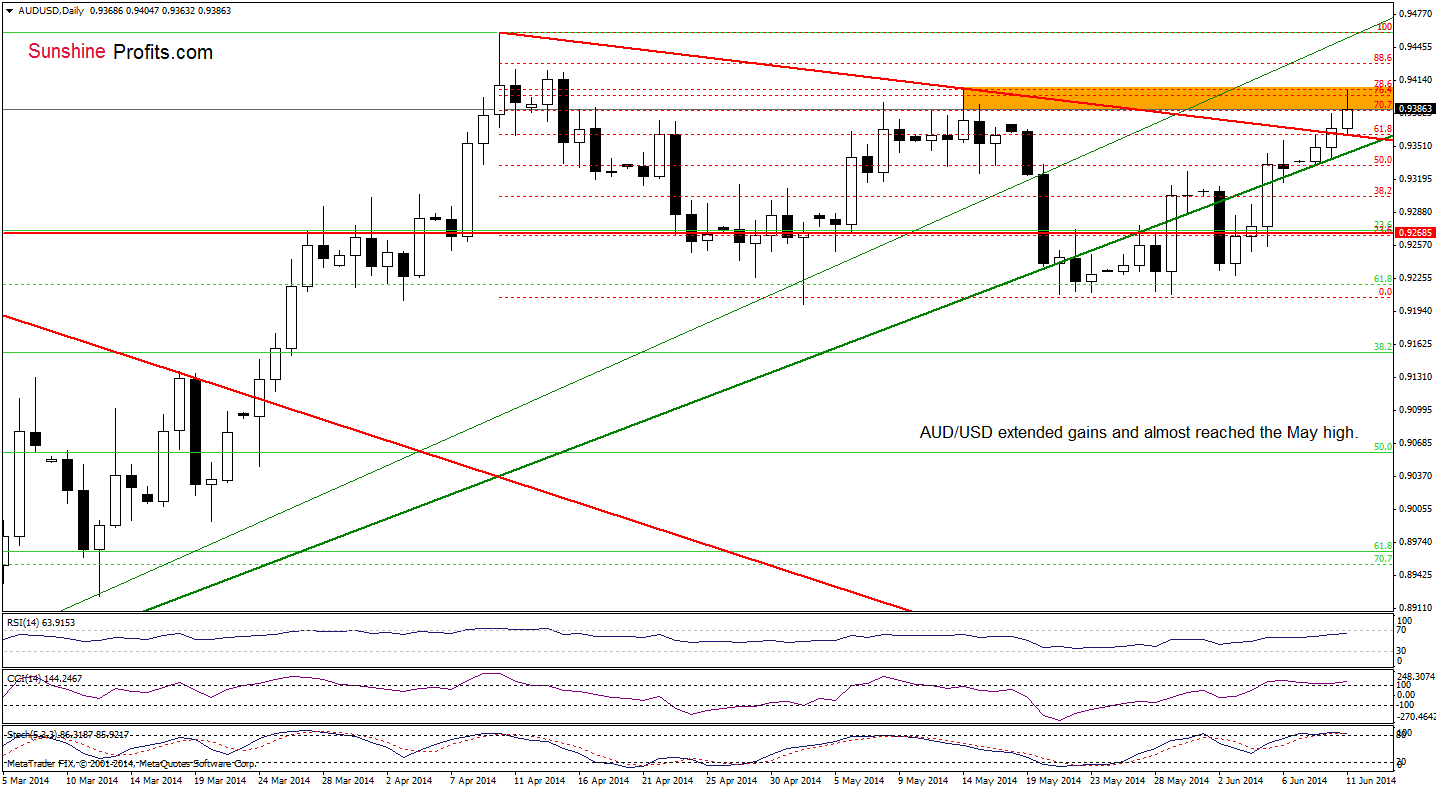
Looking at the daily chart, we see that AUD/USD climbed above the red declining resistance line and reached the resistance zone created by the 76.4% and the 78.6% Fibonacci retracement levels (based on the entire Apr.-May decline) and the May high. As you see on the above chart, these Fibonacci retracement levels successfully stopped further improvement in the previous month and triggered a correction. Taking this fact into account and combining it with the current position of the indicators (the RSI reached its highest level since mid-May, while the CCI and Stochastic Oscillator are overbought) and the 38.2% Fibonacci retracement level based on the entire Apr.2013-Jan.2014 decline (marked on the weekly chart), we think that history will repeat itself once again and we’ll see a pulback from here in the coming days – especially if AUD/USD drops below the green support line.
Very short-term outlook: mixed with bearish bias
Short-term outlook: mixed
MT outlook: bearish
LT outlook: bearish
Trading position (short-term; our opinion): In our opinion no positions are justified from the risk/reward perspective as the space for further declines may be limited. We will keep you informed should anything change, or should we see a confirmation/invalidation of the above.
Thank you.
Nadia Simmons
Forex & Oil Trading Strategist
Przemyslaw Radomski, CFA
Founder, Editor-in-chief
Gold & Silver Trading Alerts
Forex Trading Alerts
Oil Investment Updates
Oil Trading Alerts

