
Today, the common currency continued to move lower against the greenback as Treasury yields in the U.S. continued to rise. In reaction to this, EUR/USD declined below 1.3600 and reached important support lines. Will they stop currency bears?
In our opinion the following forex trading positions are justified - summary:
EUR/USD
On Friday, we wrote the following:
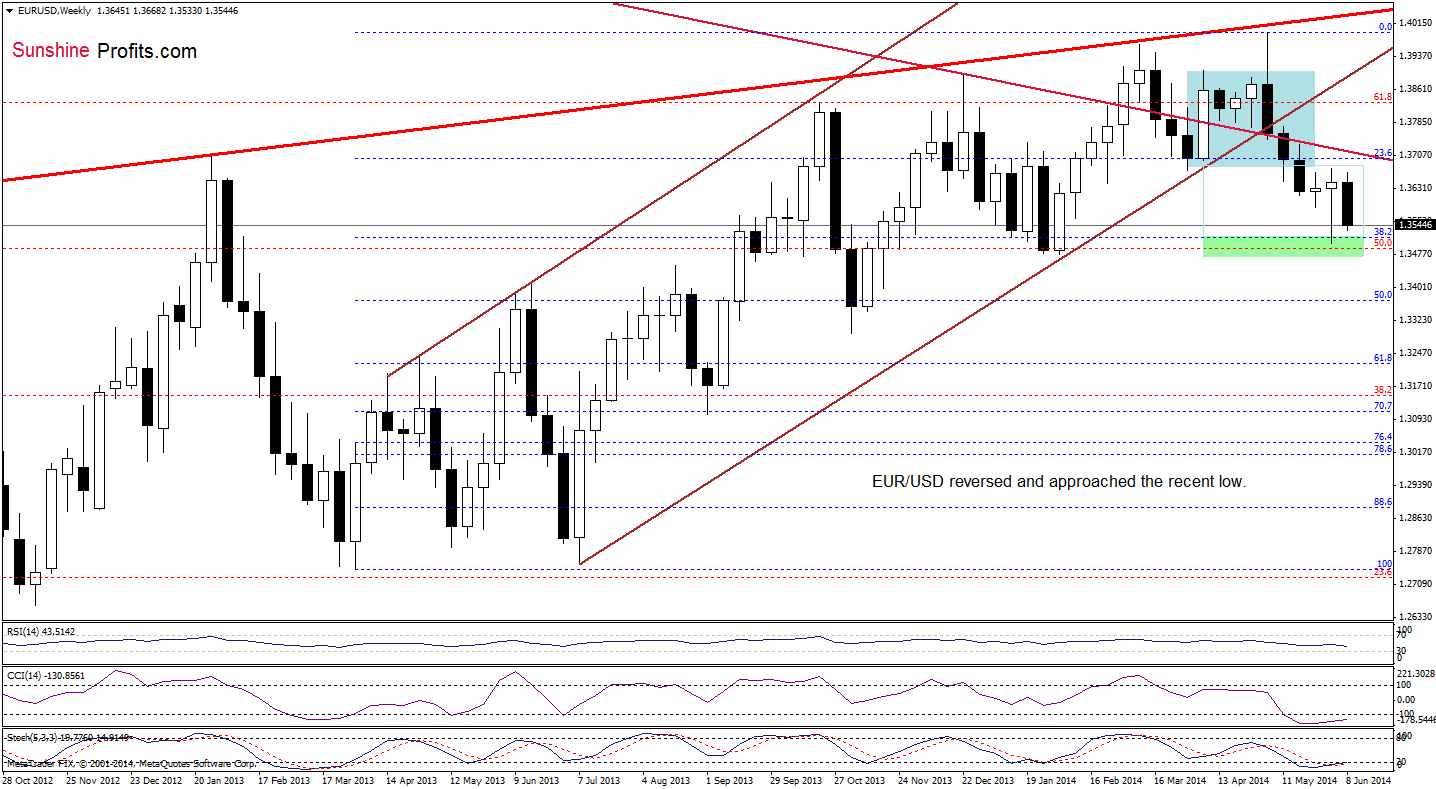
(…) the pair remains below the long-term declining resistance line (currently around 1.3723). Therefore, we think that as long as there is no breakout above this major resistance line, the space for further growth seems limited.
Looking at the above chart, we see that the proximity to the long-term resistance line encouraged forex traders to push the sell button. As a result, the exchange rate reversed and declined, approaching last week’s low and the 38.2% Fibonacci retracement. At this point, it’s worth noting that slightly below these levels are also the Jan. and Feb. lows, which serve as an additional support. Therefore, we think that if this area holds, we’ll see another attempt to break above the major resistance line. However, if it is broken, the next downside target will be around 1.3367, where the 50% Fibonacci retracement is.
Once we know the above, let’s check the short-term changes.
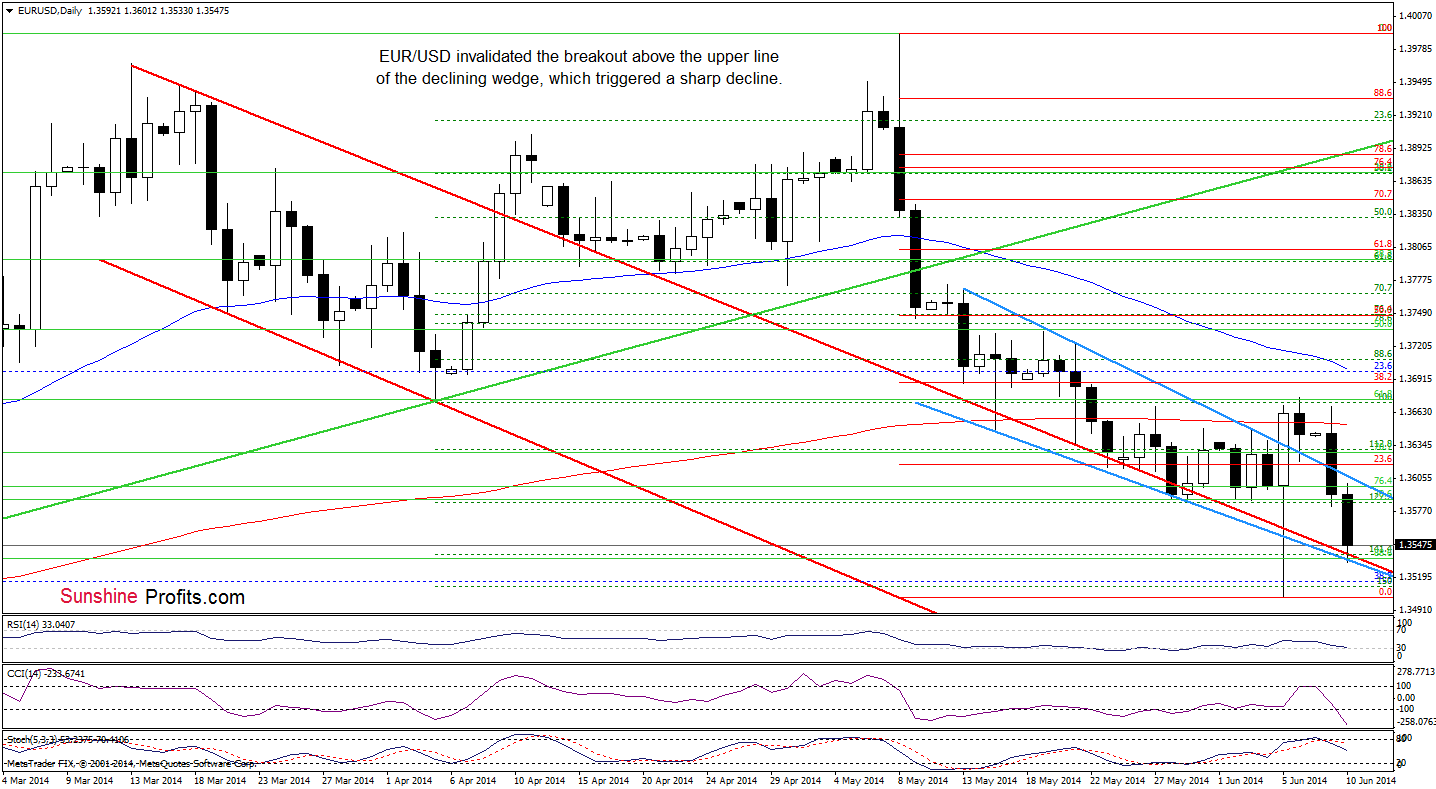
On the above chart, we see that although EUR/USD broke above the upper line of the declining wedge, the breakout was invalidated, which was a strong bearish signal that triggered further deterioration earlier today. With this downswing, the exchange rate declined to the strong support zone created by the 88.6% Fibonacci retracement, 141.4% Fibonacci extension, the lower border of the declining wedge (marked with blue) and the upper line of the declining trend channel (marked with red). If it withstands the selling pressure, we’ll see a rebound to the upper blue line (currently around 1.3605). However, if this area is broken, we may see a drop even to the Feb. low of 1.3476.
Very short-term outlook: mixed with bearish bias
Short-term outlook: bearish
MT outlook: bearish
LT outlook: bearish
Trading position (short-term; our opinion): In our opinion no positions are justified from the risk/reward perspective as the space for further declines may be limited. We will keep you informed should anything change, or should we see a confirmation/invalidation of the above.
GBP/USD
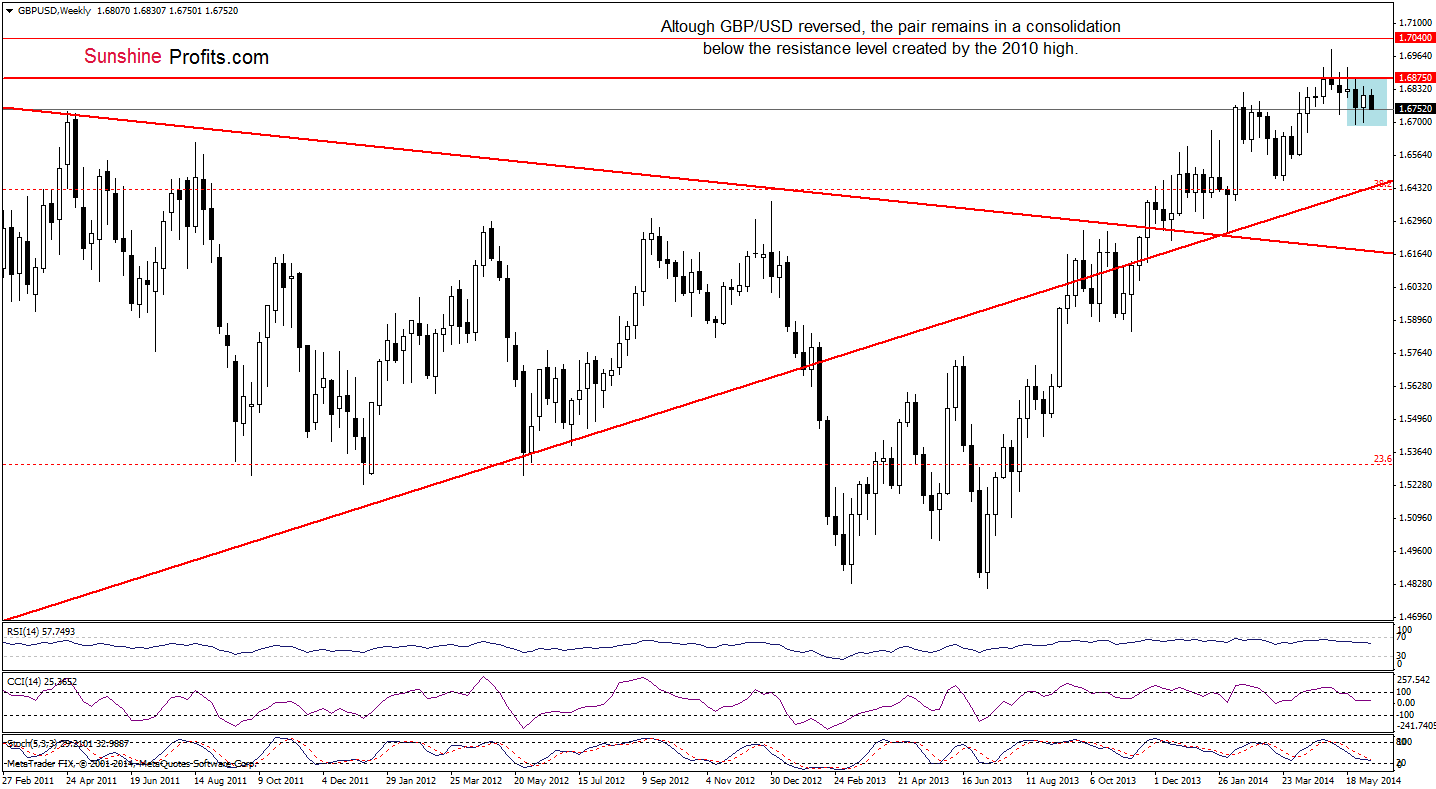
As you see on the weekly chart, the situation in the medium term hasn’t changed much as GBP/USD remains in a consolidation below the resistance level created by the 2010 high. Taking this fact into account, it seems to us that as long as there is no breakout above the upper border of the formation (or a breakdown below 1.6691) another sizable move is not likely to be seen.
Can we infer something more from the short-term picture?
On Friday, we wrote the following:
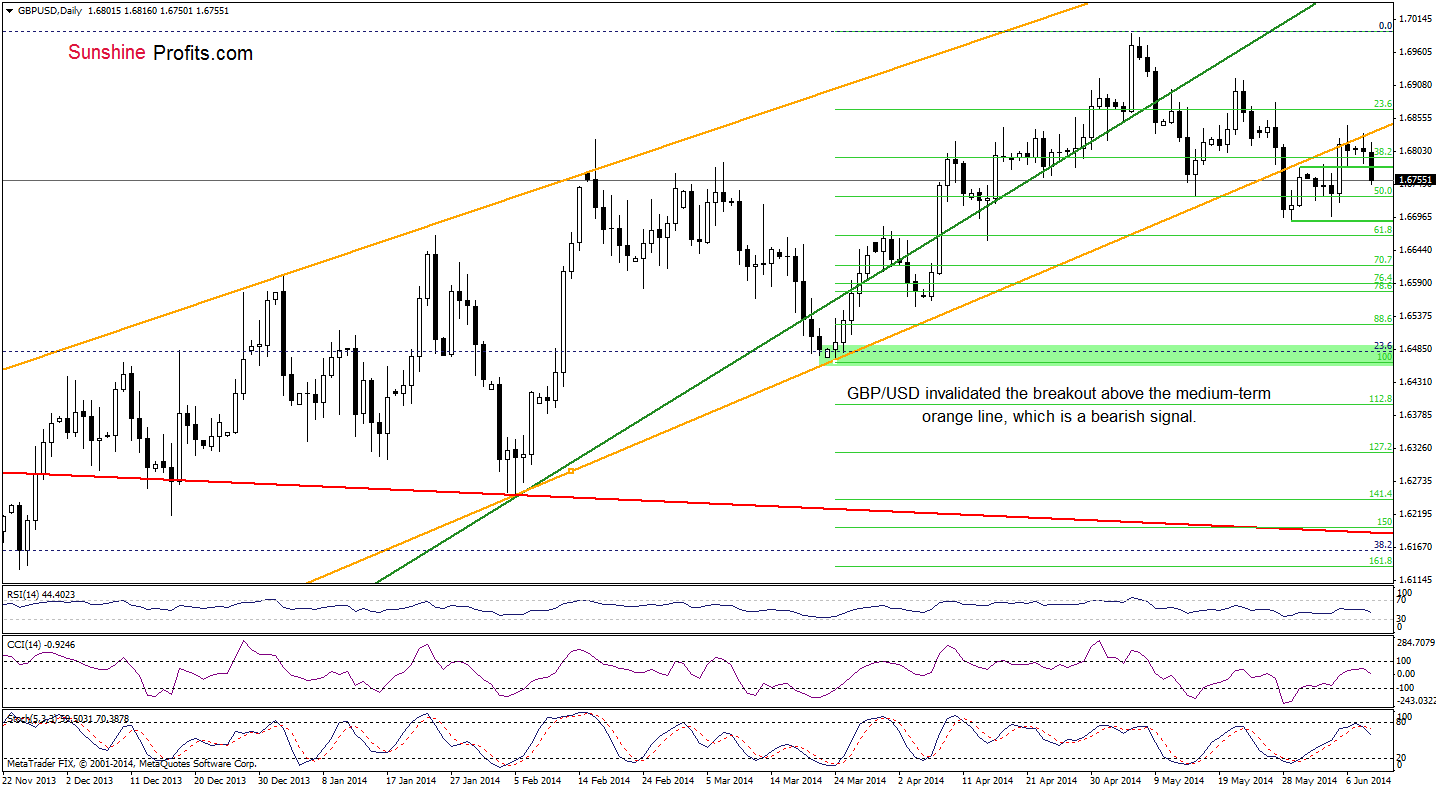
(…) GBP/USD (…) broke above the medium-term orange resistance line. Although this was a strong bullish signal, (…) the exchange rate reversed, invalidating the breakout. This is a strong bearish signal and it seems to us that if the pair closes the day below this line, we’ll see further deterioration – especially if GBP/USD declines below the green support line based on the May 30 high. In our opinion, if we see such price action, the first downside target will be the May low of 1.6691.
Earlier today, the exchange rate dropped below the green support line and we think that the above-mentioned bearish scenario will be in play in the coming days – especially when we factor in the current position of the indicators (the RSI and CCI reversed, while the Stochastic Oscillator generated a sell signal, supporting the bearish case).
Very short-term outlook: bearish
Short-term outlook: mixed with bearish bias
MT outlook: bearish
LT outlook: mixed
Trading position (short-term): In our opinion, no positions are justified from the risk/reward perspective. We will keep you informed should anything change, or should we see a confirmation/invalidation of the above.
AUD/USD
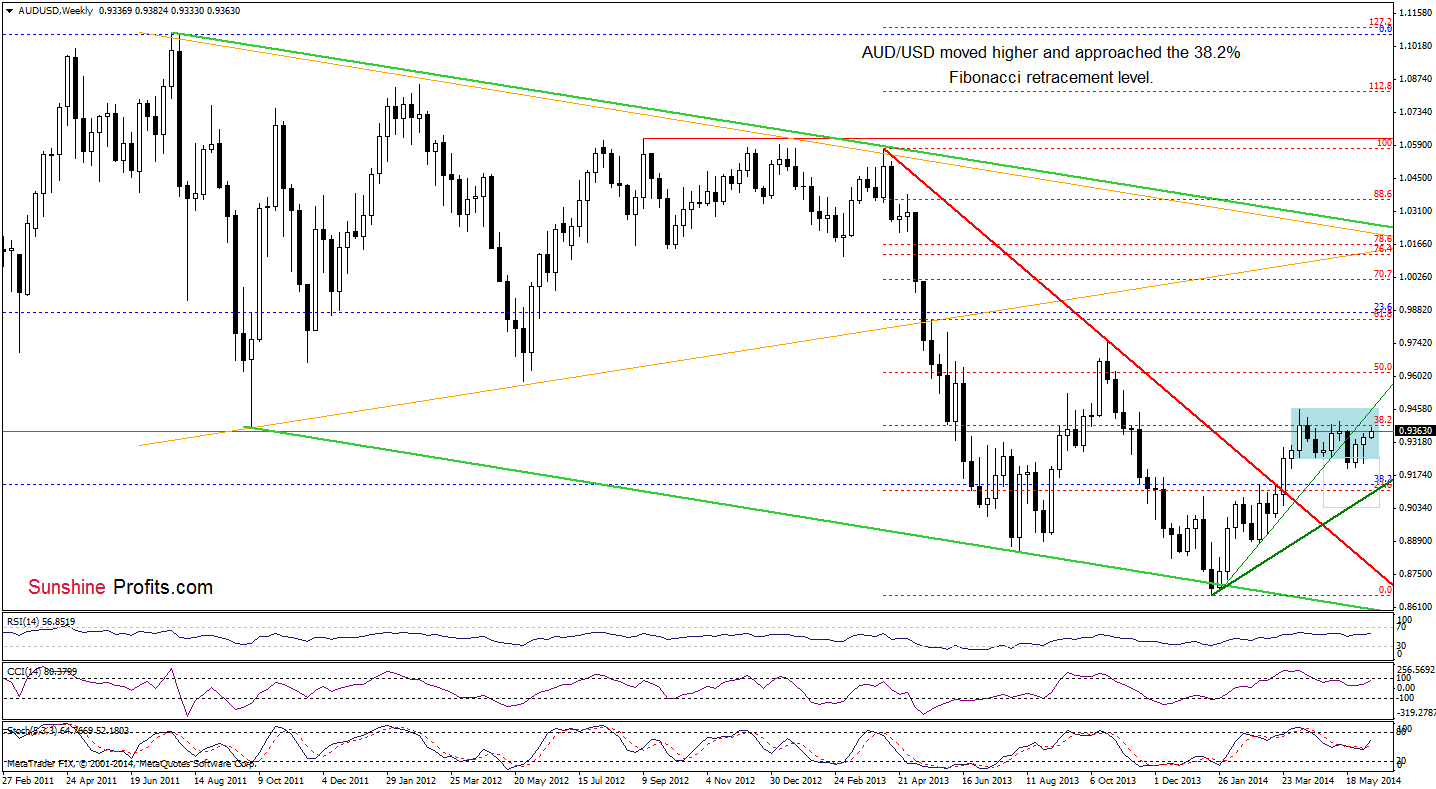
The situation in the medium term has improved slightly as AUD/USD extended gains and reached the 38.2% Fibonacci rettracement level based on the entire Apr.2013-Jan.2014 decline. In the previous weeks this resistance level succesfully stopped further improvement. Therefore, if history repeats itself once again, we will see another pullback from here. On the other hand, if currency bulls do not give up and push the pair above this resistance, it seems to us that the previously-broken green resistance line (which corresponds to the Apr. high at the moment) will be strong enough to stop them.
Having say that, let’s examine the daily chart.
Quoting our Forex Trading Alert posted on Friday:
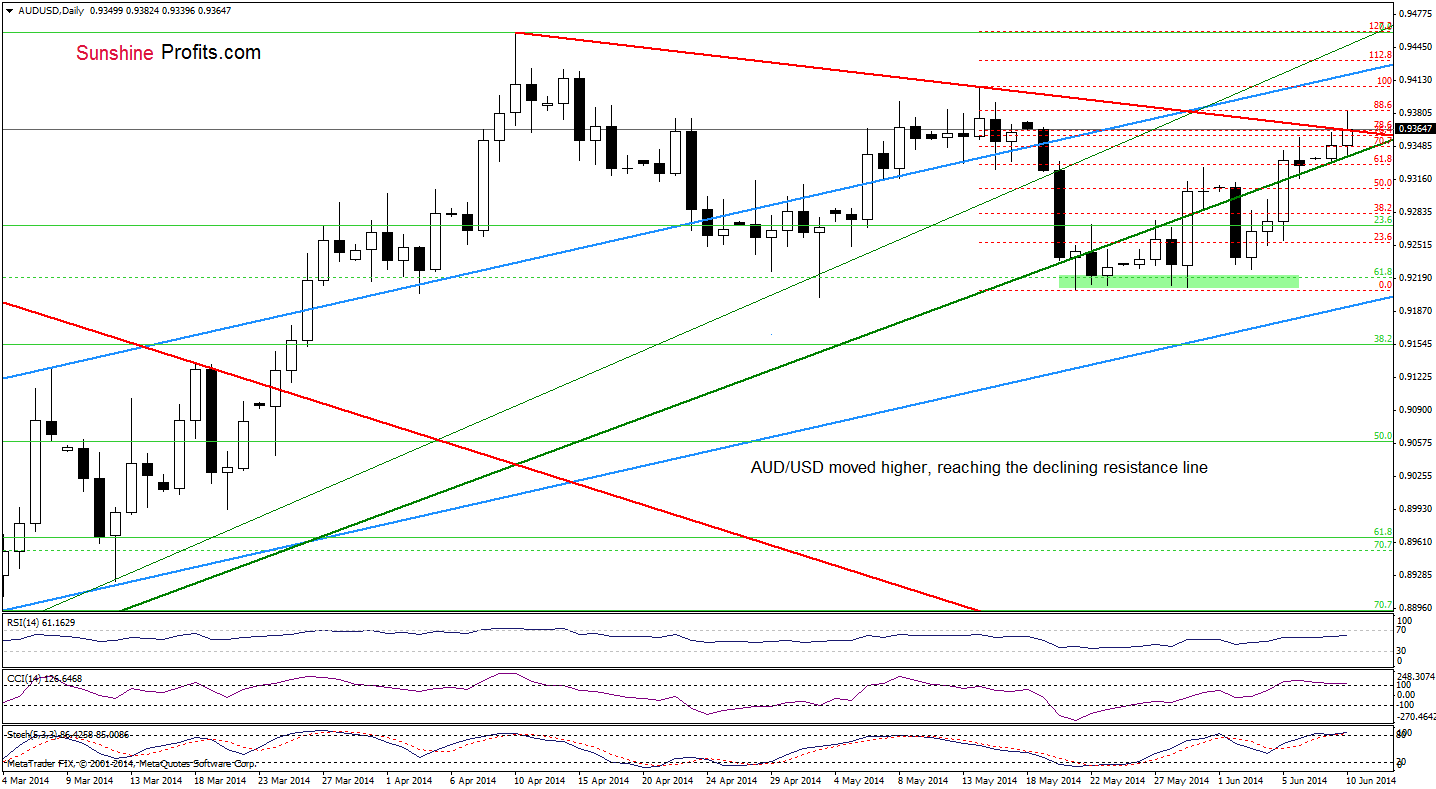
(…) the pair reached the key support/resistance line (…) if it holds, we’ll see another try to climb above the resistance zone.
Looking at the daily chart, we see that although AUD/USD climbed above the resistance zone (created by the 76.4% and the 78.6% Fibonacci retracement levels and the red declining resistance line), this improvement was only temporarily and the pair reversed. An invalidation of the breakout is a bearish signal, which suggests that correction is just around the corner. This assumption is currently reinforced by the position of the indicators. Please note that the RSI reached its highest level since mid-May, while the CCI and Stochastic Oscillator are overbought. Additionally, there is a negative divergence between the CCI and the exchange rate, which provides us with bearish implication. Therefore, we think that if AUD/USD drops below the green support line, we’ll see another sizable move.
Very short-term outlook: mixed with bearish bias
Short-term outlook: mixed
MT outlook: bearish
LT outlook: bearish
Trading position (short-term; our opinion): In our opinion no positions are justified from the risk/reward perspective as the space for further declines may be limited. We will keep you informed should anything change, or should we see a confirmation/invalidation of the above.
Thank you.
Nadia Simmons
Forex & Oil Trading Strategist
Przemyslaw Radomski, CFA
Founder, Editor-in-chief
Gold & Silver Trading Alerts
Forex Trading Alerts
Oil Investment Updates
Oil Trading Alerts

