
Trading position (short-term; our opinion): No forex positions seem to be justified from the risk/reward perspective.
In today’s Forex Trading Alert we have decided to take a step back from our daily coverage of selected currency pairs (basically, what we wrote in the latest big alert that was posted on Friday remains up-to-date) and focus on the index that quite often decides where many pairs will move – the USD Index. The index is the weighted average of various currency pairs that price non-USD currencies with USD, and EUR has the greatest weight.
It is quite often the case that breakouts, breakdowns, rallies, plunges, tops and bottoms in the USD Index correspond to visible price moves in many currency pairs, including the major ones. It was the case recently, when a cyclical turning point in the USD Index generated price moves in the precious metals and in the Euro.
Let’s check technical picture of the USD Index (charts courtesy of http://stockcharts.com). First things first – the long-term picture.
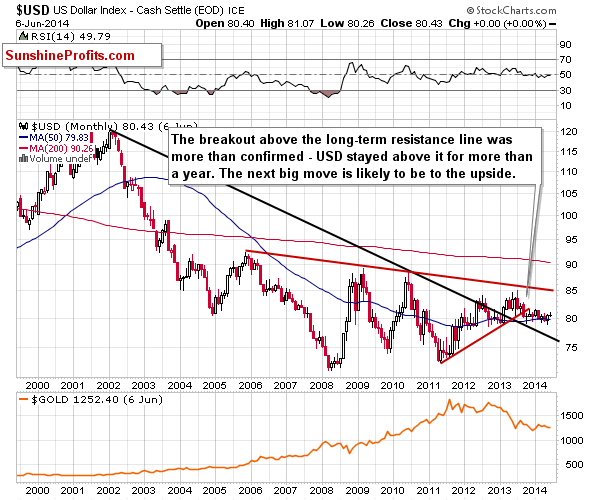
The USD Index moved above the very long-term declining resistance line at the beginning of 2013. It remained there for more than a year, which means that this breakout is now more than confirmed. Consequently, the outlook is bullish in the long term. This means that – in general (and there can be exceptions from this rule) – currency pairs that are quoted against the USD are likely to depreciate over the long run (like: EUR:USD).
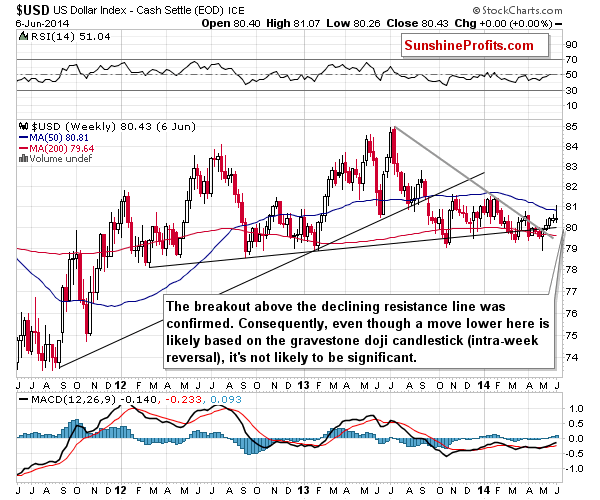
In the coming weeks, however, we can expect to see some weakness. The reason is the gravestone doji candlestick that we can see on the weekly chart. The important thing here is that we have already seen a breakout above the declining medium-term resistance line and the move was confirmed, so the downswing that could be seen here will quite likely be limited. Based on the above chart we have two downside target levels: the 80 level and 79.3 or so (at the declining grey support line).
As far as the short-term outlook for the USD Index is concerned, we will quote what we wrote in today’s Gold & Silver Trading Alert:
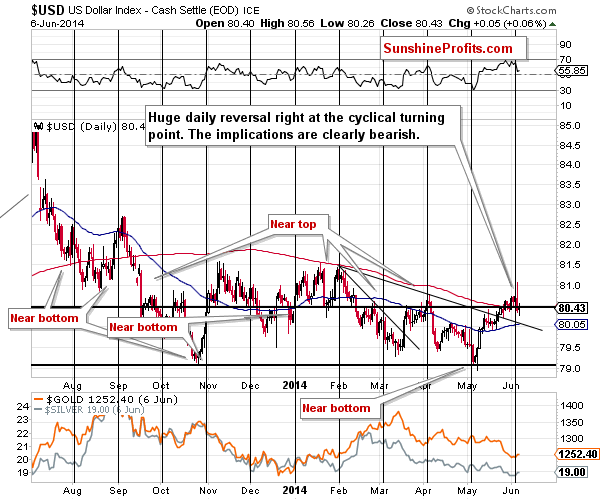
The big deal was the daily intra-day reversal and the subsequent decline in case of the USD Index that followed comments from the ECB. The turnaround was likely to happen based on the cyclical turning point and the ECB simply provided the trigger.
(...)
Please note that the dollar’s turning points have often worked for gold and silver even if the reaction in the USD Index was delayed. That was the case in April and May – in both cases metals were the first to react. Perhaps this time we will see the same thing.
We have seen exactly the same thing this time. Gold and silver have bottomed before the USD Index topped, but both happened very close to the turning point.
It seems that the decline in the USD index will be even bigger than what we’ve seen so far (2-day decline) as no major support level was reached just yet. It seems that the USD Index will pause or stop the decline at the 80 level. This is where the 50-day moving average and the declining support line coincide.
Summing up, we expect the USD Index to move higher in the coming months, however, it seems that we will see a small downswing earlier – within the next week or so.
Thank you.
Nadia Simmons
Forex & Oil Trading Strategist
Przemyslaw Radomski, CFA
Founder, Editor-in-chief
Gold & Silver Trading Alerts
Forex Trading Alerts
Oil Investment Updates
Oil Trading Alerts

