
The greenback moved higher against major currencies after the U.S. Labor Department reported that the economy added 217,000 in May, missing slightly expectations for a 218,000 gain. The private sector added 216,000 jobs last month, beating expectations for a 210,000 increase. The report also showed that the U.S. unemployment rate remained unchanged at 6.3% last month, compared to expectations for a rise to 6.4%. As a result, EUR/USD hit a 17-week low, GBP/USD invalidated the breakout , while AUD/USD reversed to its medium-trm support. How did these numbers influenced technical picture of other major currency pairs?
In our opinion the following forex trading positions are justified - summary:
EUR/USD
A week ago, we wrote the following:
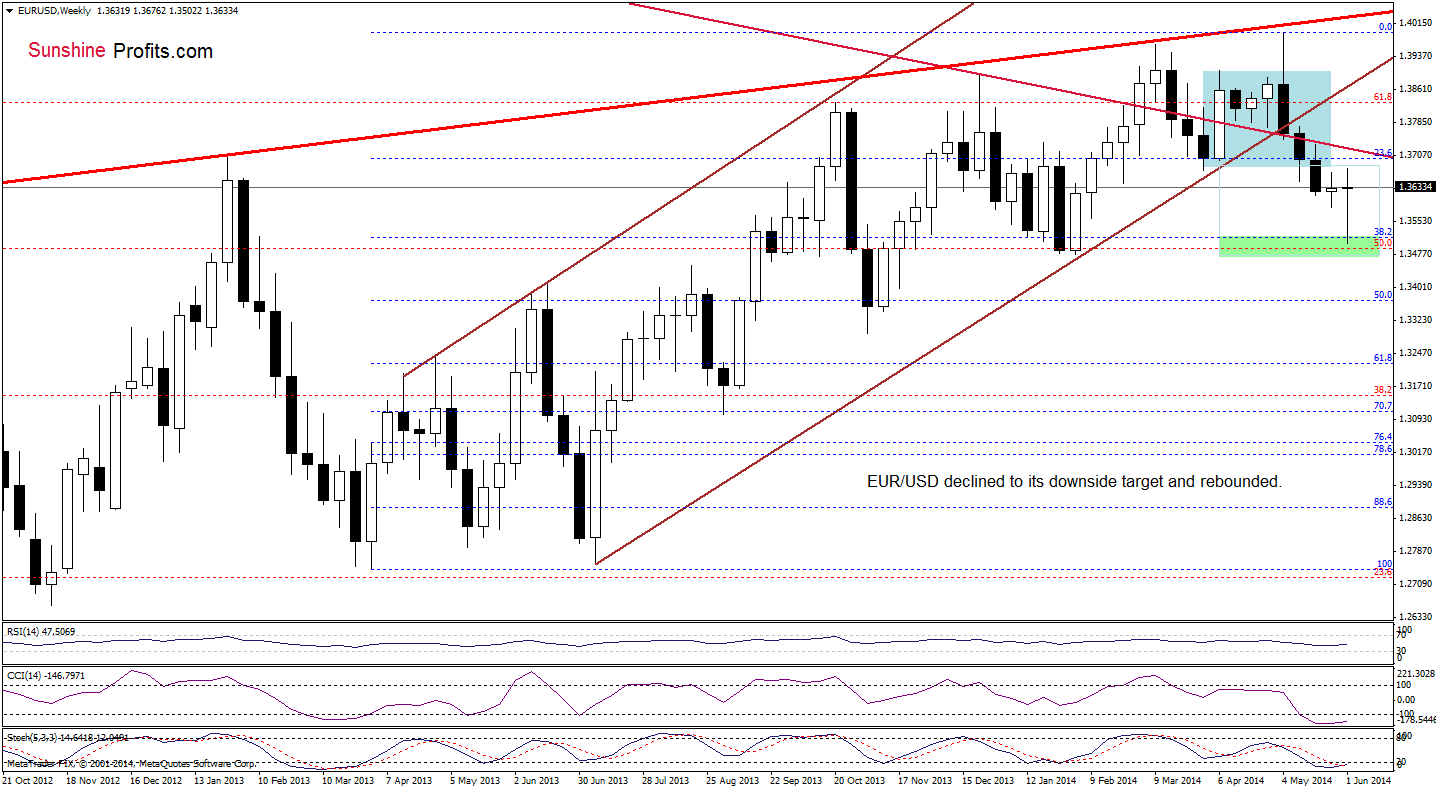
(…) as long as there is no invalidation of the breakdown under these lines, further deterioration is likely. If this is the case, and the exchange rate extends losses in the coming week (or weeks), the downside target will be around 1.3516 (where the 38.2% Fibonacci retracement based on the entire March 2013-May 2014 is) or even slightly lower – around 1.3480, where the bottom of the previous bigger correction (between Dec. and Feb.) is.
Looking at the above chart, we see that currency bears realized the above-mentioned scenario, reaching the 38.2% Fibonacci retracement. As you see on the weekly chart, this support level triggered a corrective upswing which took the exchange rate to the previously-broken lower border of the consolidation. Despite this improvement we should still keep in mind that the pair remains below the long-term declining resistance line (currently around 1.3723). Therefore, we think that as long as there is no breakout above this major resistance line, the space for further growth seems limited.
Once we know the above, let’s check the short-term changes.
Quoting our previous Forex Trading Alert:
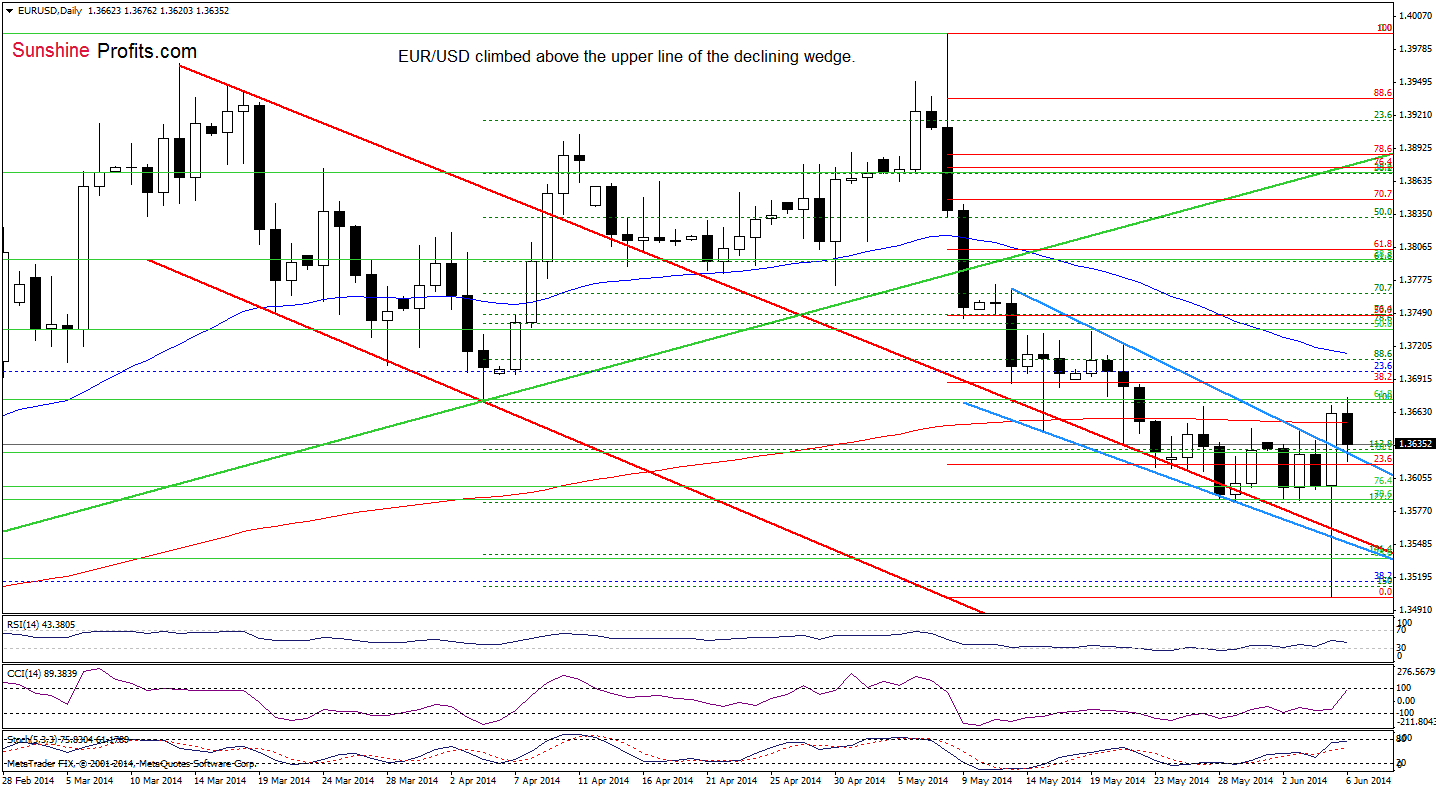
(...) if the pair extends losses, we’ll see another re-test of the strength of the upper line of the declining trend channel (currently around 1.3570) or even a drop to around 1.3540, where the 88.6% Fibonacci retracement (based on the entire Feb.-May rally) meets the 141.4% Fibonacci extension (based on the Apr.-May rally).
On the above chart, we see that the exchange rate declined not only to the above-mentioned levels, but also reached the 38.2% Fibonacci retracement based on the entire Apr.2013-May 2014 rally. As we have pointed out before, this strong support encouraged forex traders to push the buy button and the exchange rate rebounded sharply, breaking above the upper line of the declining wedge. This is a strong bullish signal that suggests that we will likely see further improvement – especially when we factor in the fact that the pair verified the breakout earlier today. If this is the case, and the blue support holds, we’ll see an increase to the 50-day moving average (currently at 1.3714) or even to around 1.3747, where the 50% Fibonacci retracement based on the entire recent decline is.
Very short-term outlook: bullish
Short-term outlook: bullish
MT outlook: bearish
LT outlook: bearish
Trading position (short-term; our opinion): In our opinion no positions are justified from the risk/reward perspective as the space for further declines may be limited. We will keep you informed should anything change, or should we see a confirmation/invalidation of the above.
GBP/USD
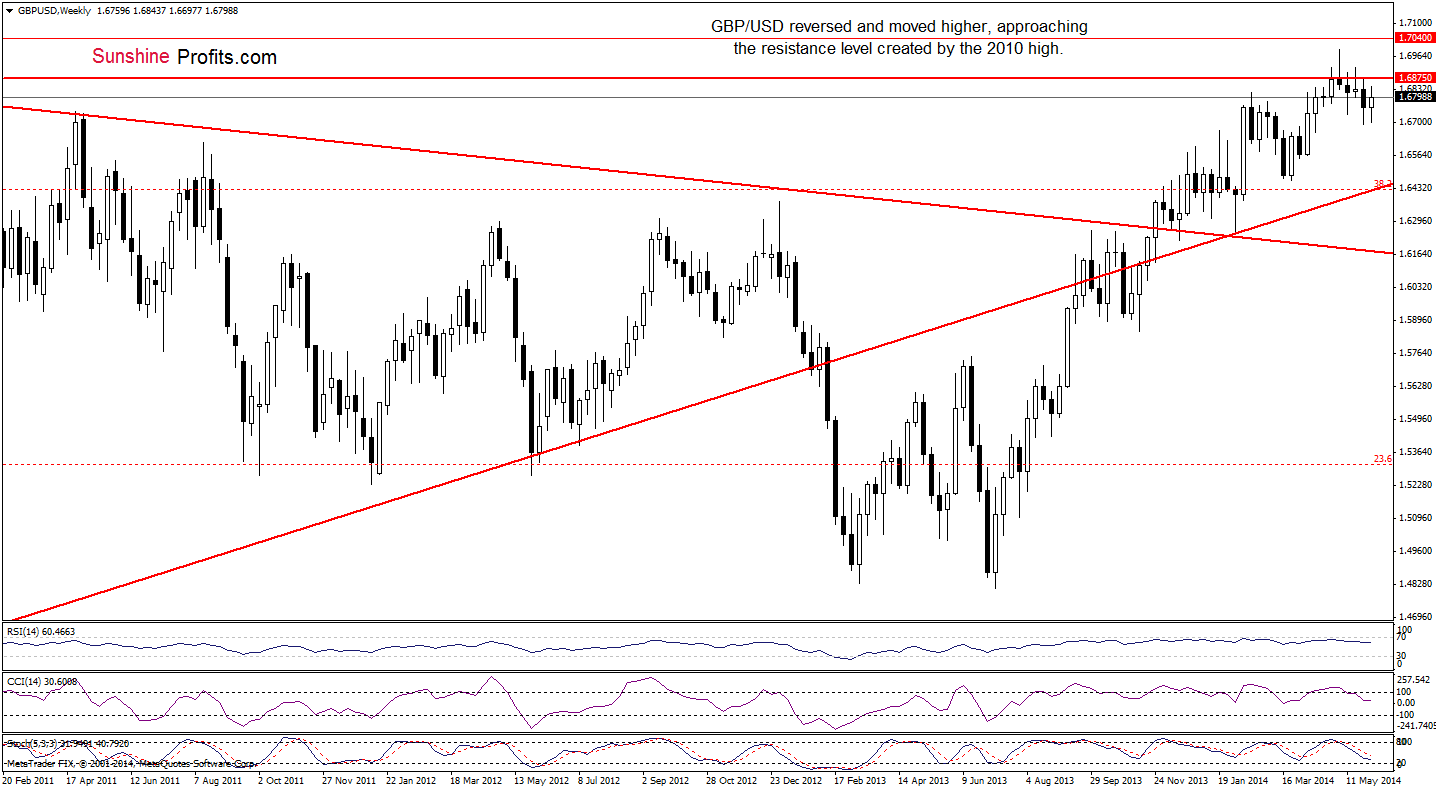
As you see on the weekly chart, the situation in the medium term has improved slightly as GBP/USD rebounded and approached the resistance level created by the 2010 high. If it holds, we may see another attempt to move lower – especially when we factor in the current position of the indicators (sell signals generated by the indicators remain in place, supporting the bearish case).
What can we infer from the short-term picture?
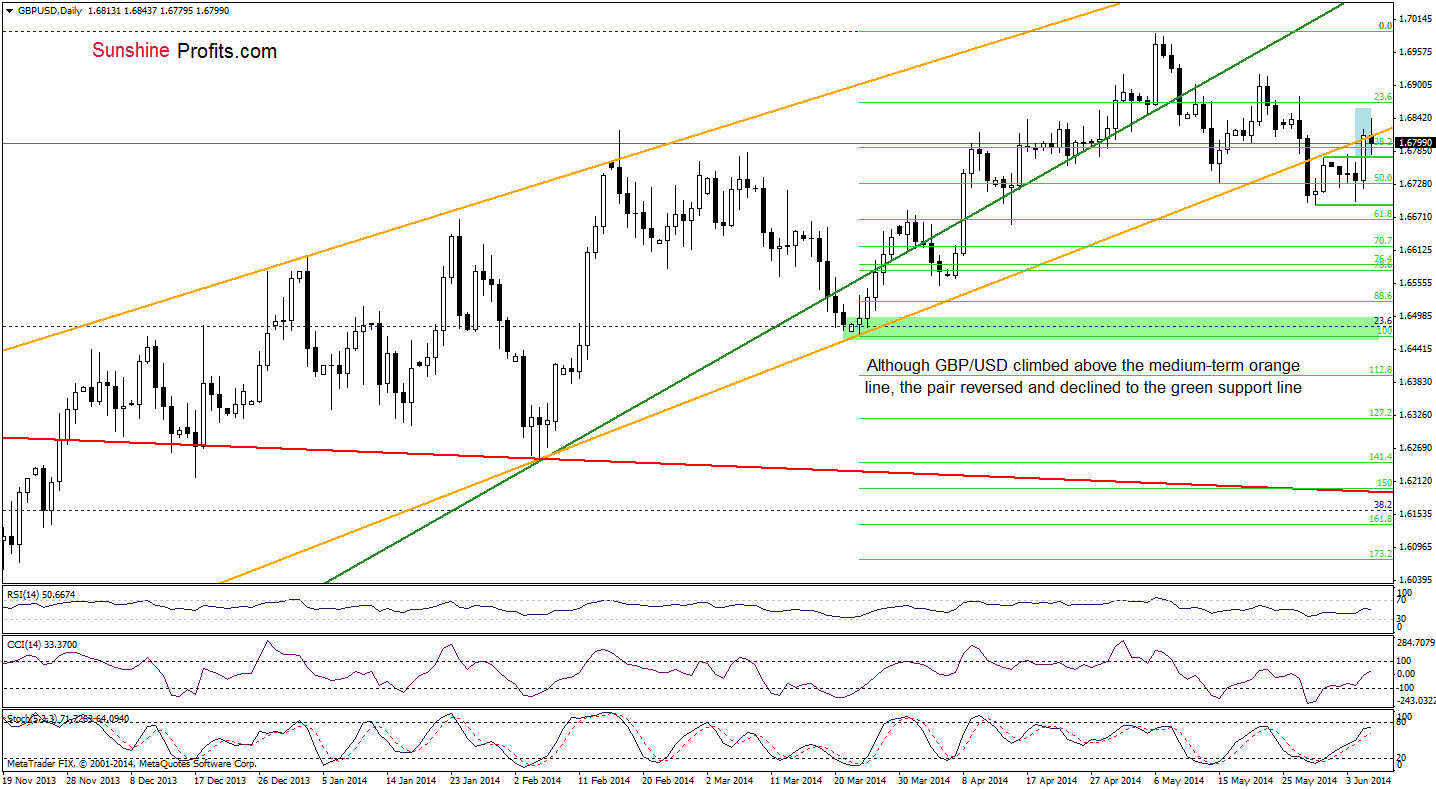
Looking at the above chart, we see that GBP/USD bounced off the May low and broke above the medium-term orange resistance line. Although this was a strong bullish signal, currency bulls didn’t manage to hold gained levels and the exchange rate reversed, invalidating the breakout. This is a strong bearish signal and it seems to us that if the pair closes the day below this line, we’ll see further deterioration – especially if GBP/USD declines below the green support line based on the May 30 high. In our opinion, if we see such price action, the first downside target will be the May low of 1.6691. Nevertheless, if the pair moves higher and comes back above the orange line, the next upside target will be around 1.6880, where the May 23 and May 27 highs are.
Very short-term outlook: mixed with bearish bias
Short-term outlook: mixed with bearish bias
MT outlook: bearish
LT outlook: mixed
Trading position (short-term): In our opinion, no positions are justified from the risk/reward perspective. We will keep you informed should anything change, or should we see a confirmation/invalidation of the above.
USD/JPY
On Tuesday, we wrote the following:
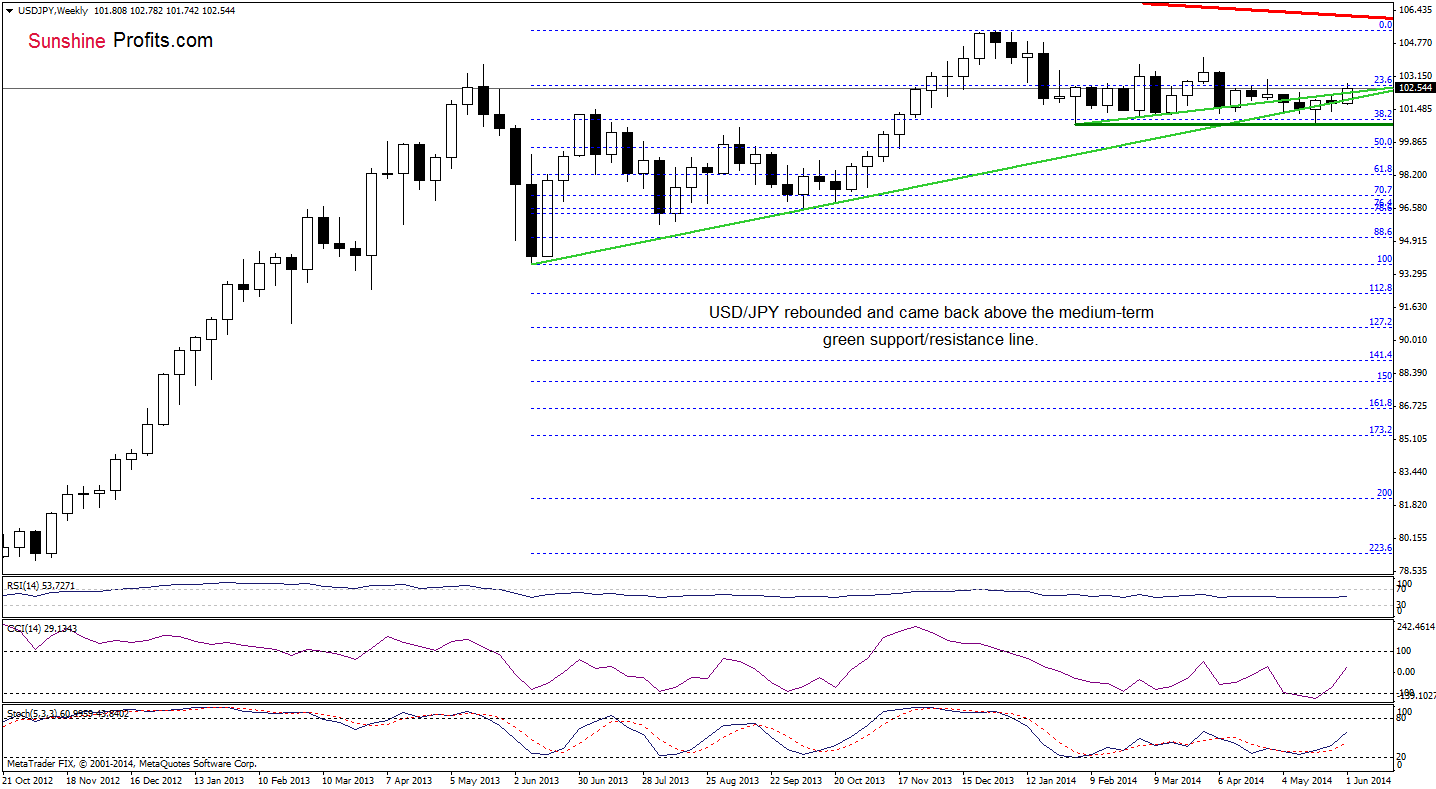
(…) USD/JPY reversed (after a small drop below the medium-term support line) and climbed above the short-term green resistance line. So far, this move is barely visible, but if currency bulls do not give up, we may see further improvement as buy signals remain in place.
As you see on the weekly chart, the situation hasn’t change much as USD/JPY remains above both green lines. From this perspective, it seems that the next upside target will be around 103, where the 50% Fibonacci retracement based on the entire decline is. Please note that the current position of the indicators still supports the bullish case.
Let’s take a closer look at the short-term picture.
Quoting our last commentary on this currency pair:
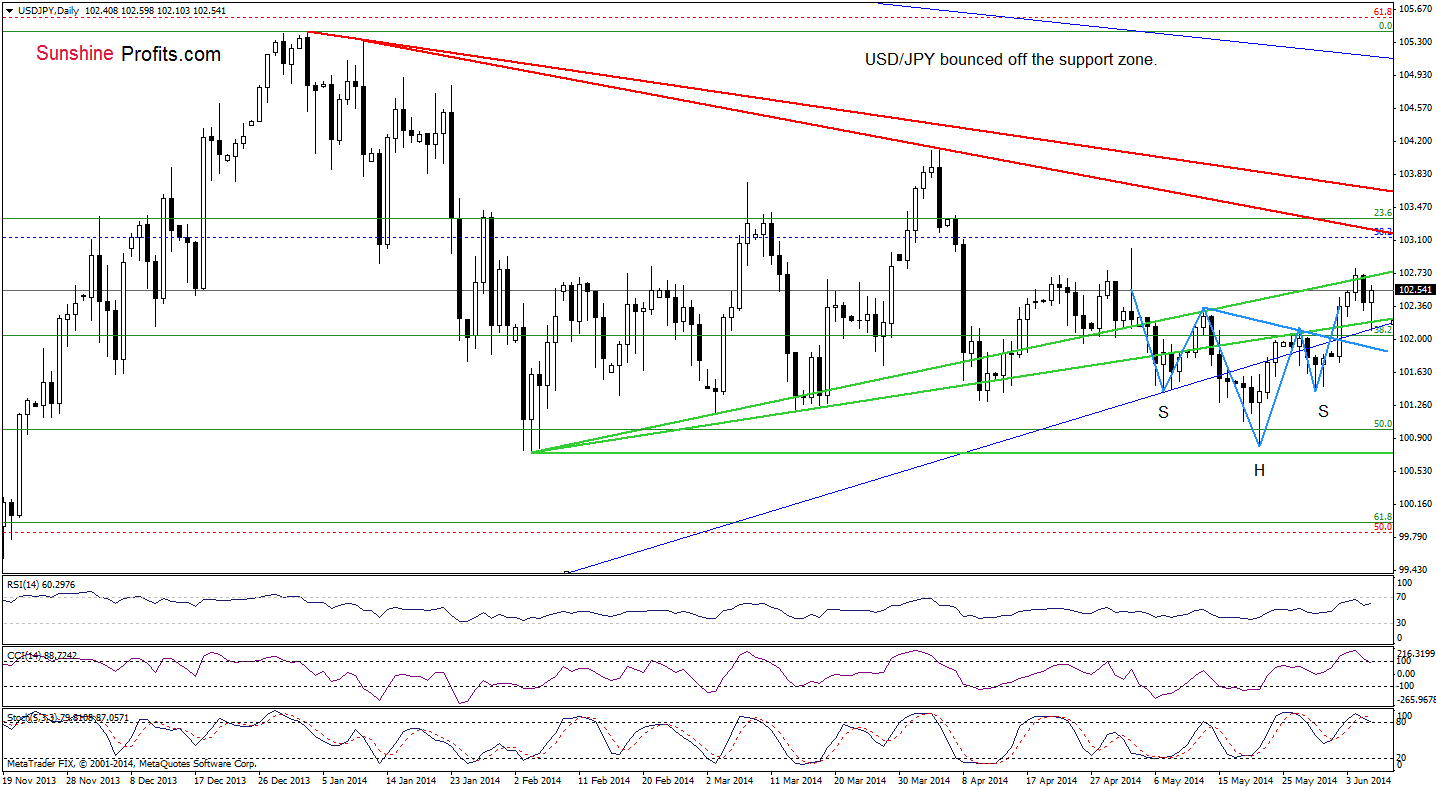
(…) the exchange rate reversed, invalidating the breakout earlier today, which is a bearish signal. Additionally, the CCI and Stochastic Oscillator are overbought, while the RSI declined from the level of 66, which together suggest that further correction is just around the corner. If this is the case, we will see a drop to the support area created by the medium-term blue rising line and the previously-broken lower green line (which serves as support around 102.14. In our opinion, it’s important what kind of price action we’ll see there. Why? If the support zone holds, the pair will rebound and we’ll see another attempt to break above the upper green resistance line.
Earlier today, we noticed such price action as the pair approached the upper green resistance line. Although this is a bullish sing, it seems to us that as long as there is no breakout above this resistance another attempt to test the strength of the support zone can’t be ruled out – especially when we take into account the current position of the indicators (the CCI and Stochastic Oscillator are very close to generating sell signals). However, if the exchange rate successfully breaks the short-term green line, we’ll see an increase to around 103.22, where the red declining resistance line is. As a reminder, if the support zone doesn’t withstand the selling pressure, we’ll see an invalidation of the reversed head and shoulders formation, which may result in a correction to the May 29 low (or even to the May low of 100.81).
Very short-term outlook: mixed
Short-term outlook: mixed
MT outlook: mixed
LT outlook: bearish
Trading position (short-term): In our opinion no positions are justified from the risk/reward perspective at the moment. We will keep you informed should anything change, or should we see a confirmation/invalidation of the above.
USD/CAD
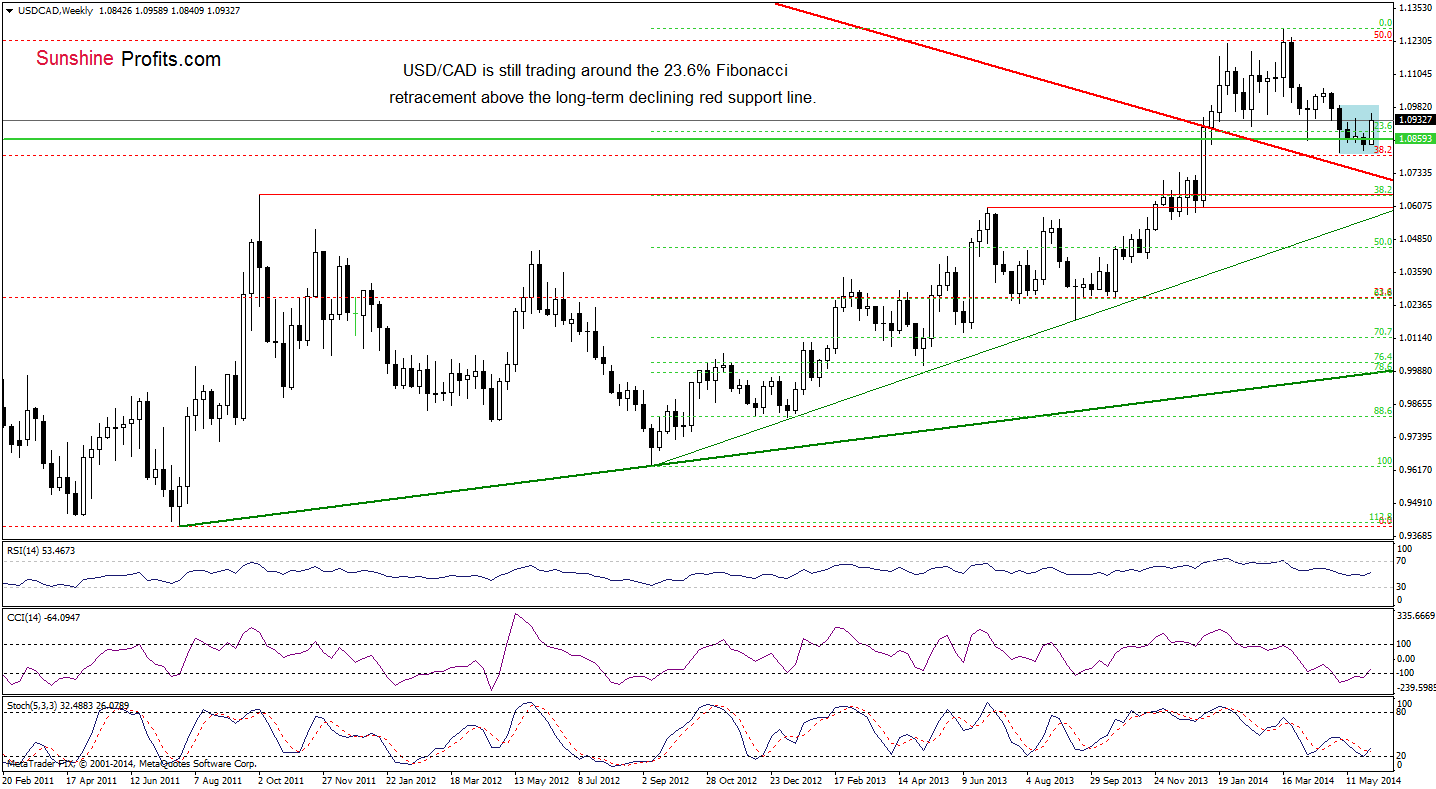
The medium-term outlook hasn’t changed much as USD/CAD remains in a consolidation around the 23.6% Fibonacci retracement and the 2010 high. Therefore, it seems doubtful that we’ll see another sizable move before an earlier breakout above the upper line of the formation (or a breakdown below the lower line).
What can we infer from the daily chart?
On Wednesday, we wrote the following:
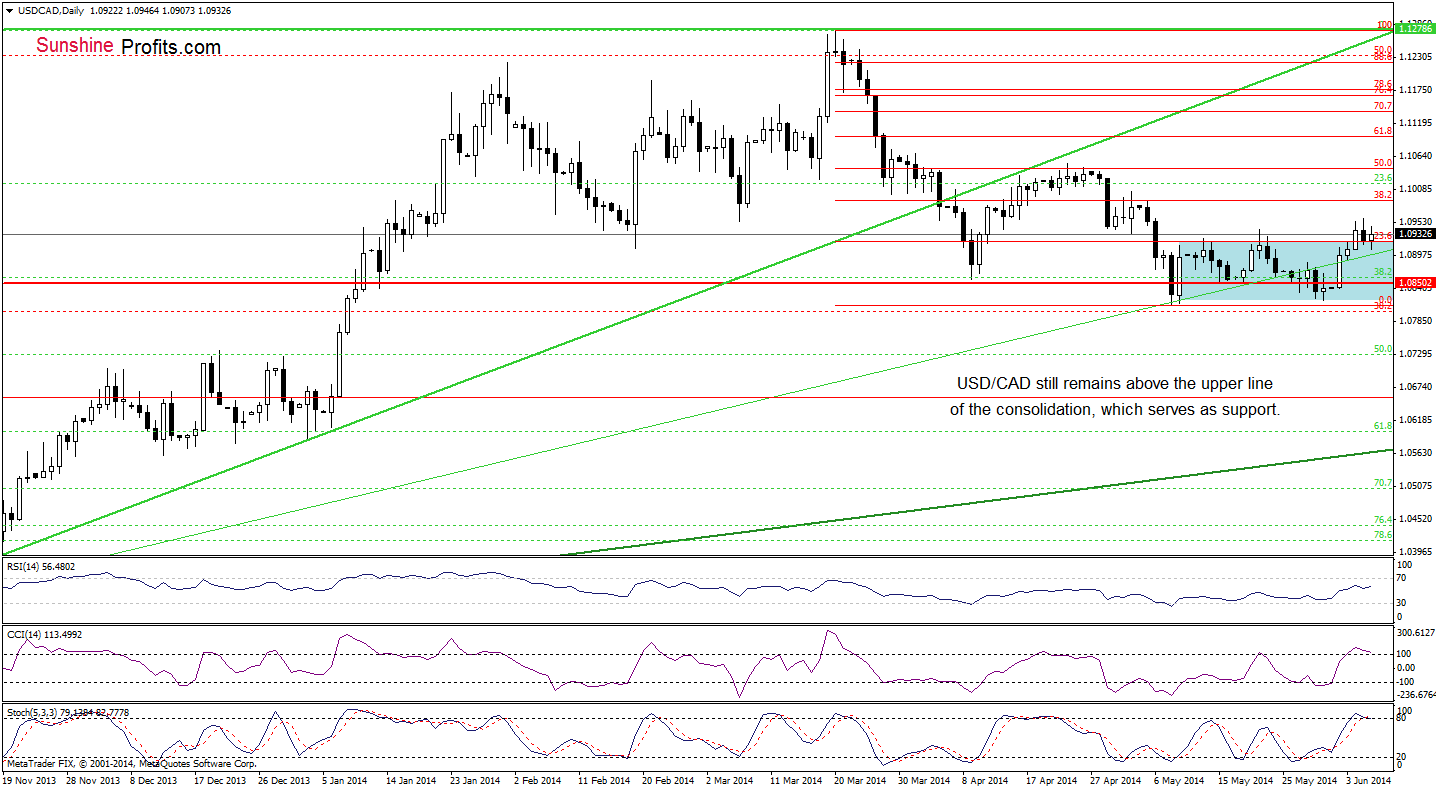
(…) USD/CAD successfully broke not only above the upper border of the consolidation, but also above the May 21 high earlier today. This is a bullish signal, which together with buy signals generated by the indicators suggests that we’ll see further improvement. If the exchange rate doesn’t invalidate the breakout, we think that the above-mentioned upside target (around 1.0987) will be in play.
Looking at the above chart, we see that the exchange rate still remains above the previously-broken upper line of the consolidation, which serves as support. So far, the breakout was not invalidated, therefore what we wrote on Wednesday is up-to-date. Nevertheless, we should keep in mind that the CCI and Stochastic Oscillator are very close to generating sell signals, which may hinder the realization of the above-mentioned pro-growth scenario.
Very short-term outlook: bullish
Short-term outlook: mixed with bullish bias
MT outlook: mixed
LT outlook: bearish
Trading position (short-term): In our opinion no positions are justified from the risk/reward perspective as the space for further declines may be limited. We will keep you informed should anything change, or should we see a confirmation/invalidation of the above.
USD/CHF
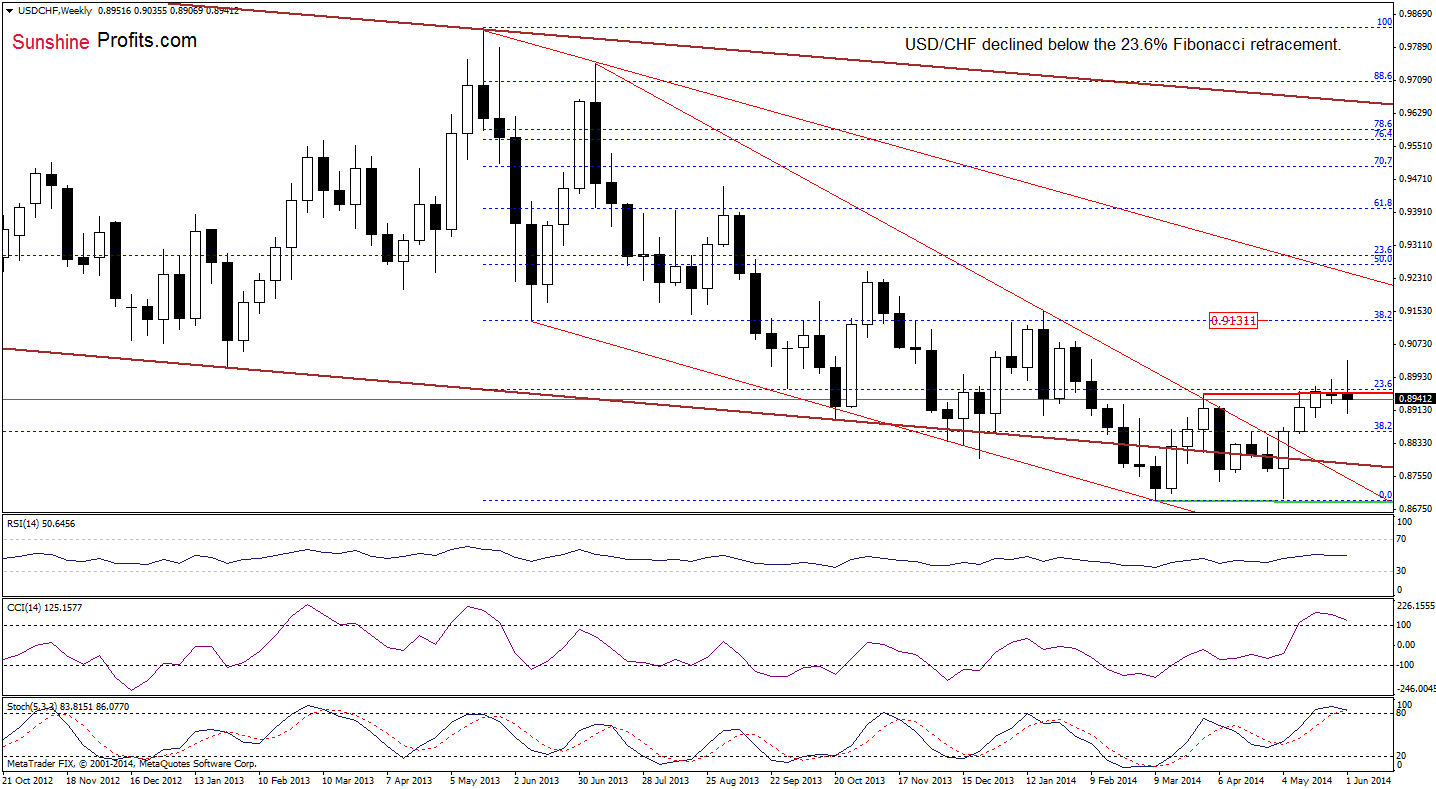
From the weekly perspective, we see that the situation in the madium term has deteriorated as USD/CHF invalidated the breakout above the previous-high, declining below the 23.6% Fibonaci retracement. As we have pointed out before, an invalidation of the breakout is a strong bearish signal, which suggests further deterioration. At this point, it’s worth noting that the CCI and Stochastic Oscillator are overbought, which reinforces the bearish scenario at the moment.
What is the short-term picture? Let’s check.
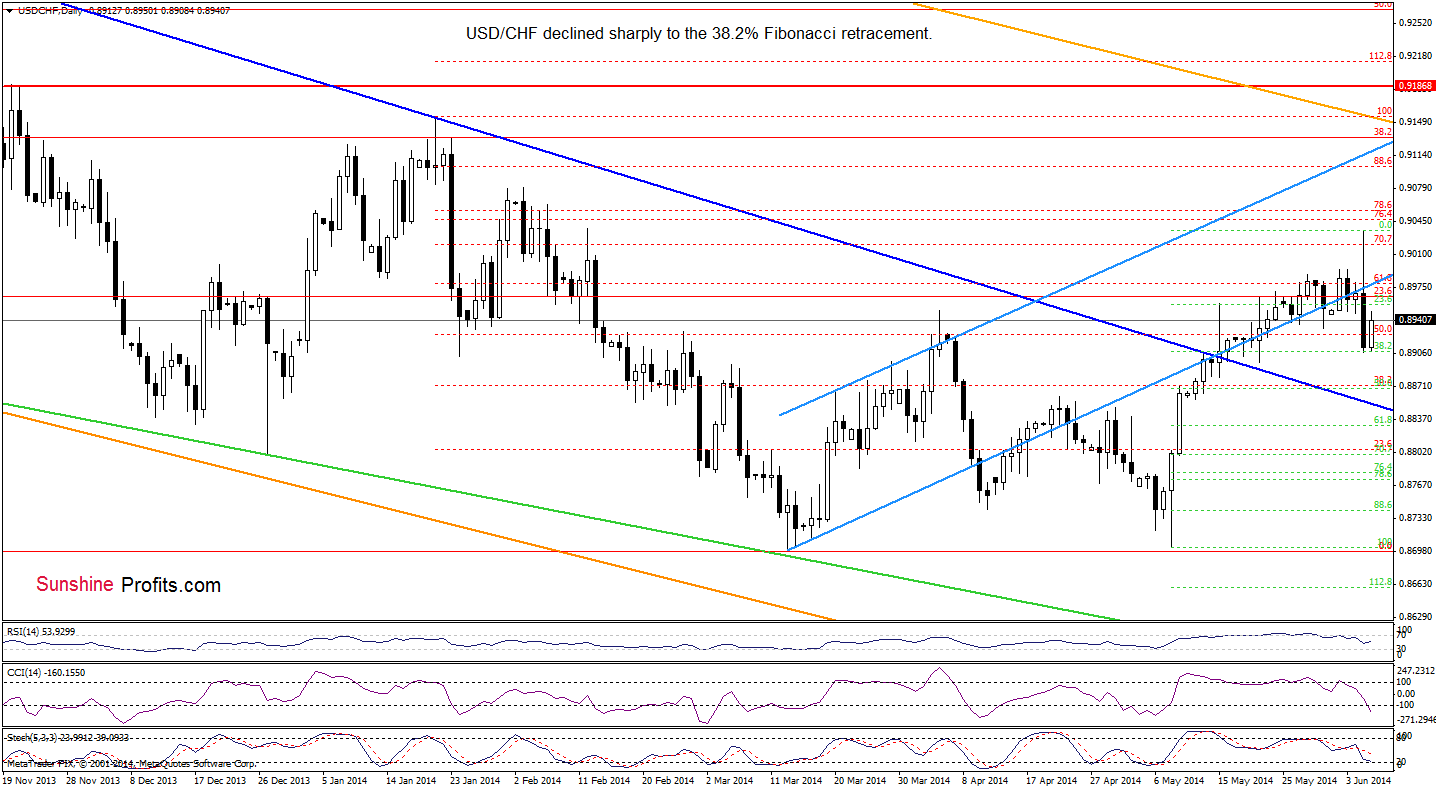
As you see on the above chart, although USD/CHF extended gains, reaching the 70.7% Fibonacci retracement, the pair reversed and declined sharply invalidating the breakout above the previous highs. This strong bearish signal triggered further deterioration and the exchange rate declined to the 38,2% Fibonacci retracement based on the recent rally. Looking at the daily chart, we see that although the exchange rate bounced off this support level, it still remains below the blue resistance line. In our opinion, as long as this line is in play another attempt to move lower can’t be ruled out – especially when we take into account the fact that sell signals remain in place. On the other hand, as long as the Fibonacci retracement holds, the space for further declines seems limited.
Very short-term outlook: bearish
Short-term outlook: mixed with bearish bias
MT outlook: mixed with bullish bias
LT outlook: bearish
Trading position (short-term): In our opinion no positions are justified from the risk/reward perspective. We will keep you informed should anything change, or should we see a confirmation/invalidation of the above.
AUD/USD
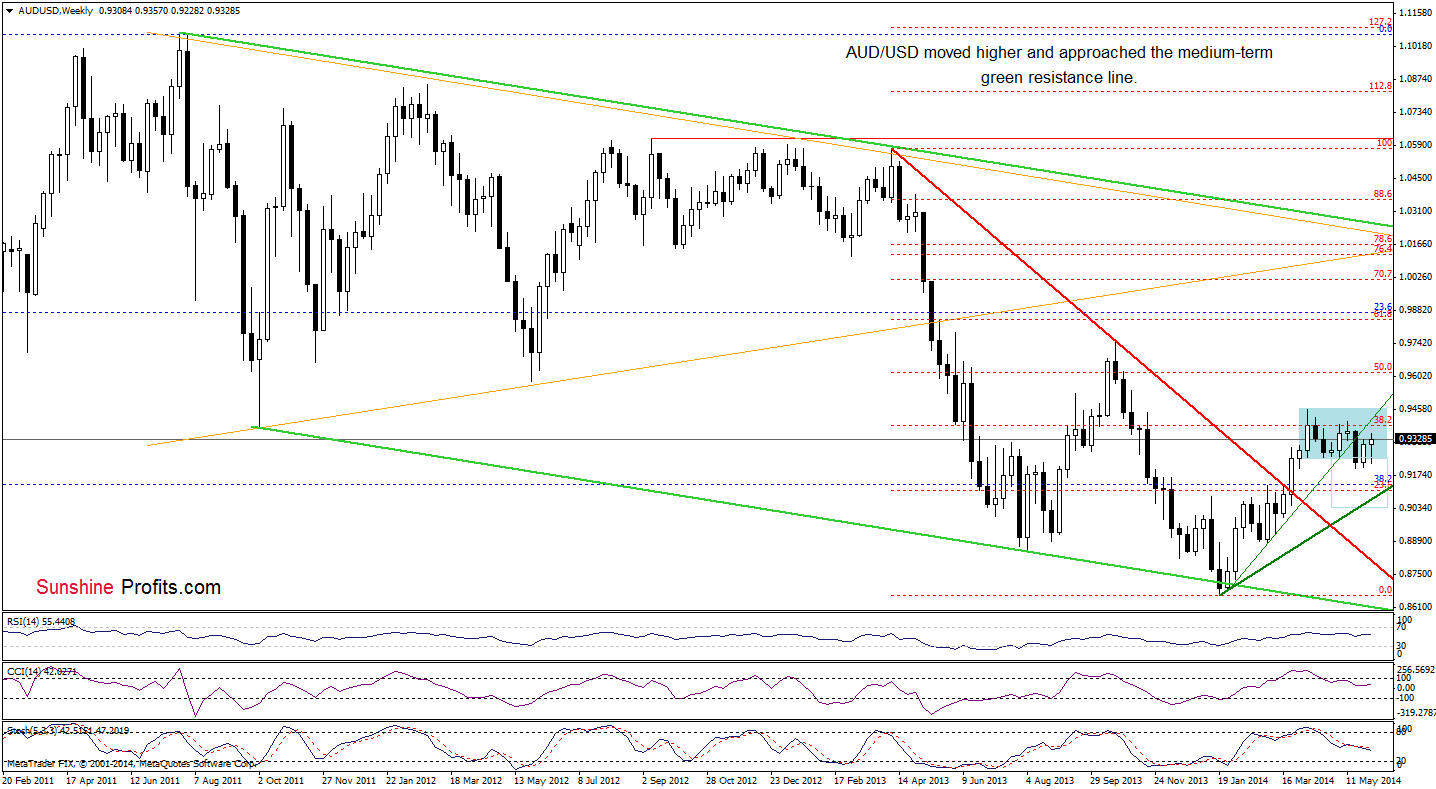
Although the situation in the medium term improved slightly as AUD/USD bounced off the lower line o the consolidation, the pair still remains below the previously-broken green resistance line. Additionally, sell signals generated by the indicators remain in place, suggesting that another attempt to move lower can’t be ruled out.
Having say that, let’s examine the daily chart.
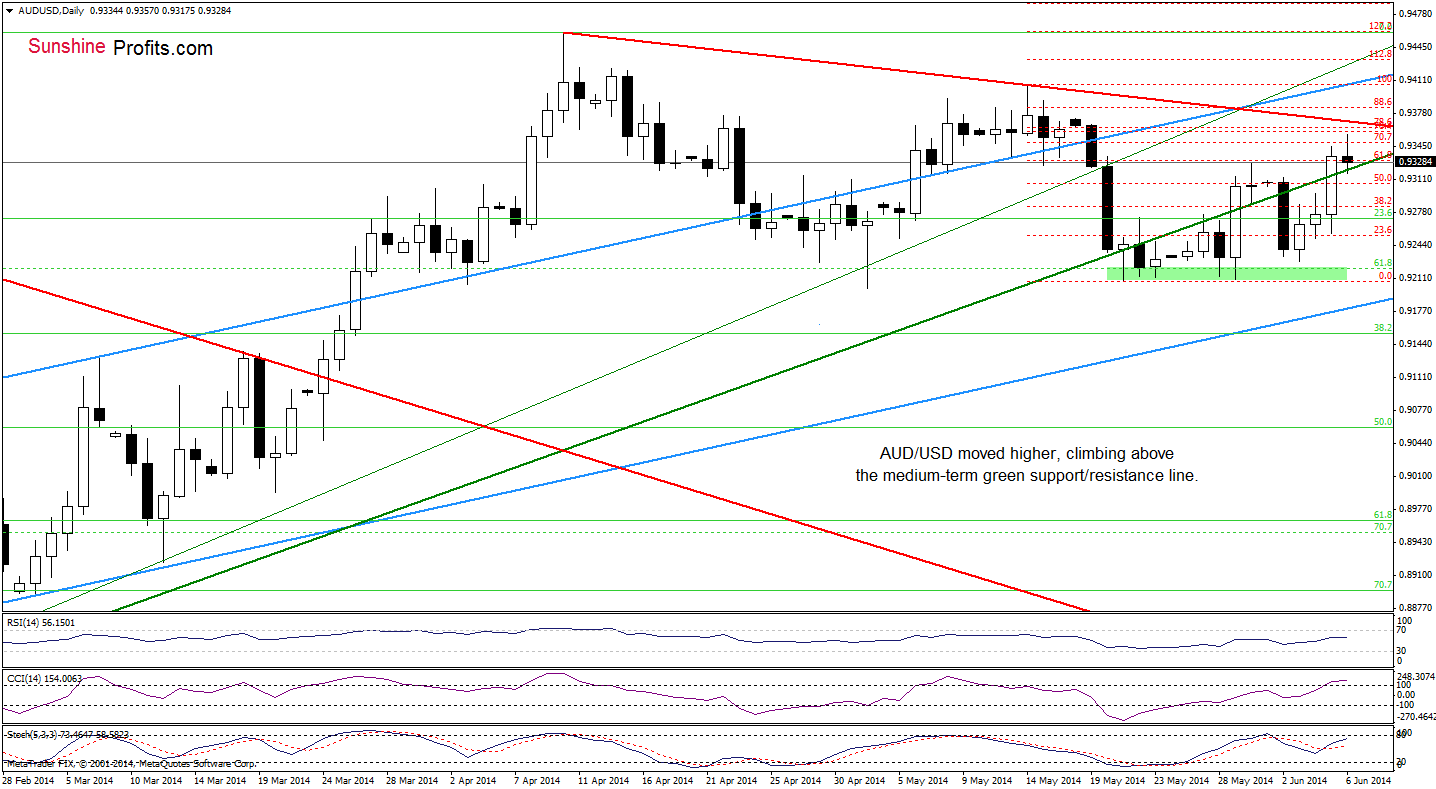
Looking at the daily chart, we see that the very short-term situation has improved as AUD/USD came back above the green medium-term support/resistance line. Despite this fact, the resistance zone created by the 76.4% and the 78.6% Fibonacci retracement levels and the red declining resistance line successfully stopped further improvement, triggering a pullback earlier today. As you see on the daily chart, with this downswing the pair reached the key support/resistance line. On one hand, if it holds, we’ll see another try to climb above the resistance zone. However, if it is broken, we’ll see a drop to yesterday’s low of 0.9256 or even a re-test of the strength of the support zone created by the May lows (marked with green).
Very short-term outlook: mixed
Short-term outlook: mixed
MT outlook: bearish
LT outlook: bearish
Trading position (short-term; our opinion): In our opinion no positions are justified from the risk/reward perspective as the space for further declines may be limited. We will keep you informed should anything change, or should we see a confirmation/invalidation of the above.
Thank you.
Nadia Simmons
Forex & Oil Trading Strategist
Przemyslaw Radomski, CFA
Founder, Editor-in-chief
Gold & Silver Trading Alerts
Forex Trading Alerts
Oil Investment Updates
Oil Trading Alerts

