
Earlier today, official data showed that retail sales in the euro zone rose 0.4% in April, beating expectations of a 0.1% uptick. Additionally, a separate report showed that German factory orders rose 3.1% in April, well above expectations for a 1.3% increase, after a 2.8% decline the previous month. Thanks to this news, EUR/USD rebounded from the previous session’s low. Does this upswing change the very short-term outlook?
In our opinion the following forex trading positions are justified - summary:
EUR/USD
The medium-term picture hasn’t changed much as EUR/USD remains between last week’s high and low. Today, we’ll focus only on the short-term changes.
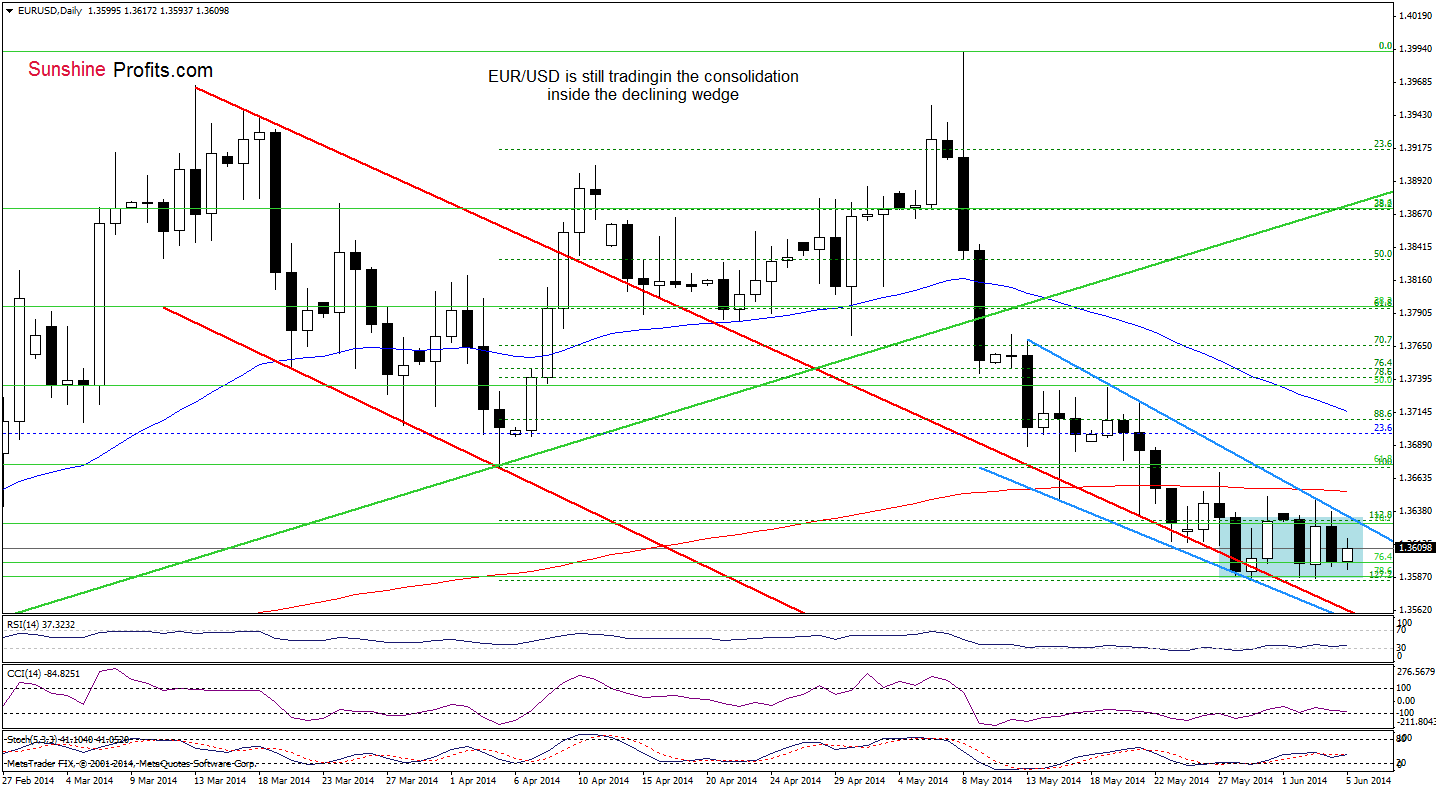
Looking on the daily chart, we see that the sitation in the very short-term hasn’t changed much as EUR/USD is still trading in a narrow range between the support zone created by the 76.4% and 78.6% Fibonacci retracement levels and the resistance zone based on the 200-day moving average and the upper line of the declining wedge. Therefore, what we wrote yesterday is up-to-date:
(...) In our opinion, as long as there is no breakout above this resistance area (or breakdown below the 78.6% Fibonacci retracement), we won’t see another sizable move. At this point ist’s worth noting that if we see a breakout, the next upside target will be around 1.3720, where the 50-day moving average is. On the other hand, if the pair extends losses, we’ll see another re-test of the strength of the upper line of the declining trend channel (currently around 1.3570) or even a drop to around 1.3540, where the 88.6% Fibonacci retracement (based on the entire Feb.-May rally) meets the 141.4% Fibonacci extension (based on the Apr.-May rally).
Very short-term outlook: mixed
Short-term outlook: bearish
MT outlook: bearish
LT outlook: bearish
Trading position (short-term; our opinion): In our opinion no positions are justified from the risk/reward perspective as the space for further declines may be limited. We will keep you informed should anything change, or should we see a confirmation/invalidation of the above.
USD/JPY
Let’s take a closer look at the short-term picture. Will it give us any clues about next moves?
Quoting our last commentary on this currency pair:
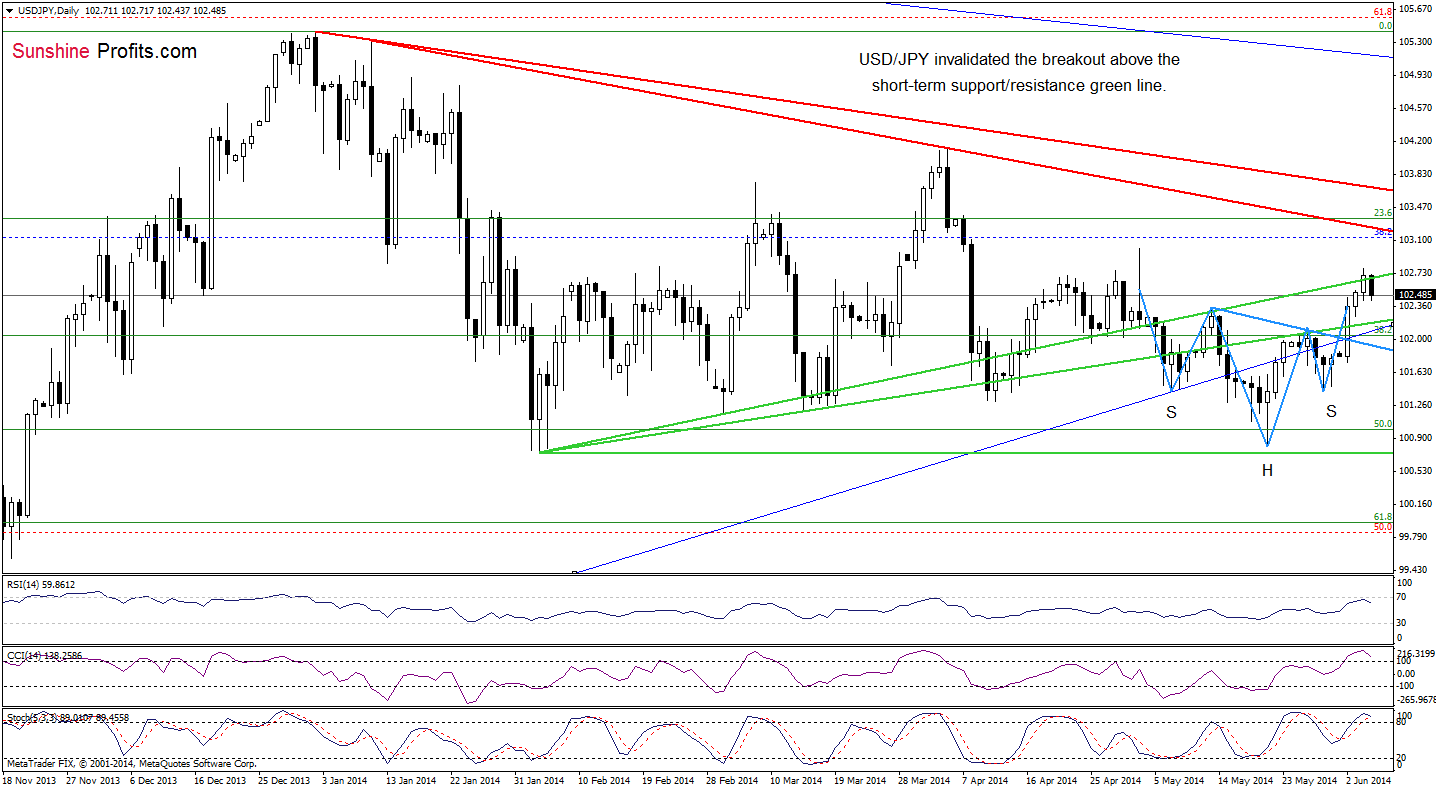
(…) we noticed a reverse head and shoulders formation. Therefore, we think that if yesterday’s breakout is not invalidated, we’ll see an increase even to around 103.30, where the red declining resistance line is.
Looking at the above chart, we see that although USD/JPY didn’t reached the above-mentioned upside target, the pair extended gains and climbed to slightly above the upper green resistance line. As you see on the daily chart, despite this improvement, the exchange rate reversed, invalidating the breakout earlier today, which is a bearish signal. Additionally, the CCI and Stochastic Oscillator are overbought, while the RSI declined from the level of 66, which together suggest that further correction is just around the corner. If this is the case, we will see a drop to the support area created by the medium-term blue rising line and the previously-broken lower green line (which serves as support around 102.14. In our opinion, it’s important what kind of price action we’ll see there. Why? If the support zone holds, the pair will rebound and we’ll see another attempt to break above the upper green resistance line. However, if it is broken, we’ll see a drop to the neck line of the above-mentioned reversed head and shoulders pattern. If it doesn’t withstand the selling pressure, we’ll see an invalidation of this pro-growth formation, which may result in a correction to the May 29 low (or even to the May low of 100.81).
Very short-term outlook: mixed
Short-term outlook: mixed
MT outlook: mixed
LT outlook: bearish
Trading position (short-term): In our opinion no positions are justified from the risk/reward perspective at the moment. We will keep you informed should anything change, or should we see a confirmation/invalidation of the above.
AUD/USD
The situation in the medium term remains unchanged as AUD/USD is still trading in the consolidation range, well below the previously-broken green resistance line, while sell signals generated by the indicators remain in place, supporting the bearish case.
Having say that, let’s examine the daily chart.
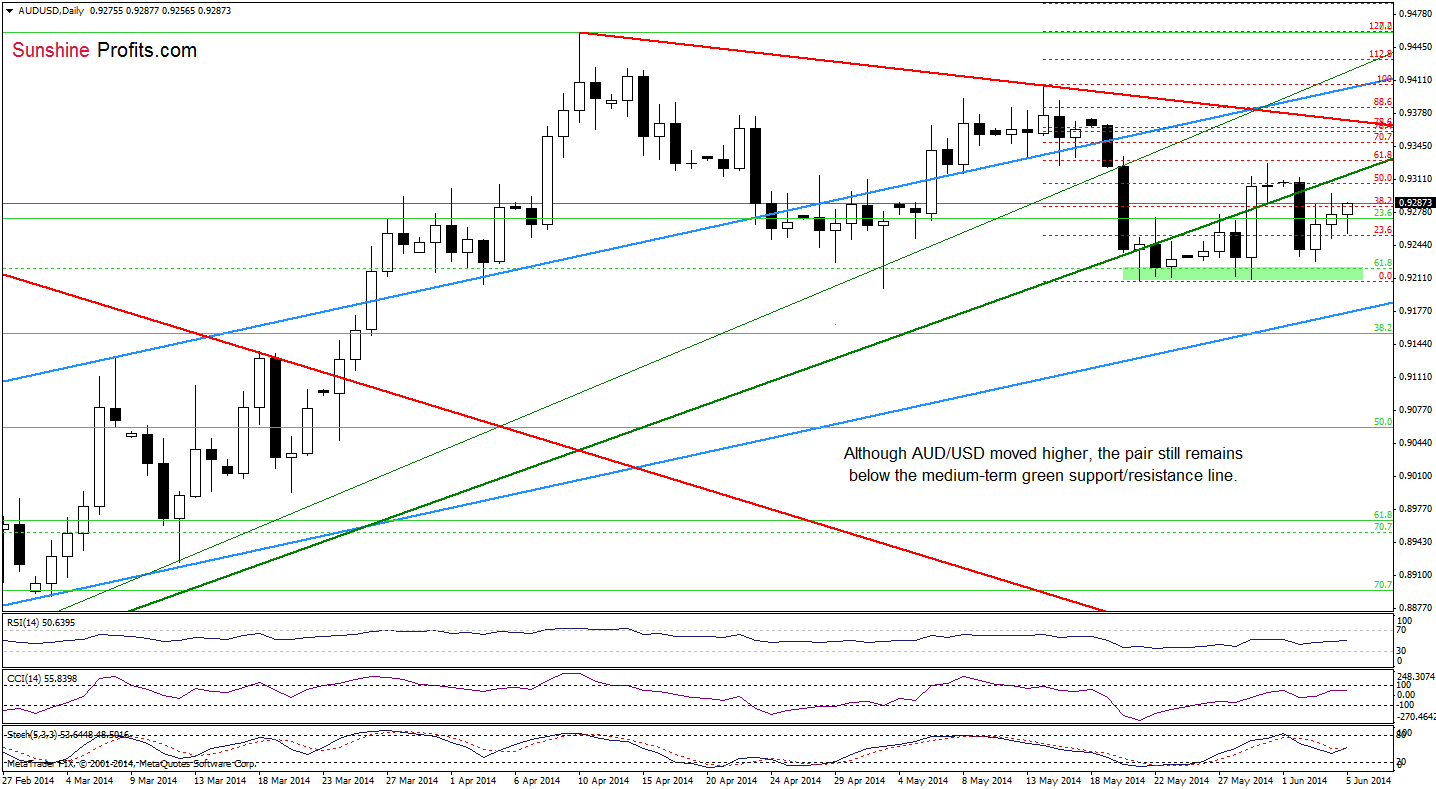
Looking at the daily chart, we see that the very short-term situation hasn’t changed as the pair remains between yesterday’s high and low. Therefore, what we wrote in our last Forex Trading Alert is up-to-date:
(…) although AUD/USD moved higher, the proximity to the previously-broken medium-term green line triggered a pullback (…). Therefore, we still believe that as long as this nearest resistance line is in play, another attempt to move lower can’t be ruled out. Please note that if the exchange rate extends losses, we will see another test of the strength of the support zone created by the May lows (marked with green).
Very short-term outlook: bearish
Short-term outlook: bearish
MT outlook: bearish
LT outlook: bearish
Trading position (short-term; our opinion): In our opinion no positions are justified from the risk/reward perspective as the space for further declines may be limited. We will keep you informed should anything change, or should we see a confirmation/invalidation of the above.
Thank you.
Nadia Simmons
Forex & Oil Trading Strategist
Przemyslaw Radomski, CFA
Founder, Editor-in-chief
Gold & Silver Trading Alerts
Forex Trading Alerts
Oil Investment Updates
Oil Trading Alerts

