
Earlier today, the Institute of Supply Management reported that its manufacturing PMI ticked down to 53.2 in the previous month, missing expectations for a rise to 55.5. Despite this disappointing data, the common currency remains under pressure as forex traders remains cautious ahead of the European Central Bank's monthly policy meeting later this week. Because of these circumstances, EUR/USD is still trading between the support and resistance zone. Which of them will be stronger and trigger another sizable move?
In our opinion the following forex trading positions are justified (stop-loss order levels were adjusted) - summary:
- EUR/USD: short (stop-loss order: 1.3680)
- GBP/USD: none
- USD/JPY: none
- USD/CAD: none
- USD/CHF: none
- AUD/USD: short (stop-loss order: 0.9340)
EUR/USD
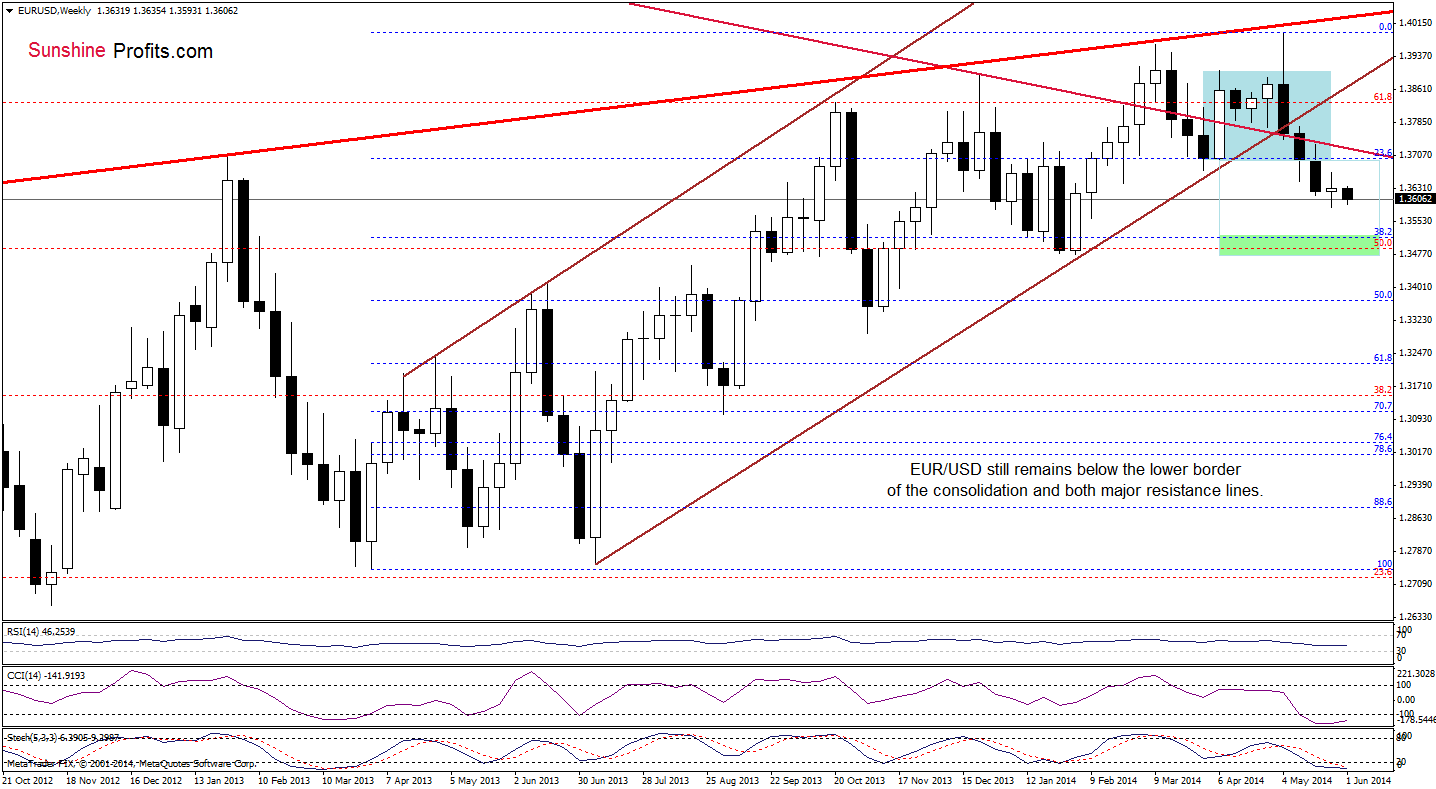
Looking at the weekly chart, we see that the situation in the medium term hasn’t changed much as EUR/USD remains between last week’s high and low. Therefore, what we wrote on Friday is up-to-date:
(…) exchange rate still remains not only below the previously-broken lower border of the consolidation, but also under the long-term declining line and the lower border of the rising trend channel (…) as long as there is no invalidation of the breakdown under these lines, further deterioration is likely. If this is the case, and the exchange rate extends losses in the coming week (or weeks), the downside target will be around 1.3516 (where the 38.2% Fibonacci retracement based on the entire March 2013-May 2014 is) or even slightly lower – around 1.3480, where the bottom of the previous bigger correction (between Dec. and Feb.) is.
Once we know the above, let’s focus on the daily chart.
On Friday, we wrote the following:
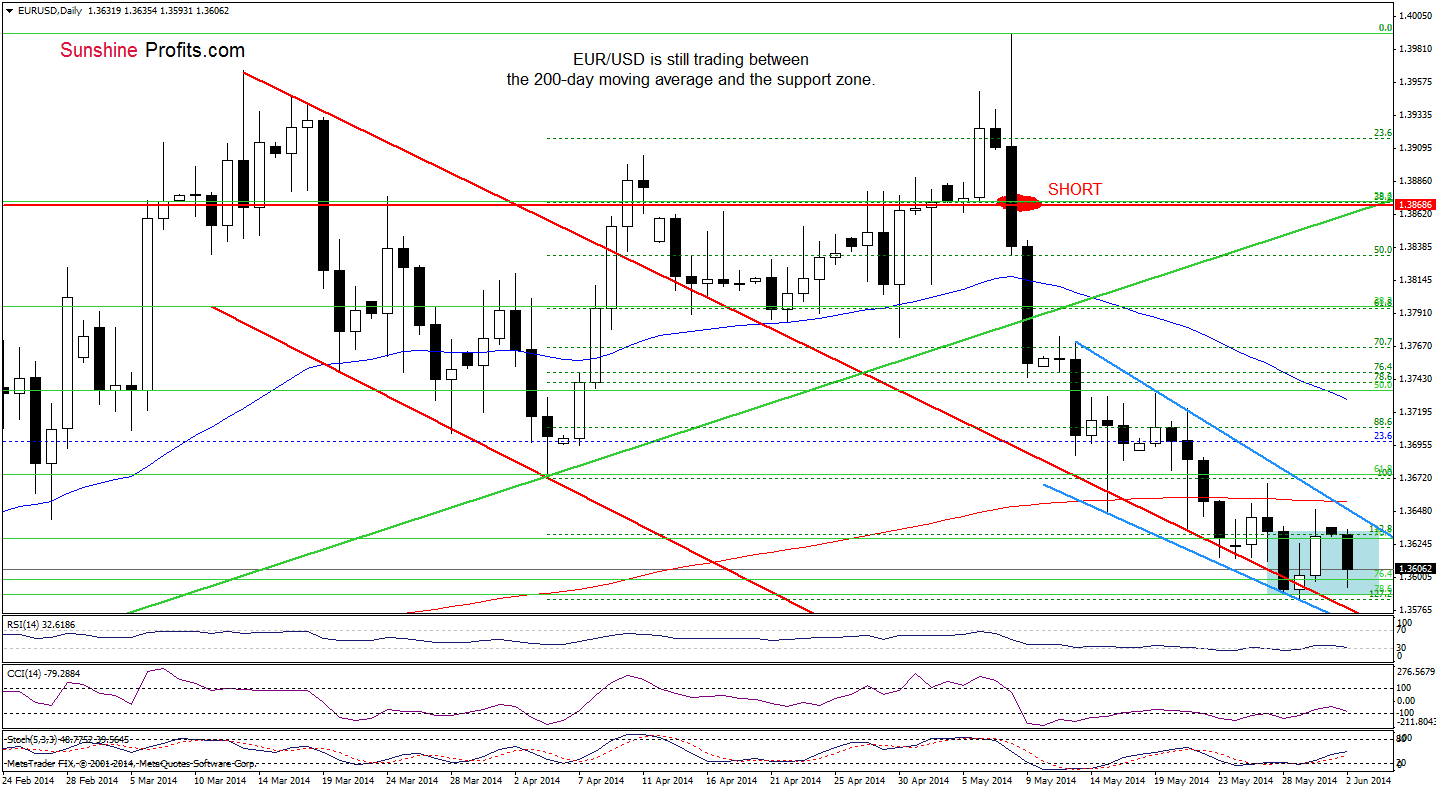
(…) EUR/USD approached the above-mentioned 200-day moving average(…) slightly above this moving average is also the upper line of the declining wedge, which together create a resistance zone. If it holds, we will likely see another re-test of the strength of the upper line of the declining trend channel.
Looking on the daily chart, we see that the proximity to the above-mentioned resistance zone triggered a sharp pullback earlier today. As a result, the exchange rate declined to the support zone created by the 76.4% and 78.6% Fibonacci retracement levels. If it withstands the selling pressure, we will see another attempt to reach the upper line of the declining wedge, which serves as nearest resistance (currently around 1.3648). At this point, it’s worth noting that slightly above this level is also the 200-day moving average (at 1.3655). However, if it is broken, we will see another re-test of the strength of the upper line of the declining trend channel (currently around 1.3578) or even a drop to around 1.3540, where the 88.6% Fibonacci retracement (based on the entire Feb.-May rally) meets the 141.4% Fibonacci extension (based on the Apr.-May rally).
Very short-term outlook: bearish
Short-term outlook: bearish
MT outlook: bearish
LT outlook: bearish
Trading position (short-term; our opinion): Short. Stop-loss order: 1. 1.3680. We are adjusting the stop-loss level in case we see a strong move lower in the USD Index (for instance based on its cyclical turning point), even though it seems we will see it after a short period of gains. Actually, we could call it a reverse profit-take level, as even if the order is realized, it will simply mean taking profits from a profitable position. We will keep you informed should anything change, or should we see a confirmation/invalidation of the above.
USD/CAD
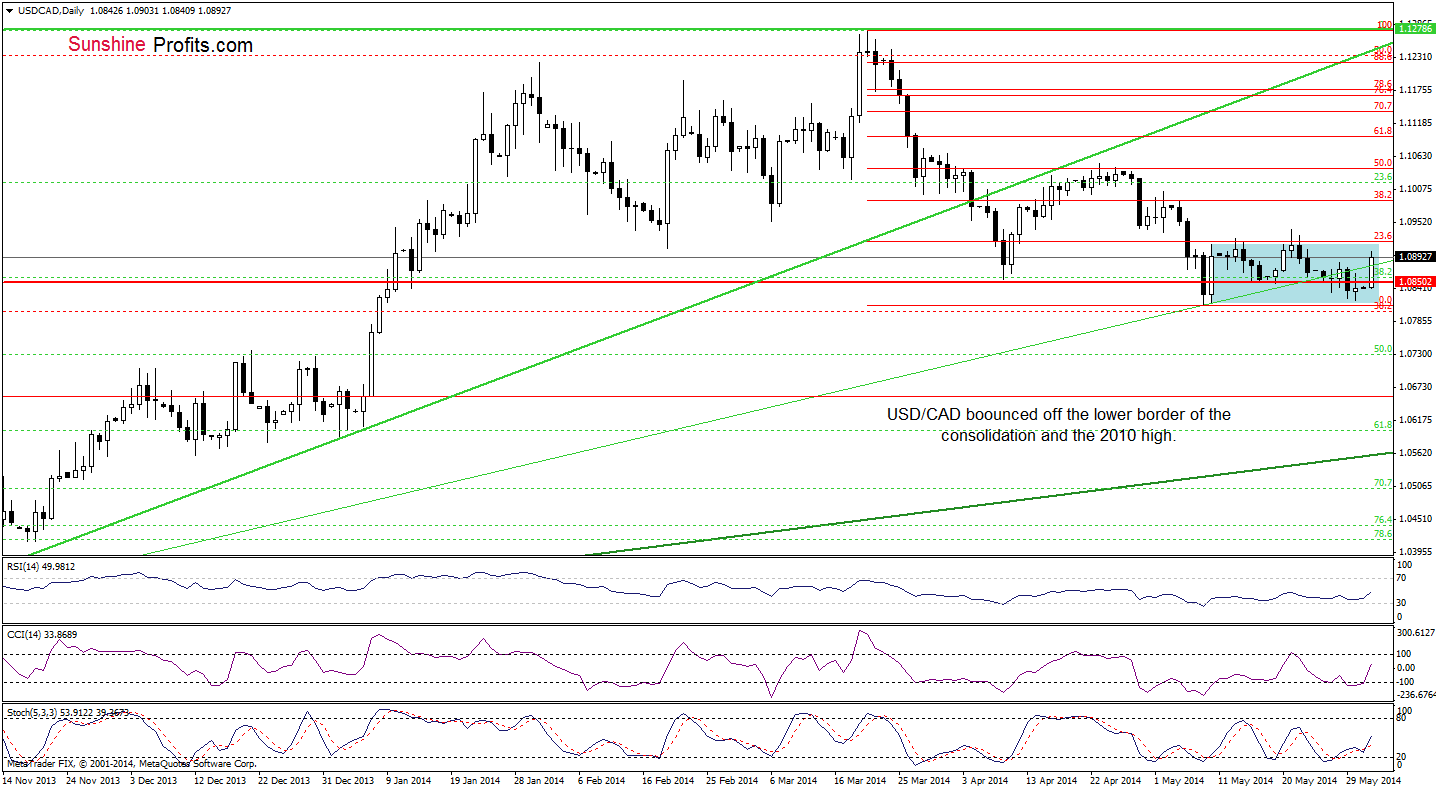
From the medium-term perspective, the overall situation hasn’t changed much as USD/CAD remains in a consolidation around the 23.6% Fibonacci retracement and the 2010 high. Therefore, it seems doubtful that we’ll see another sizable move before an earlier breakout above the upper line of the formation (or a breakdown below the lower line).
What can we infer from the daily chart?
Quoting our last Forex Trading Alert:
(…) If the lower border of the consolidation holds, we will see a rebound and a try to come back above the green line, which serves as resistance at the moment.
As you see on the above chart, we noticed such price action earlier today. As a result, USD/CAD climbed above the medium-term support/resistance line, invalidating the earlier breakdown. This is a strong bullish signal, which suggests that we will likely see further improvement and another attempt to move above the upper line of the consolidation (marked with blue). If currency bulls do not fail this time, and we’ll see a breakout, the next upside target will be around 1.0987, where the 38.2% Fibonacci retracement based on the entire March-May decline is. Please note that buy signals remain in place, supporting the bullish case.
Very short-term outlook: mixed with bullish bias
Short-term outlook: mixed
MT outlook: mixed
LT outlook: bearish
Trading position (short-term): In our opinion no positions are justified from the risk/reward perspective as the space for further declines may be limited. We will keep you informed should anything change, or should we see a confirmation/invalidation of the above.
AUD/USD
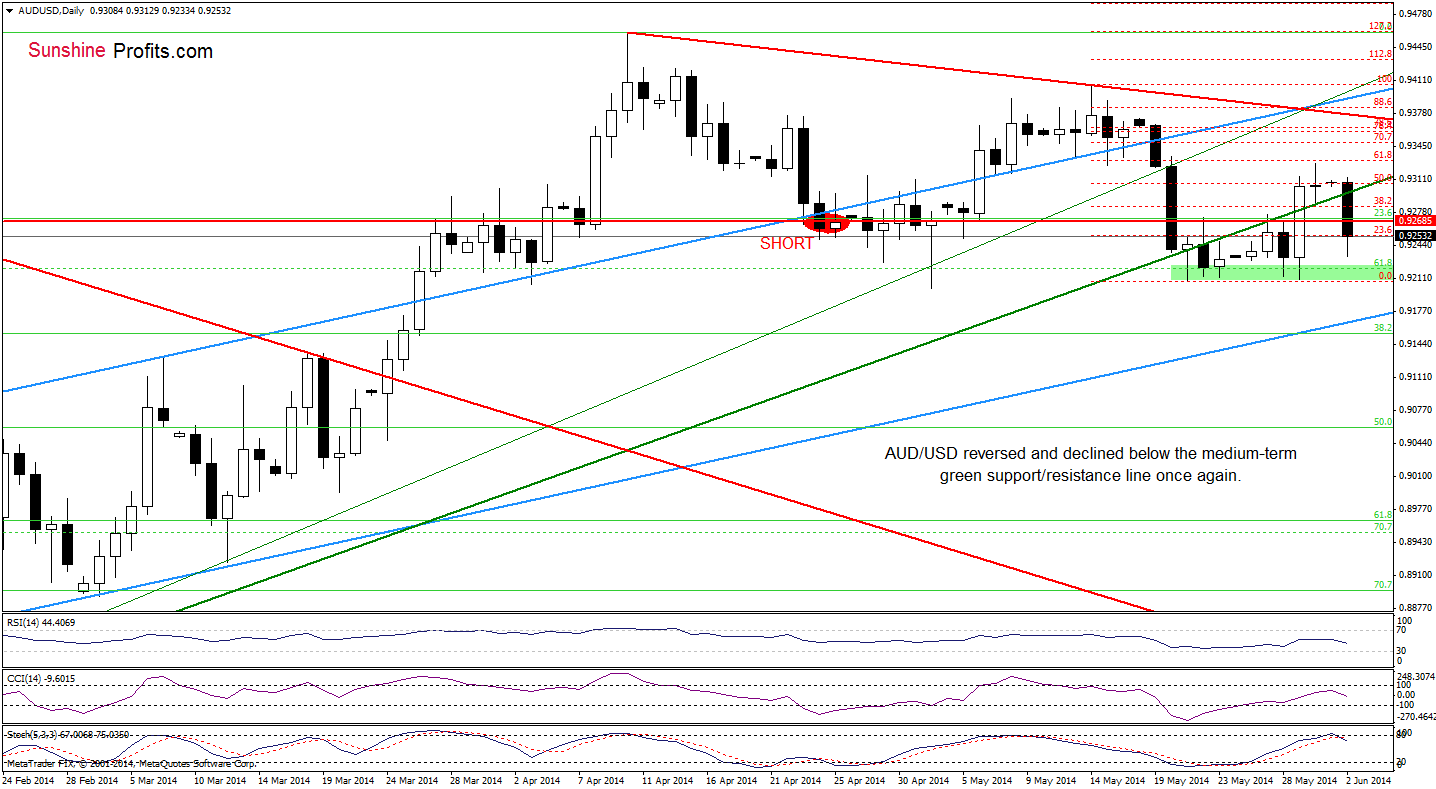
The medium-term situation hasn’t changed much as AUD/USD is still trading in the consolidation range, well below the previously-broken green resistance line, while sell signals generated by the indicators remain in place, supporting the bearish case.
Having say that, let’s focus on the short-term picture.
In our last Forex Trading Alert, we wrote the following:
(…) although AUD/USD remains above the medium-term green support/resistance line, the 61.8% Fibonacci retracement based on the recent declines stopped gains. (…) the exchange rate reversed, approaching the previously-broken green line (…) if AUD/USD drops below this green line, we’ll see further deterioration in the coming days and the initial downside target will be a resistance zone created by the May and yesterday’s lows.
Looking at the daily chart, we see that the situation has deteriorated significantly as AUD/USD declined below the medium-term green support/resistance line once again. Additionally, the RSI and CCI reversed, while the Stochastic Oscillator generated a sell signal, supporting the above-mentioned bearish scenario. In our opinion, if the support area is broken, the next downside target will be the blue rising support line (currently around 0.9165).
Very short-term outlook: bearish
Short-term outlook: bearish
MT outlook: bearish
LT outlook: bearish
Trading position (short-term; our opinion): Short (the area where it was opened we marked with a red ellipse). Stop-loss order: 0. 9340. We are adjusting the stop-loss level in case we see a strong move lower in the USD Index (for instance based on its cyclical turning point), even though it seems we will see it after a short period of gains. We will keep you informed should anything change, or should we see a confirmation/invalidation of the above.
Thank you.
Nadia Simmons
Forex & Oil Trading Strategist
Przemyslaw Radomski, CFA
Founder, Editor-in-chief
Gold & Silver Trading Alerts
Forex Trading Alerts
Oil Investment Updates
Oil Trading Alerts

