
Earlier today, the Bank of Japan left monetary policy on hold (the central bank will continue to expand the monetary base at a pace of ¥60 trillion to ¥70 trillion per year), refraining from enlarging its stimulus program. Additionally, official data showed that Japan’s trade deficit narrowed to ¥808.9 billion, compared to a forecast of a deficit of ¥640.0 billion. In reaction to this news, the U.S. dollar hit a 3-1/2 month low against yen and declined below its nearest support level, approaching the February low. What’s next? Breakdown or rebound?
In our opinion the following forex trading positions are justified - summary:
- EUR/USD: short (stop-loss order: 1.4040)
- GBP/USD: none
- USD/JPY: none
- USD/CAD: none
- USD/CHF: none
- AUD/USD: short (stop-loss order: 0.9410)
EUR/USD
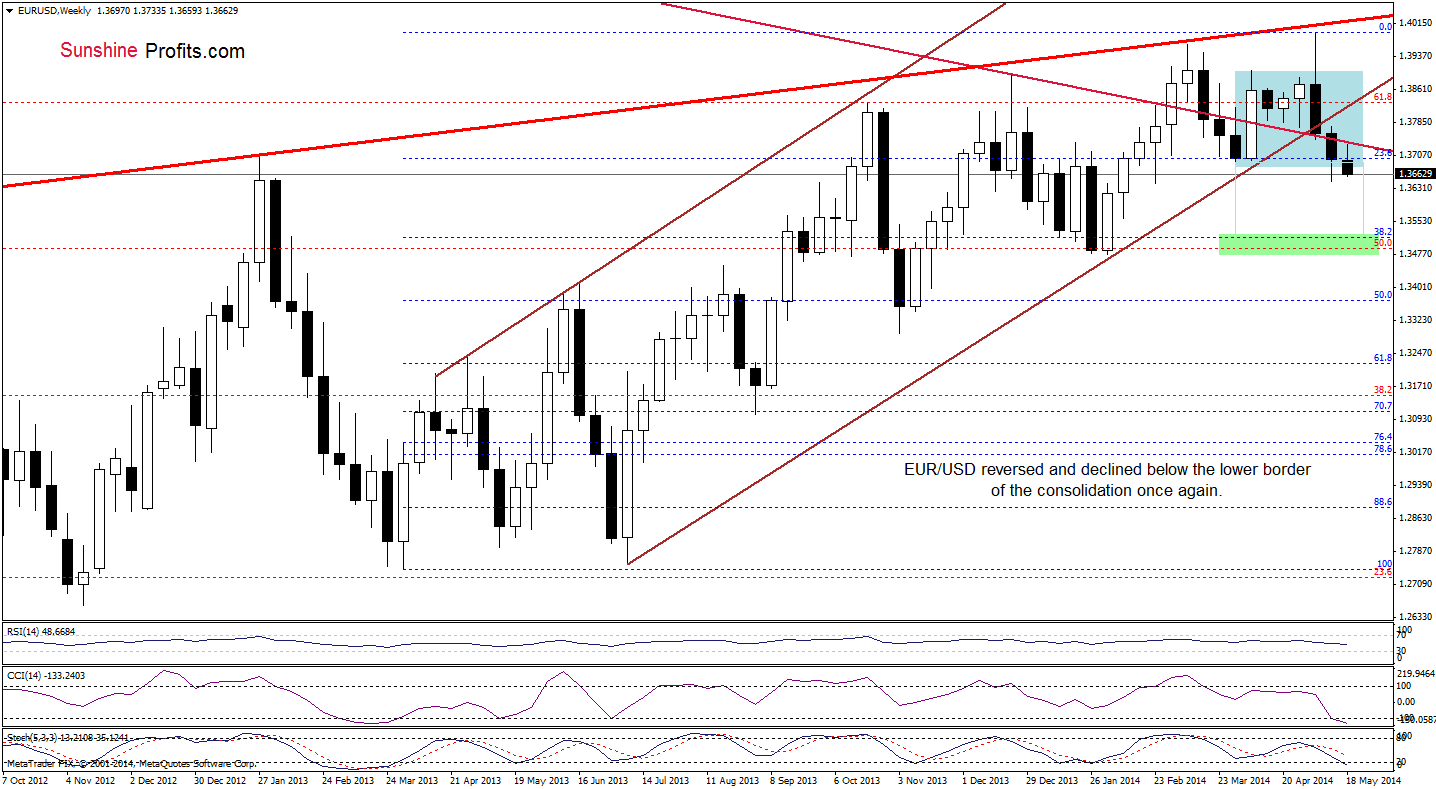
From this perspective, we see that EUR/USD reversed after an increase to the long-term declining resistance line. In our opinion, this upswing was nothing more than a verification of the breakdown below this line, which provides us with bearish implications and suggests that further deterioration is likely – especially when we factor in the fact that the pair dropped below the lower border of the consolidation. Taking all the above into account, we are convinced that what we wrote on Friday is still up-to-date:
(…) as long as there is no invalidation of the breakdown under these lines, further deterioration is likely. If this is the case, and the exchange rate extends losses in the coming week (or weeks), the downside target will be around 1.3516 (where the 38.2% Fibonacci retracement based on the entire March 2013-May 2014 is) or even slightly lower – around 1.3480, where the bottom of the previous bigger correction (between Dec. and Feb.) is.
Having discussed the above, let’s focus on the short-term perspective.
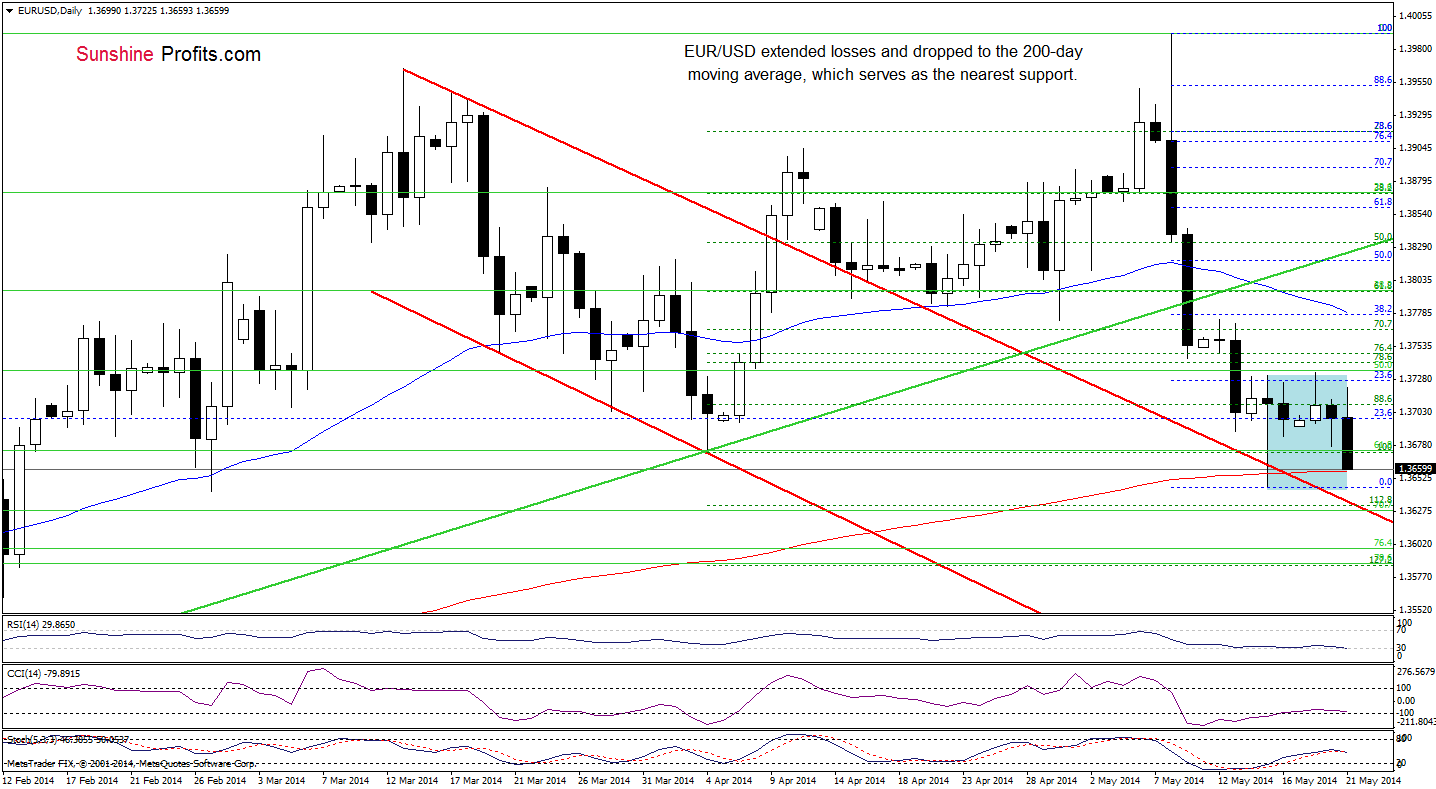
Looking at the daily chart, we see that the very short-term situation has deteriorated as EUR/USD reversed and extended declines, reaching the 200-day moving average. Therefore, what we wrote in our previous Forex Trading Alert is up-to-date:
(…) In our opinion, as long as the exchange rate is trading above the 200-day moving average another attempt to move higher can’t be ruled out – especially when we factor in buy signals generate by the CCI and Stochastic Oscillator. If this is the case, and EUR/USD climbs, we may see an upward move to a resistance zone created by last week’s high, the 38.2% Fibonacci retracement based on the entire recent decline and the 50-day moving average (around 1.3770-1.3785). However, if the pair extends losses and drops below the 200-day moving average, the next downside target will be the upper line of the declining trend channel
Before we summarize this currency pair, we would like to draw your attention to the quote from our Forex Trading Alert posted on Monday:
(…) In our opinion, the breakout in the USD Index above the medium-term resistance line can trigger a significant rally soon - even without the above-mentioned correction. Therefore, we remain bearish on EUR/USD.
Very short-term outlook: bearish
Short-term outlook: bearish
MT outlook: bearish
LT outlook: bearish
Trading position (short-term): Short. Stop-loss order: 1.4040. The short position featured on May 8th when EUR/USD was still above the 50-day moving average (blue line in the chart) remains profitable. We will keep you informed should anything change, or should we see a confirmation/invalidation of the above.
USD/JPY
Today we’ll take a closer look at the daily chart.
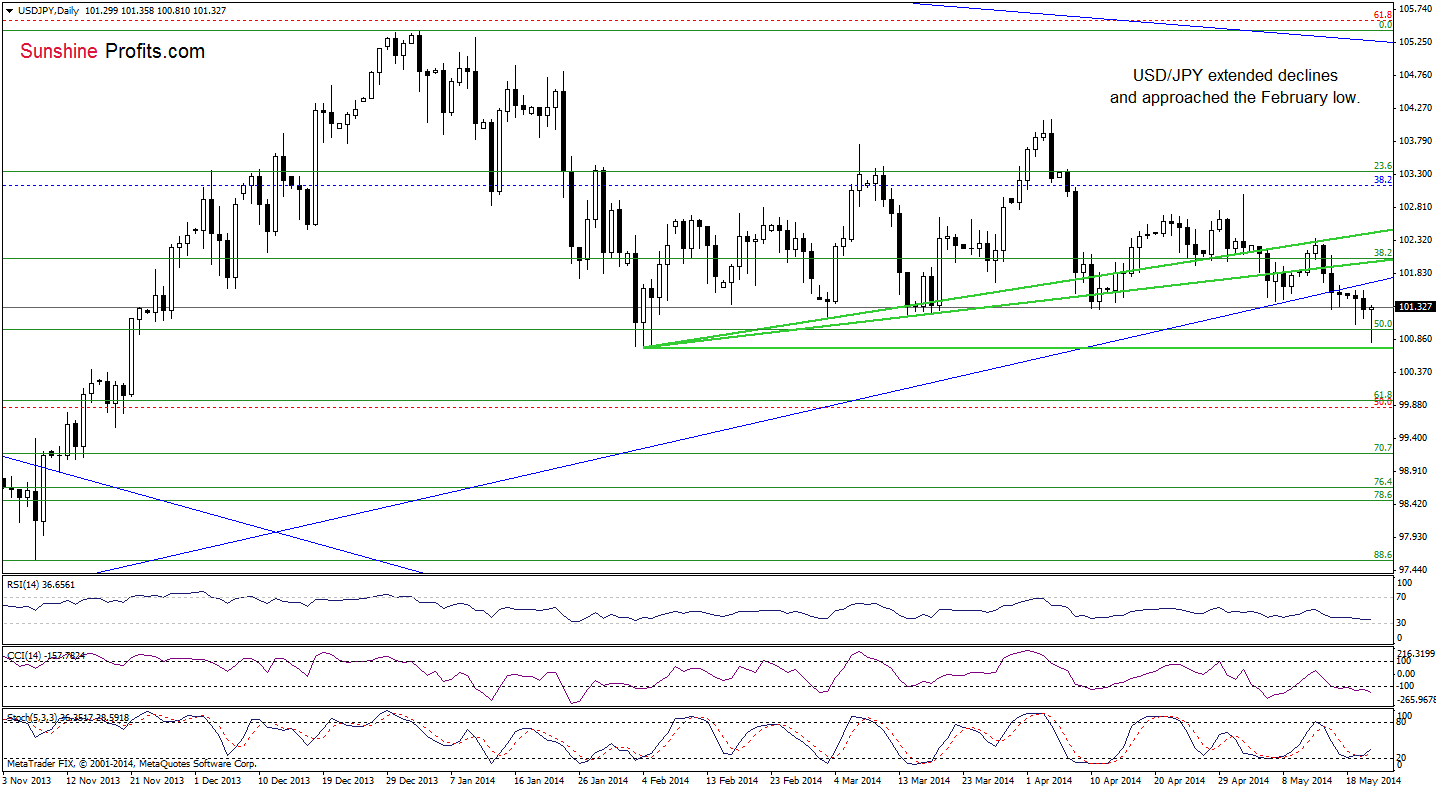
Looking at the above chart, we see that the very short-term situation has deteriorated as USD/JPY extended declines and dropped below the 50% Fibonacci retracement (around 101). In our alert posted on Monday, we wrote the following:
(…) If (…) this support (…) is broken, the pair will likely test the strength of the February low of 100.74.
As you see on the daily chart, currency bears almost realized the above-mentioned scenario earlier today. However, the proximity to this important support encouraged forex traders to push the buy button and we noticed a corrective upswing. Although this is a positive signal, in our opinion, the size of today’s rebound is too small to be sure that the worst is behind this pair. We think that as long as the exchange rate remains below the blue medium-term resistance line, another attempt to move to the February low can’t be ruled out. So, when can we see another sizable upswing? In our opinion, we may see such price action if the pair comes back above the May 13 high of 102.35.
Very short-term outlook: mixed
Short-term outlook: mixed
MT outlook: mixed
LT outlook: bearish
Trading position (short-term): In our opinion no positions are justified from the risk/reward perspective at the moment. We will consider opening short positions if the USD/JPY pair breaks below its 2014 low. We will keep you informed should anything change, or should we see a confirmation/invalidation of the above.
AUD/USD
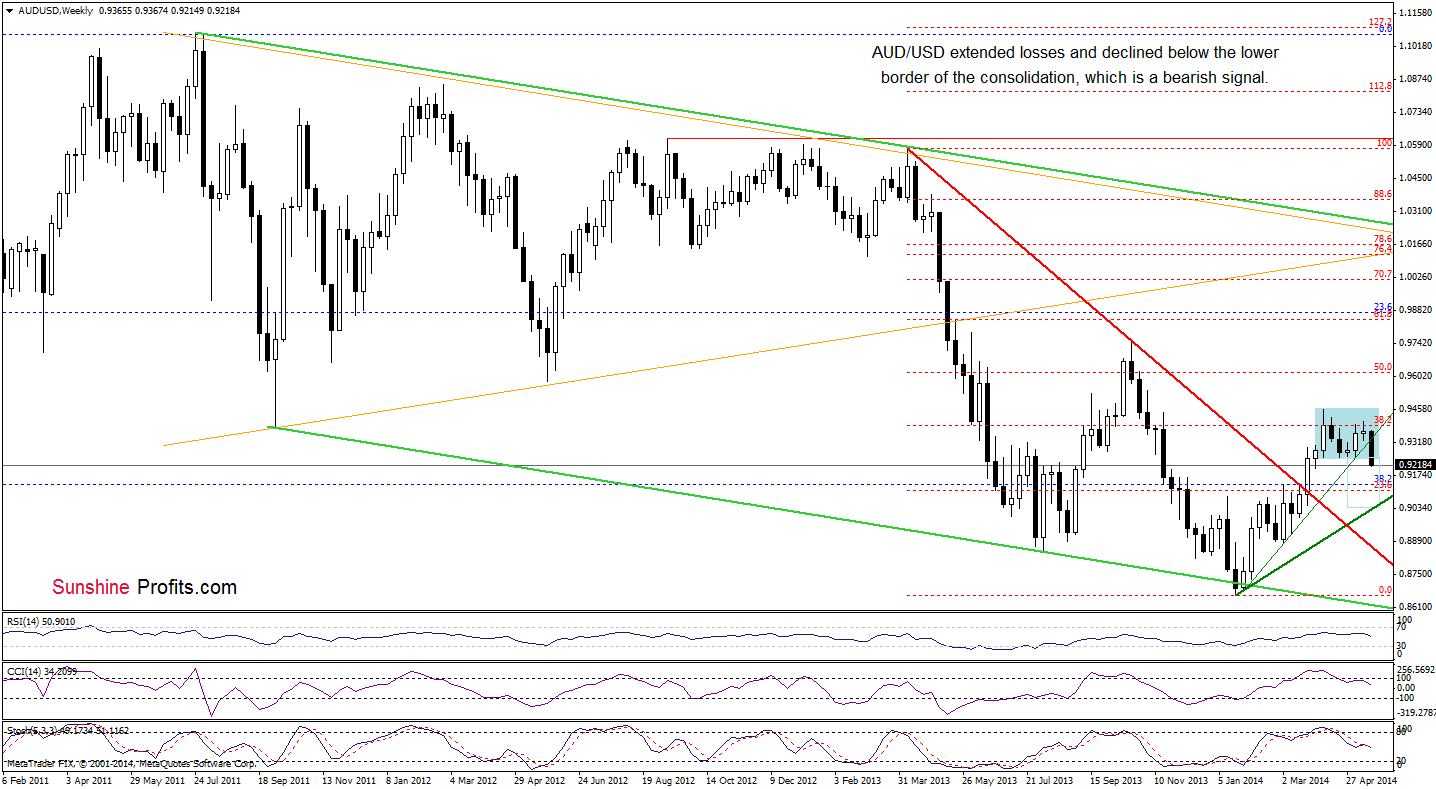
As you see on the weekly chart, the situation in medium term has deteriorated as AUD/USD declined below the lower border of the consolidation range. Taking this fact into account, we remain convinced that what we wrote yesterday is up-to-date:
(…) If the exchange range extends declines and drops below this line (at 0.9253), we will see further deterioration and the downside target will be the medium-term bold green line (currently around 0.9036). In our opinion, this scenario is more likely than not as sell signals generated by the indicators remain in place, supporting the bearish case.
Let’s check the short-term picture.
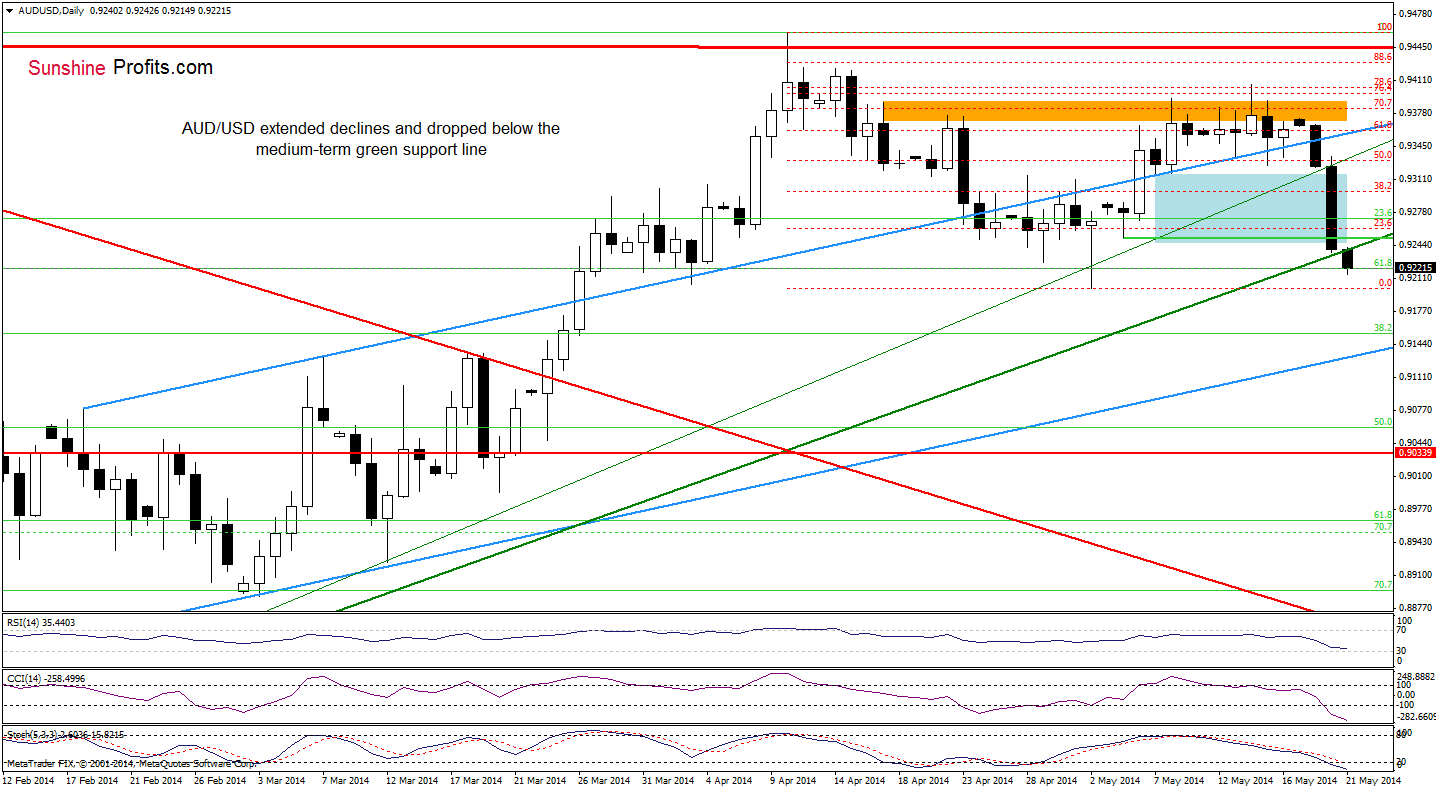
Quoting our last Forex Trading Alert:
(…) AUD/USD not only declined below the green support line and the lower border of the consolidation, but also slipped below its downside target. In our opinion, this is a bearish signal and if the exchange rate breaks below the May 5 low of 0.9251, we’ll see a test of the strength of the rising green support line based on the Jan. lows (currently around 0.9234). If it is broken, we think that the next downside target will be the May low of 0.9200.
Looking at the above chart, we see that the exchange rate dropped not only below the May 5 low, but also under the rising green support line, which suggests that the pair will reach the above-mentioned downside target in the very near future. Please note that if the May low doesn’t stop the current correction, we will likely see a drop to the 38.2% Fibonacci retracement based on the entire Jan.-Apr. rally (around 0.9154).
Very short-term outlook: bearish
Short-term outlook: bearish
MT outlook: bearish
LT outlook: bearish
Trading position (short-term): Short. Stop-loss order: 0.9410. We will keep you informed should anything change, or should we see a confirmation/invalidation of the above.
Thank you.
Nadia Simmons
Forex & Oil Trading Strategist
Przemyslaw Radomski, CFA
Founder, Editor-in-chief
Gold & Silver Trading Alerts
Forex Trading Alerts
Oil Investment Updates
Oil Trading Alerts

