
On Friday, the greenback shuffled between gains and losses as investors weighed mixed U.S. economic reports. Although upbeat numbers from the housing sector gave the U.S. currency support, another report softened the U.S. dollar, showing that consumer confidence in the U.S. deteriorated in May. Thanks to these circumstances, investors avoided the greenback today and remained cautious ahead of the Wednesday release of the Federal Reserve's minutes. As a result, the U.S. currency declined to a 3-month low against the yen and approached its next support. Will it withstand bears’ charge?
In our opinion the following forex trading positions are justified - summary:
- EUR/USD: short (stop-loss order: 1.4040)
- GBP/USD: none
- USD/JPY: none
- USD/CAD: none
- USD/CHF: none
- AUD/USD: short (stop-loss order: 0.9410)
EUR/USD
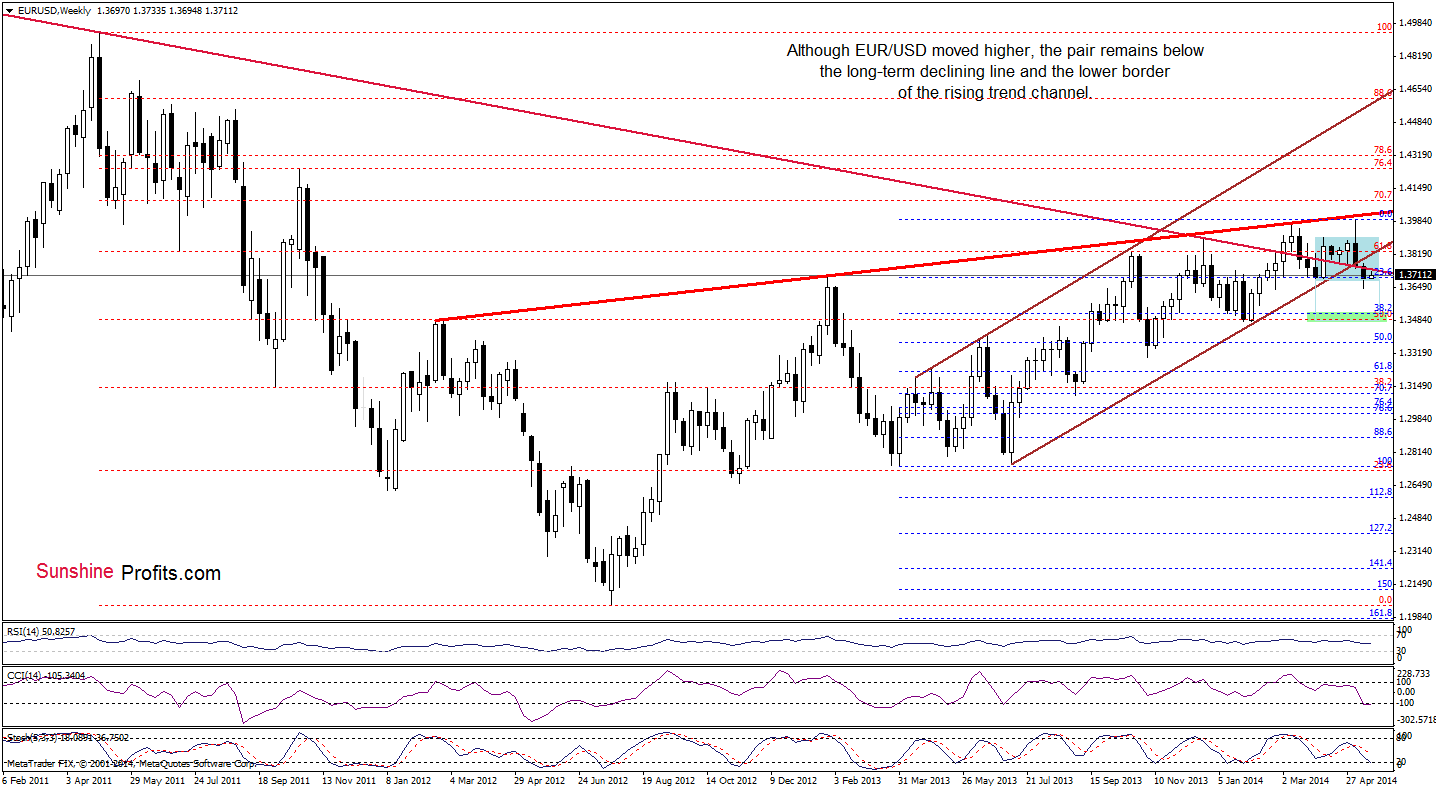
From this perspective, we see that although EUR/USD moved higher earlier today, the pair still remains in the consolidation range below both previously-broken major resistance lines: the long-term declining line and the lower border of the rising trend channel. Therefore, what we wrote on Friday is still up-to-date:
(…) this is a strong bearish factor, which signifies that as long as there is no invalidation of the breakdown under these lines, further deterioration is likely. If this is the case, and the exchange rate extends losses in the coming week (or weeks), the downside target will be around 1.3516 (where the 38.2% Fibonacci retracement based on the entire March 2013-May 2014 is) or even slightly lower – around 1.3480, where the bottom of the previous bigger correction (between Dec. and Feb.) is.
Having discussed the above, let’s focus on the short-term perspective.
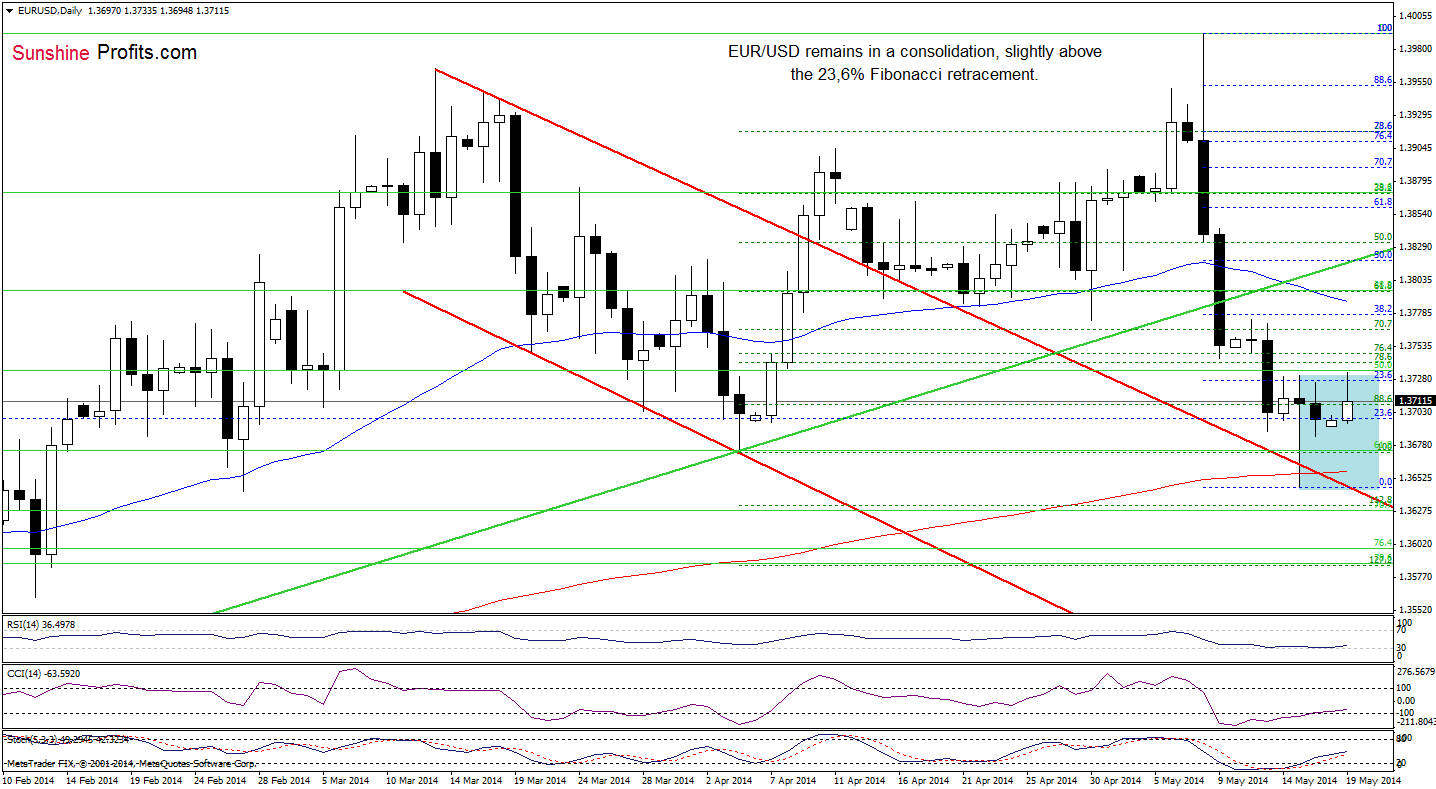
Looking at the daily chart, we see that although EUR/USD moved higher earlier today, the overall situation hasn’t changed much as the exchange rate remains in a consolidation between Thursday’s high and low. Therefore, what we wrote in our last Forex Trading Alert is up-to-date:
(…) the next downside target will be the upper line of the declining trend channel (…) EUR/USD reached the above-mentioned downside target, slipping to the 200-day moving average at the same time. The combination of these two strong supports triggered a corrective upswing (…) Additionally, there are positive divergences between the CCI, Stochastic Oscillator and the exchange rate, which suggests that we may see further improvement in the near future (especially if the indicators generate buy signals). If this is the case, EUR/USD will likely move to around 1.3770 (this week’s high is) or even to 1.3800, where the 50-day moving average and the previously-broken medium-term green line are.
Taking all the above into account, some of you may want to close short positions and take profits off the table, and we are perfectly fine with that, however, we prefer to focus on the bigger move that will probably follow shortly - we don't want to risk missing it. In our opinion, the breakout in the USD Index above the medium-term resistance line can trigger a significant rally soon - even without the above-mentioned correction. Therefore, we remain bearish on EUR/USD.
Very short-term outlook: bearish
Short-term outlook: bearish
MT outlook: bearish
LT outlook: bearish
Trading position (short-term): Short. Stop-loss order: 1.4040. We will keep you informed should anything change, or should we see a confirmation/invalidation of the above.
USD/JPY
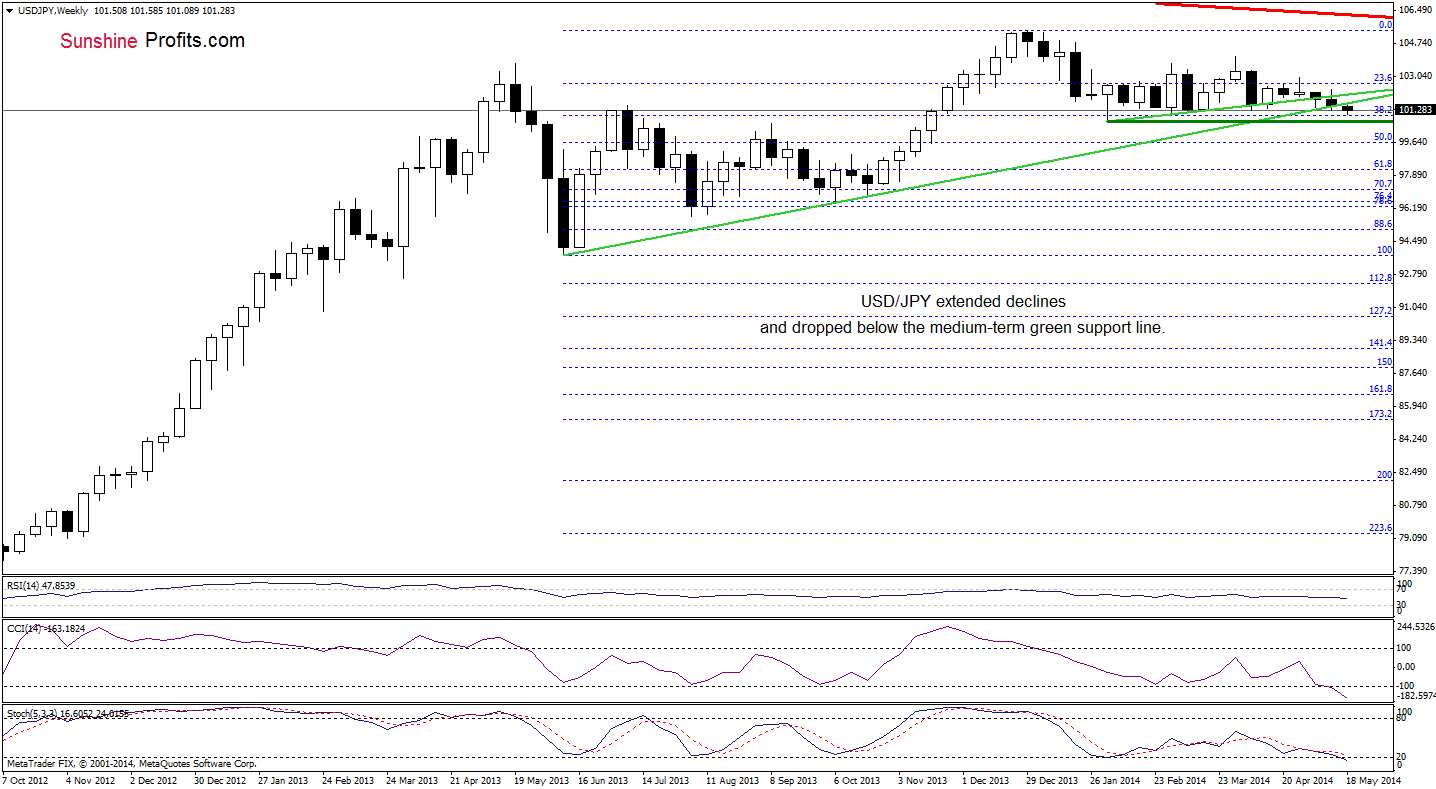
From the weekly perspective, we see that USD/JPY moved lower once again and declined below the medium-term green line. Therefore, what we wrote on Friday is up-to-date:
(…) we may see further deterioration and a drop to the February or March low (around 100.74-101.20). In our opinion, another sizable upswing will be likely only if the pair breaks above the short-term green resistance line (currently around 102).
Once we know the medium-term picture, let’s take a look at the daily chart.
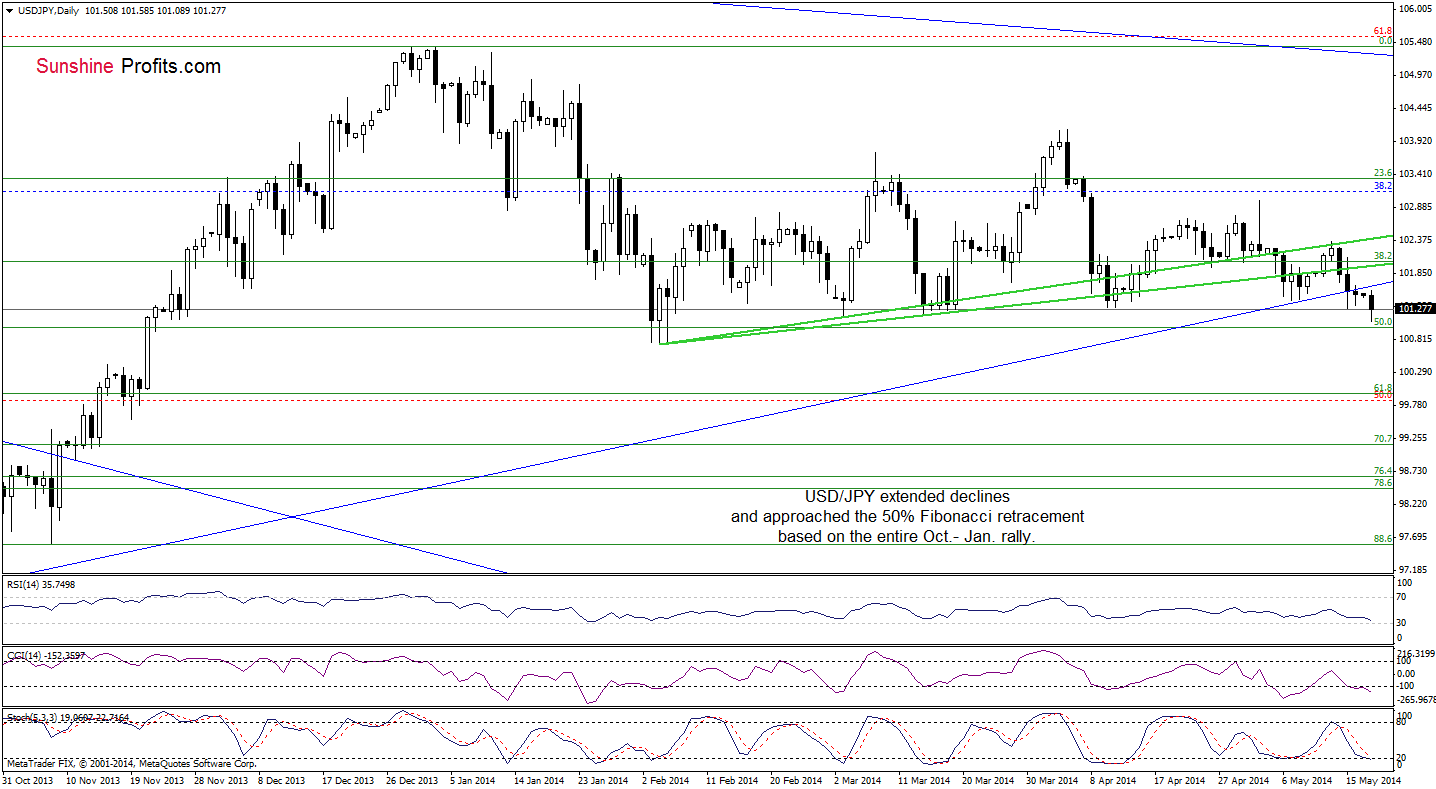
Quoting our last Forex Trading Alert:
(…) USD/JPY verified the breakdown below the upper green line and declined below the medium-term support line (marked with blue). This is a bearish signal and it seems to us that the exchange rate move lower once again as sell signals generated by the indicators remain in place. If this is the case, the nearest support will be the 50% Fibonacci retracement (around 101) in combination with the February low of 100.74.
As you see on the above chart, the exchange rate extended declines and approached its downside target earlier today. If the proximity to this support encourages forex traders to push the buy button, we’ll see a corrective upswing to around 101.67, where the previously-broken blue medium-term support line is. However, if it is broken, the pair will likely test the strength of the February low of 100.74.
Very short-term outlook: mixed with bearish bias
Short-term outlook: mixed with bearish bias
MT outlook: mixed
LT outlook: bearish
Trading position (short-term): In our opinion no positions are justified from the risk/reward perspective at the moment. We will consider opening short positions if the USD/JPY pair breaks below its 2014 low. We will keep you informed should anything change, or should we see a confirmation/invalidation of the above.
AUD/USD
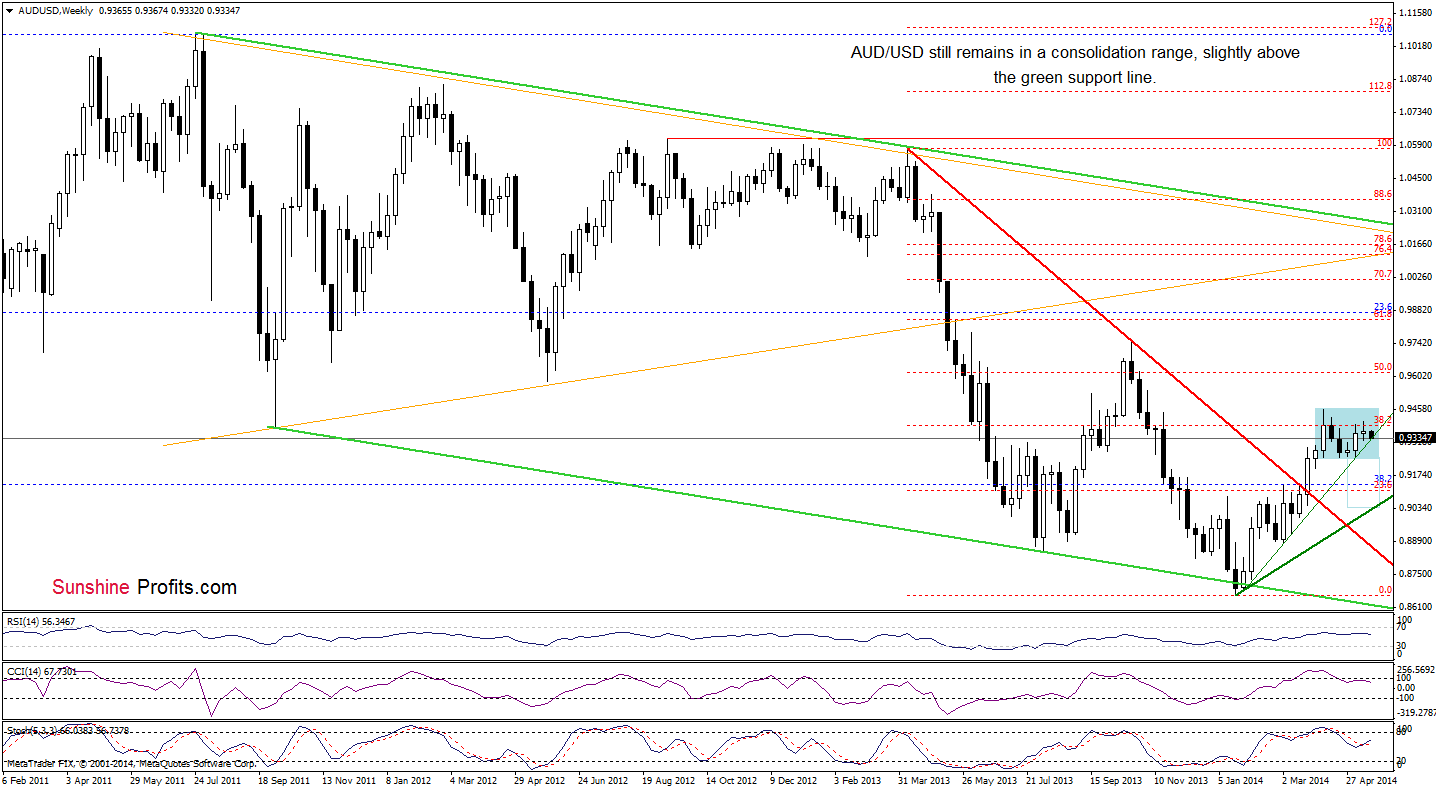
Looking at the above chart, we see that the situation in the medium term remains unchanged as AUD/USD is trading in the narrow range between the 38.2% Fibonacci retracement (based on the entire Apr.-Jan. decline) and the green support line. Therefore, we remain convinced that as long as there is no breakout above the nearest resistance level or breakdown below the major support, another sizable move is not likely to be seen.
Will the short-term chart give us any clues about futures moves? Let’s check.
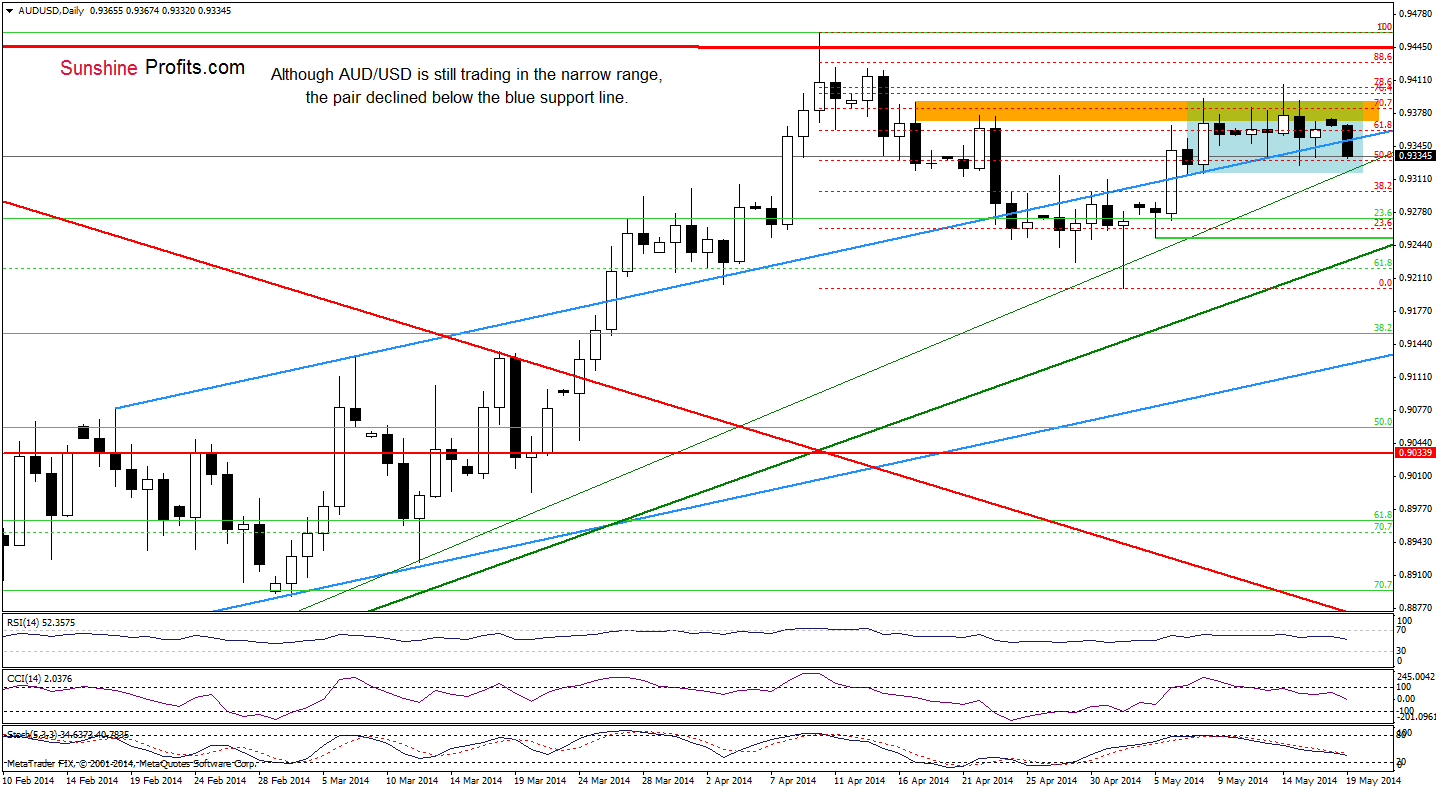
On Friday, we wrote the following:
(…) In our opinion, there are a number of signs that a pullback in AUD/USD is close. First, the exchange rate reached the next resistance zone created by the 76.4% and 78.6% Fibonacci retracement levels (based on the entire recent decline). From our experience, this area usually stops (or at least decelerates) further improvement. Secondly, when we take a closer look at the daily chart, we notice a 5-wave sequence, which suggests that the correction is likely to be seen. Another negative signs come from the indicators. (…) which increases the risk of trend reversal.
(…) all the above-mentioned bearish factors remain in place, which suggests that it may take some time before a breakout higher becomes likely. Therefore, we remain convinced that further deterioration is just around the corner and the current correction will accelerate if the exchange rate drops below the lower border of the consolidation (based on the May 8 low of 0.9318).
As you see on the above chart, the very short-term situation has deteriorated as AUD/USD moved lower and broke below the blue support line. Despite this deterioration, the exchange rate still remains in the consolidation range below Wednesday high and the strong resistance zone. As we have pointed out on Friday, we believe that if the pair declines below the lower border of the consolidation (which corresponds to the medium-term green support line at the moment), the current correction will accelerate and we’ll see a drop to at least 0.9272 (where the 23.6% Fibonacci retracement based on the entire Ja.-Apr. rally is).
Very short-term outlook: bearish
Short-term outlook: bearish
MT outlook: bearish
LT outlook: bearish
Trading position (short-term): Short. Stop-loss order: 0.9410. We will keep you informed should anything change, or should we see a confirmation/invalidation of the above.
Thank you.
Nadia Simmons
Forex & Oil Trading Strategist
Przemyslaw Radomski, CFA
Founder, Editor-in-chief
Gold & Silver Trading Alerts
Forex Trading Alerts
Oil Investment Updates
Oil Trading Alerts

