
Earlier today, the greenback shuffled between gains and losses as investors weighed mixed U.S. economic reports. On one hand, the preliminary Thomson Reuters/University of Michigan consumer sentiment index fell to 81.8 in May from 84.1 in April, missing market expectations for a 84.5 reading, which softened the U.S. currency. On the other hand, better-than-expected numbers from the housing sector gave the greenback support. The Census Bureau reported that U.S. building permits rose 8% to 1.080 million units last month (while analysts had expected an increase to 1.010 million units in April) and housing starts rose to 1.072 million units in April, beating expectations of 980,000 gain. As a result, major currency pairs were little changed. Is it calm before the storm?
In our opinion the following forex trading positions are justified - summary:
- EUR/USD: short (stop-loss order: 1.4040)
- GBP/USD: none
- USD/JPY: none
- USD/CAD: none
- USD/CHF: none
- AUD/USD: short (stop-loss order: 0.9410)
EUR/USD
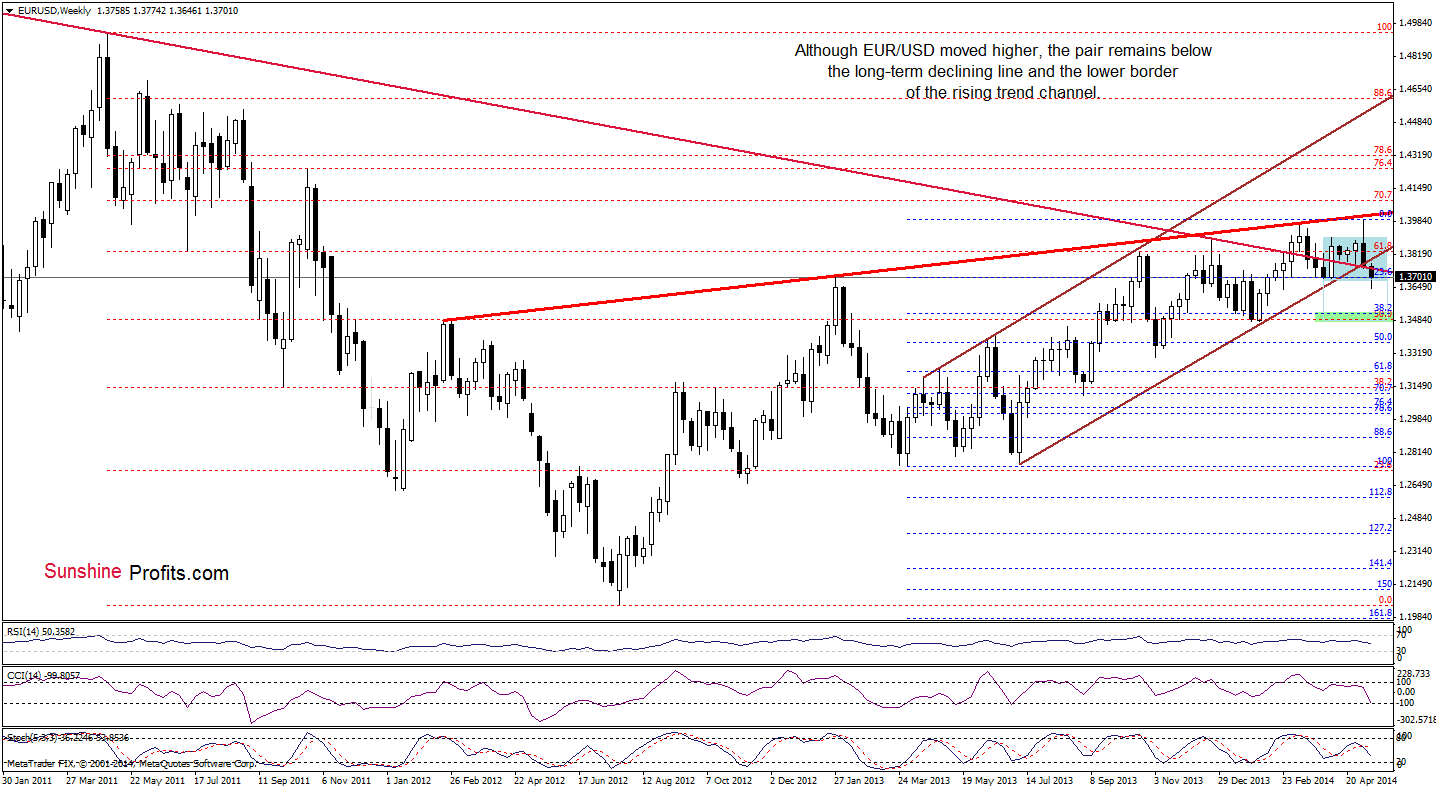
From this perspective, we see that although EUR/USD rebounded slightly and came back to the consolidation range, the pair still remains below both previously-broken major resistance lines: the long-term declining line and the lower border of the rising trend channel. To us, this is a strong bearish factor, which signifies that as long as there is no invalidation of the breakdown under these lines, further deterioration is likely. If this is the case, and the exchange rate extends losses in the coming week (or weeks), the downside target will be around 1.3516 (where the 38.2% Fibonacci retracement based on the entire March 2013-May 2014 is) or even slightly lower – around 1.3480, where the bottom of the previous bigger correction (between Dec. and Feb.) is.
Having discussed the above, let’s focus on the short-term perspective.
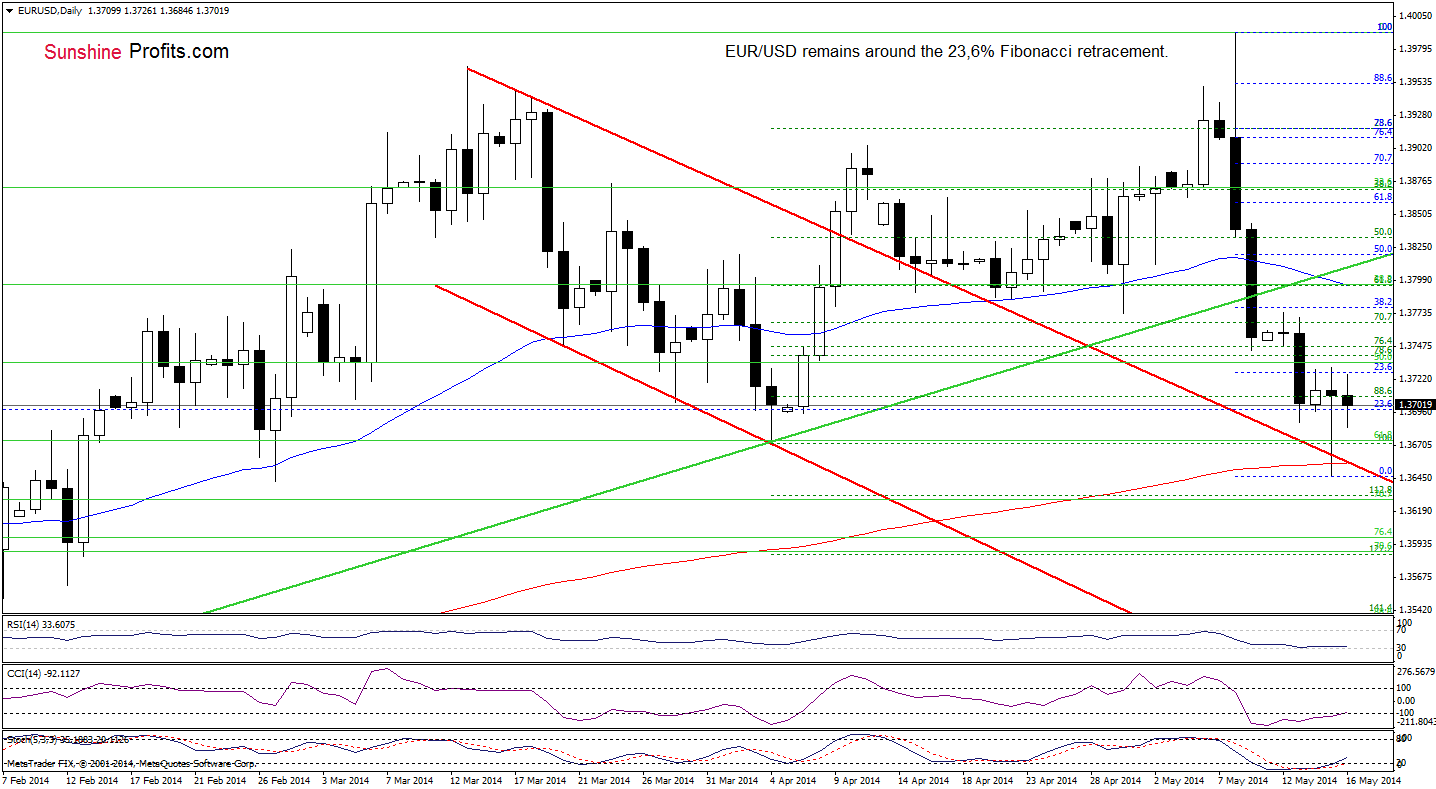
Looking at the daily chart, we see that the very short-term situation hasn’t changed much as EUR/USD is trading in a narrow range between yesterday’s high and low. Therefore, what we wrote in our last Forex Trading Alert is up-to-date:
(…) the next downside target will be the upper line of the declining trend channel (…) EUR/USD reached the above-mentioned downside target, slipping to the 200-day moving average at the same time. The combination of these two strong supports triggered a corrective upswing (…) Additionally, there are positive divergences between the CCI, Stochastic Oscillator and the exchange rate, which suggests that we may see further improvement in the near future (especially if the indicators generate buy signals). If this is the case, EUR/USD will likely move to around 1.3770 (this week’s high is) or even to 1.3800, where the 50-day moving average and the previously-broken medium-term green line are.
Taking all the above into account, some of you may want to close short positions and take profits off the table, and we are perfectly fine with that, however, we prefer to focus on the bigger move that will probably follow shortly - we don't want to risk missing it. In our opinion, the breakout in the USD Index above the medium-term resistance line can trigger a significant rally soon - even without the above-mentioned correction. Therefore, we remain bearish on EUR/USD.
Very short-term outlook: bearish
Short-term outlook: bearish
MT outlook: bearish
LT outlook: bearish
Trading position (short-term): Short. Stop-loss order: 1.4040. We will keep you informed should anything change, or should we see a confirmation/invalidation of the above.
GBP/USD
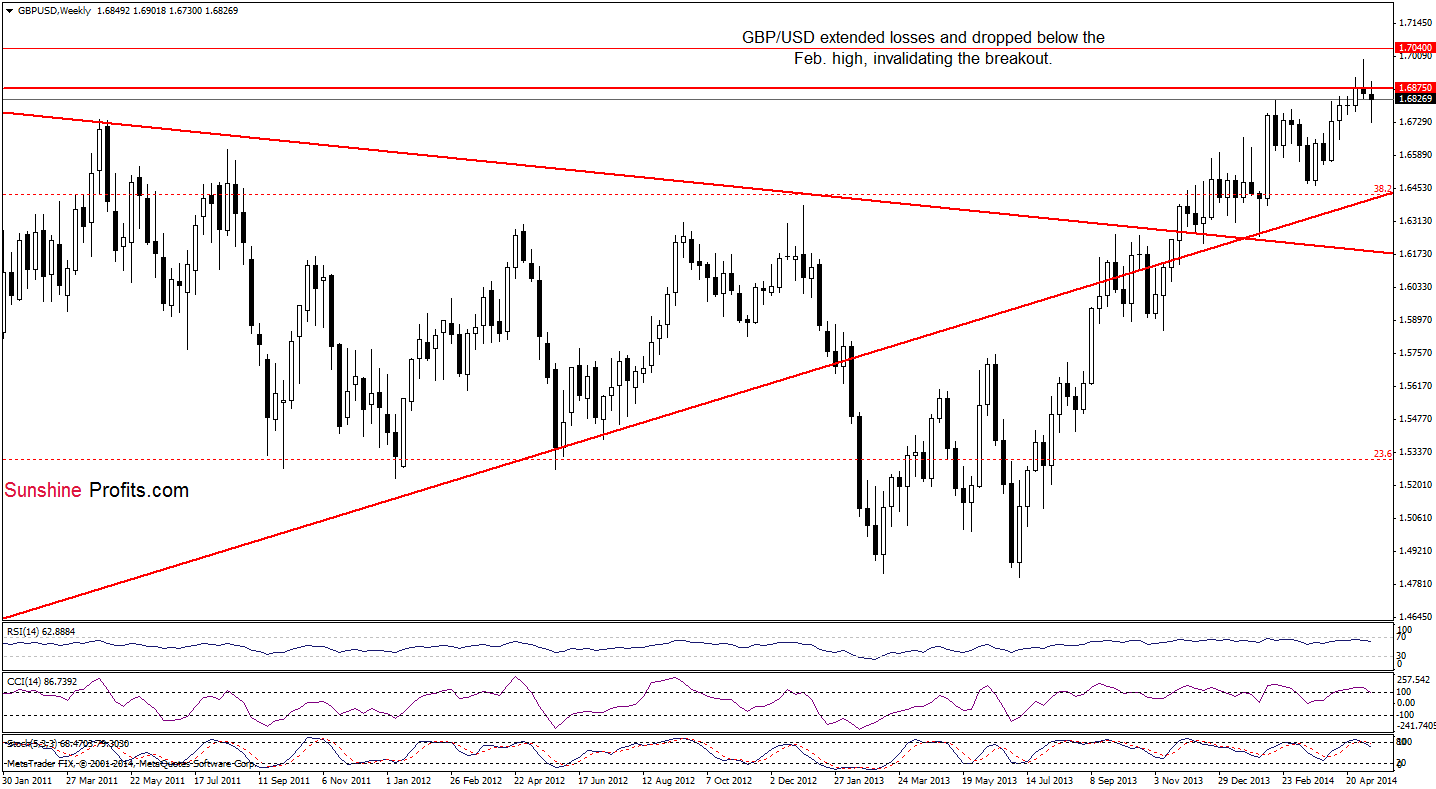
From the weekly perspective, we see that the situation has deteriorated as GBP/USD extended losses and declined below the February high. Additionally, the pair still remains below the Nov. 2009 and May highs, while the CCI and Stochastic Oscillator generated sell signals. In our opinion, these are bearish circumstances, which will likely trigger further deterioration in the coming week (or even weeks).
Let’s take a closer look at the daily chart.
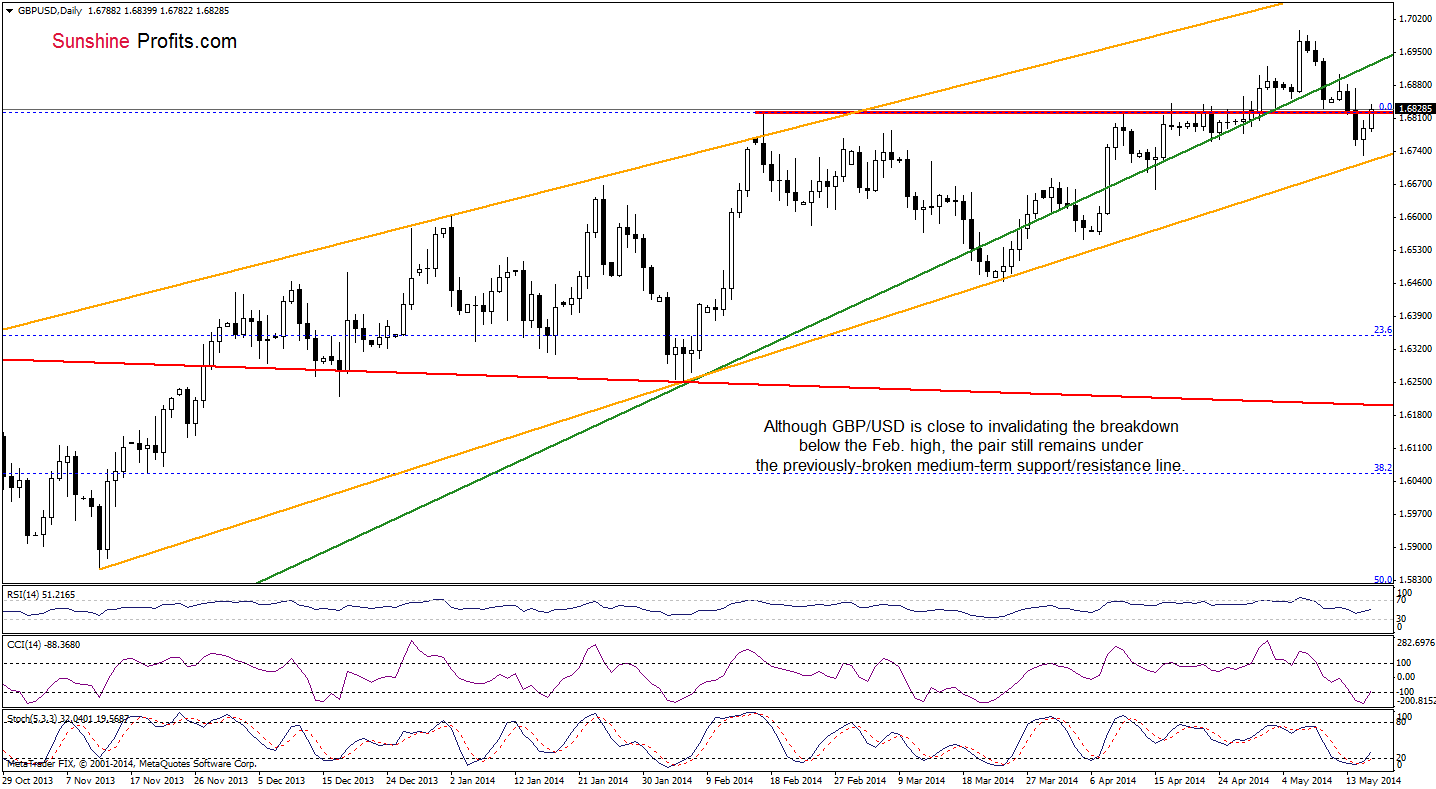
Looking at the daily chart, we see that although the exchange rate declined in the recent days, the proximity to the lower border of the rising trend channel (marked with orange) triggered a corrective upswing. Despite this small improvement, GBP/USD still remains under the previously-broken medium-term rising green resistance line. Therefore, it seems to us that as long as the breakdown below this important line is not invalidated, another attempt to move lower is likely. Nevertheless, we should keep in mind that another sizable downswing will be likely only if the pair declines below the medium-term orange support line.
Very short-term outlook: mixed
Short-term outlook: mixed with bearish bias
MT outlook: bearish
LT outlook: mixed
Trading position (short-term): In our opinion, no positions are justified from the risk/reward perspective. We will keep you informed should anything change, or should we see a confirmation/invalidation of the above.
USD/JPY
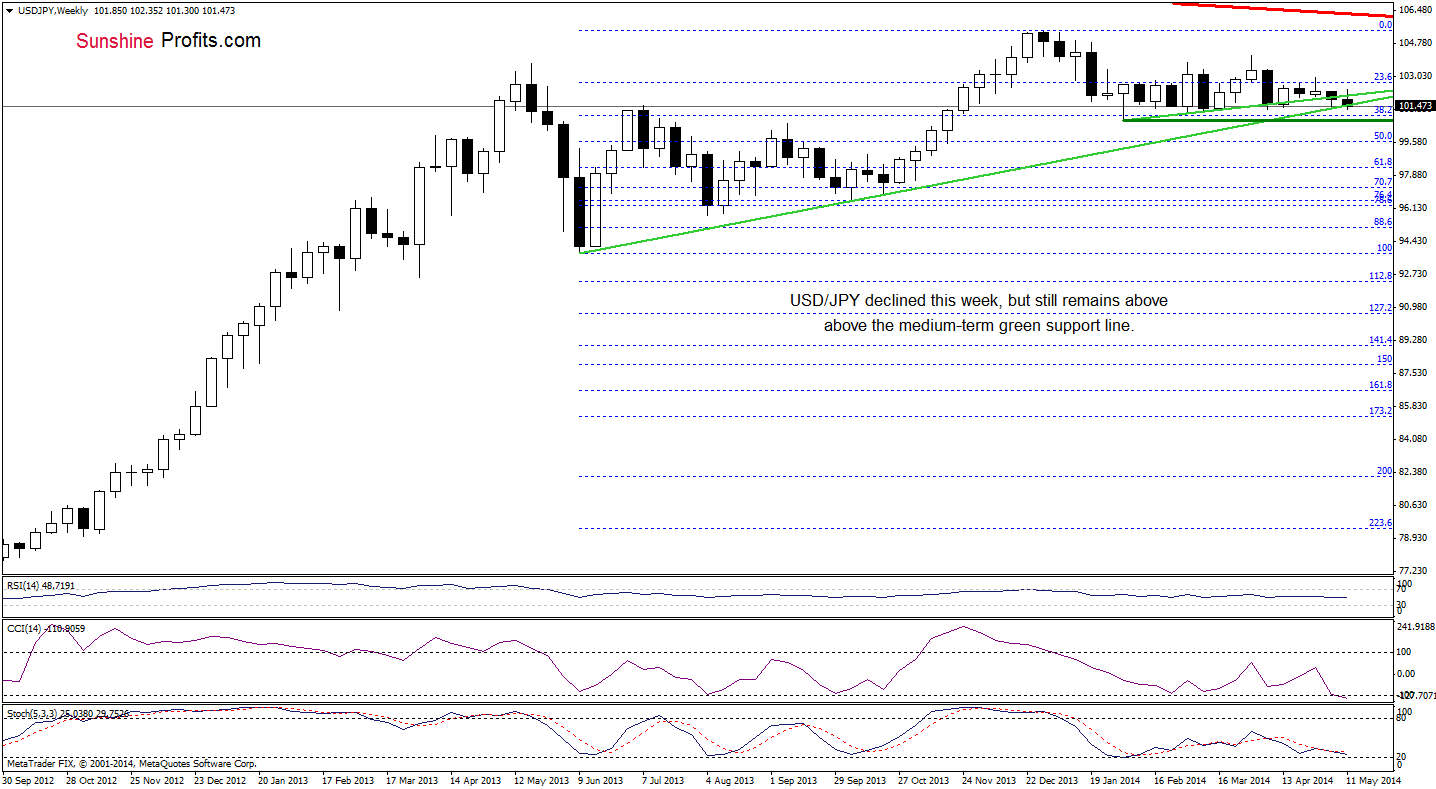
From the weekly perspective, we see that USD/JPY moved lower this week, which resulted in a small decline below the medium-term green line. This is a bearish signal and if the pair closes the week under this support, we may see further deterioration and a drop to the February or March low (around 100.74-101.20). In our opinion, another sizable upswing will be likely only if the pair breaks above the short-term green resistance line (currently around 102).
Once we know the medium-term picture, let’s take a look at the daily chart.
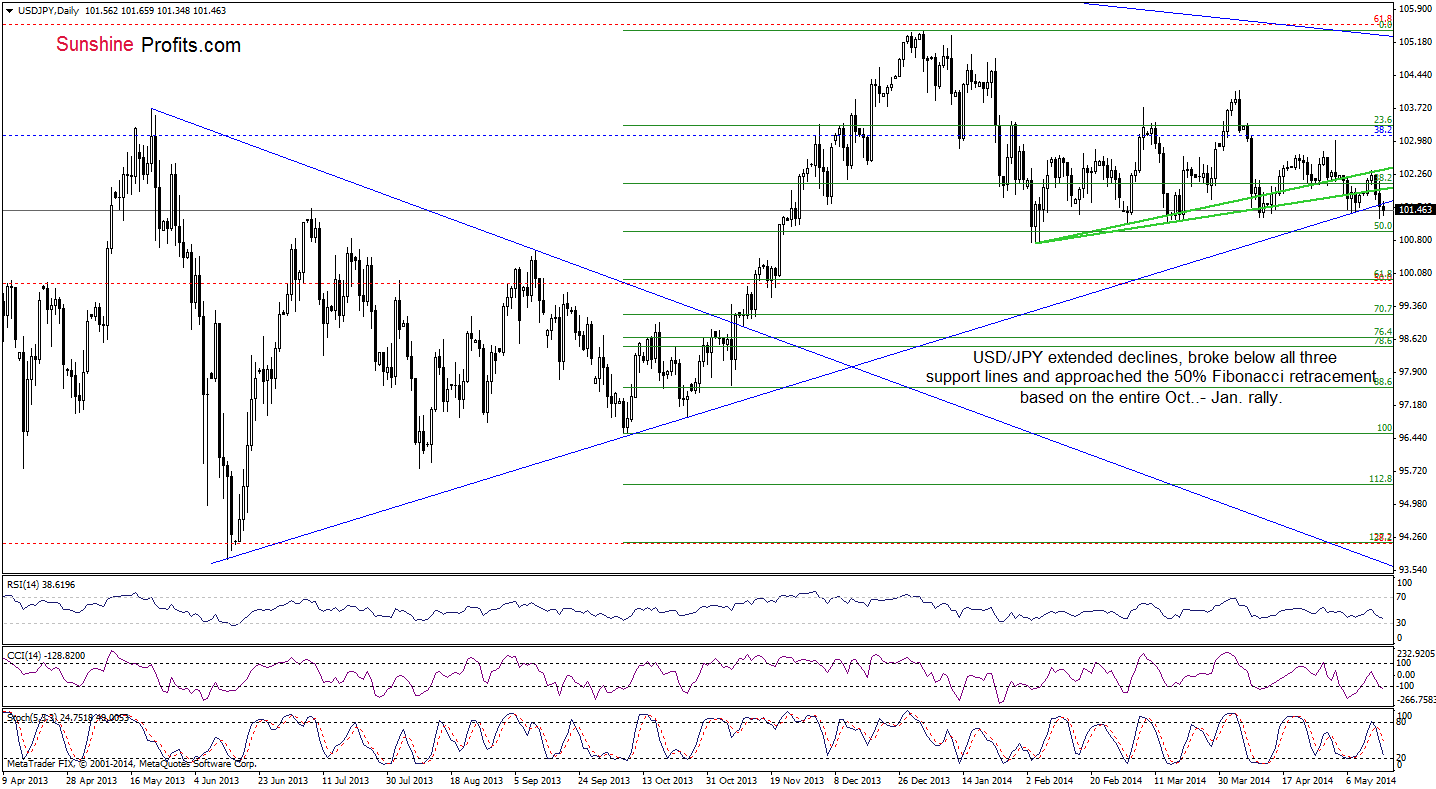
On the above chart, we see that the situation in the very short term has deteriorated as USD/JPY verified the breakdown below the upper green line and declined below the medium-term support line (marked with blue). This is a bearish signal and it seems to us that the exchange rate move lower once again as sell signals generated by the indicators remain in place. If this is the case, the nearest support will be the 50% Fibonacci retracement (around 101) in combination with the February low of 100.74.
Very short-term outlook: bearish
Short-term outlook: mixed with bearish bias
MT outlook: mixed
LT outlook: bearish
Trading position (short-term): In our opinion no positions are justified from the risk/reward perspective at the moment. We will keep you informed should anything change, or should we see a confirmation/invalidation of the above.
USD/CAD
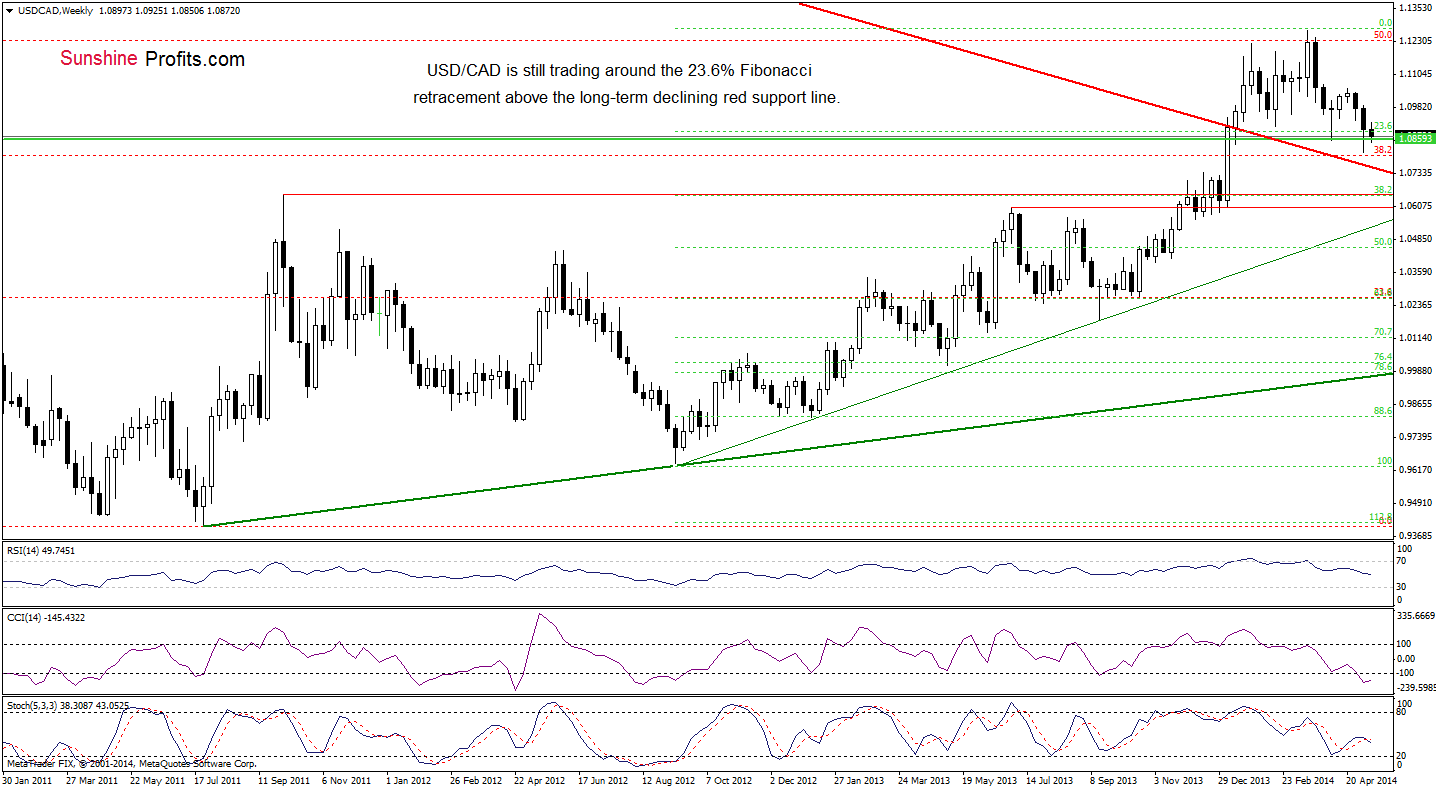
On the weekly chart, we see that the medium-term situation hasn’t changed much as USD/CAD remains between last week’s high and low. From this perspective, we notice that the exchange rate is currently trading around the 23.6% Fibonacci retracement and the 2010 high. If this support area holds, we will likely see a corrective upswing to at least 1.0987, where the previous week’s peak is. However, if it is broken, we may see drop to around 1.0813 (the last week’s low).
Let’s check the short-term picture. Will we find any interesting clues about future moves?
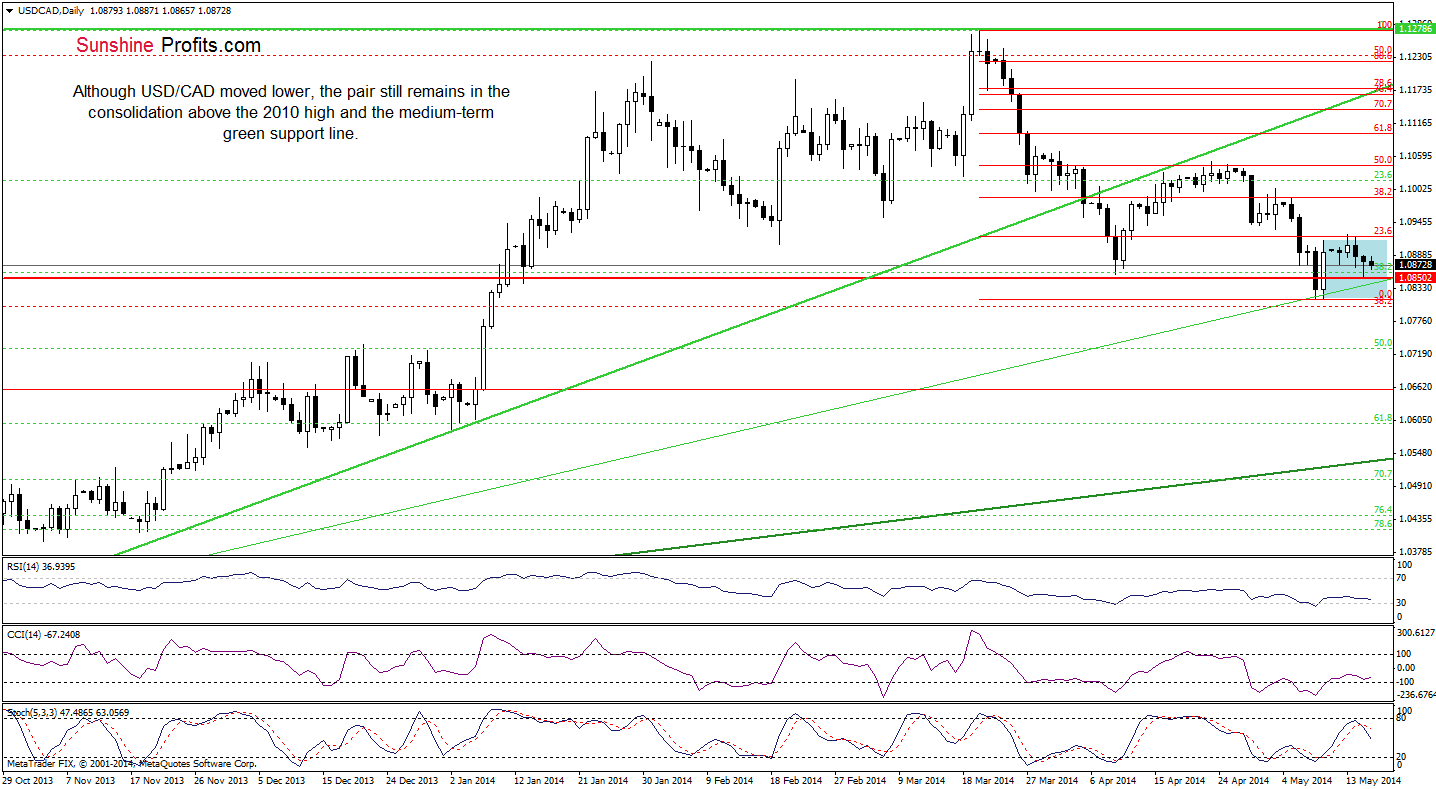
Unfortunately not because USD/CAD remains in a consolidation, slightly above the medium-term support line. On one hand, if the exchange rate breaks above the upper line of the formation, we may see an increase to around 1.1016. However, if the pair drops below the lower line of the consolidation, we will likely see a decline even to around 1.0728, where the 50% Fibonacci retracement (based on Sept.-March rally) is.
Very short-term outlook: mixed
Short-term outlook: mixed
MT outlook: bullish
LT outlook: bearish
Trading position (short-term): In our opinion no positions are justified from the risk/reward perspective as the space for further declines may be limited. We will keep you informed should anything change, or should we see a confirmation/invalidation of the above.
USD/CHF
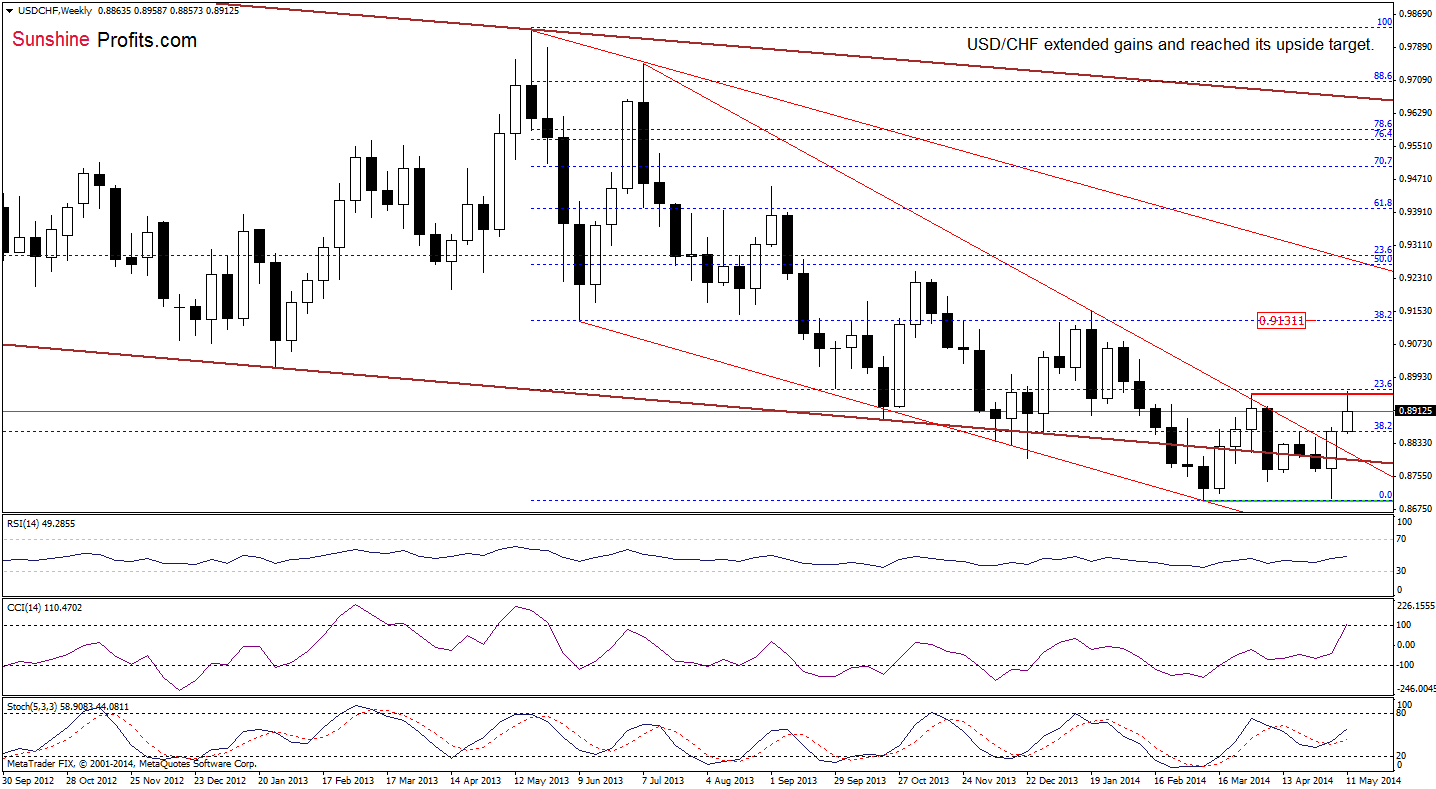
On the above chart, we see that the exchange rate is still trading near the resistance level created by the April high. Therefore, our previous commentary on this currency pair is up-to-date:
(…) On one hand, if USD/CAD breaks above the April high (which is currently reinforced by the 23.6% Fiboncci retracement based on the entire May-March deline), we may see further improvement and an increase to around 0.9131, where the 38.2% Fibonacci retracement is. On the other hand, if this area encourage forex traders to push the sell button, we will see a pullback to around last week’s high of 0.8872, which seves as the nearest support. At this point, we would like to draw your attention to the fact that traders who had bet on higher values may lock in their profits in this area, which will likely raise the selling pressure and push the exchange rate lower.
What is the short-term picture? Let’s check.
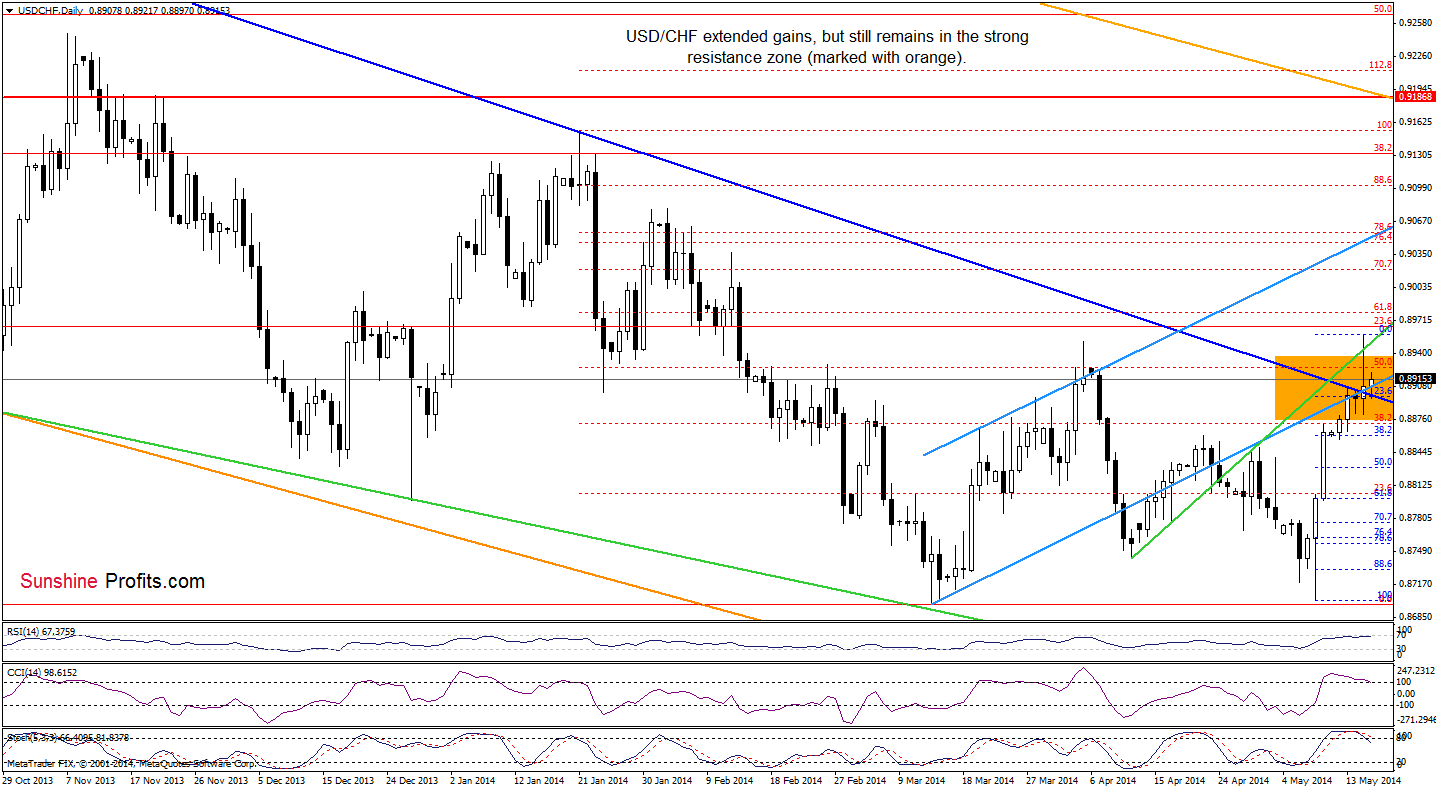
Earlier today, USD/CHF bounced off the medium-term declining blue line and the lower border of the rising trend channel, which is a bullish signal. But is the very short-term situation as bullish as it seems at the first glance? Not really. Although the pair is trading slightly above these lines, it still remains below the resistance zone created by the April high and the 23.6% Fibonacci retracement based on the entire May-March decline. Therefore, we think that as long as there is no breakout above this area, another attempt to move lower can’t be ruled out. This scenario is currently reinforced by sell signals generated by the indicators, which suggests that a pullback is just around the corner.
Very short-term outlook: bearish
Short-term outlook: mixed
MT outlook: mixed with bullish bias
LT outlook: bearish
Trading position (short-term): In our opinion no positions are justified from the risk/reward perspective. We will keep you informed should anything change, or should we see a confirmation/invalidation of the above.
AUD/USD
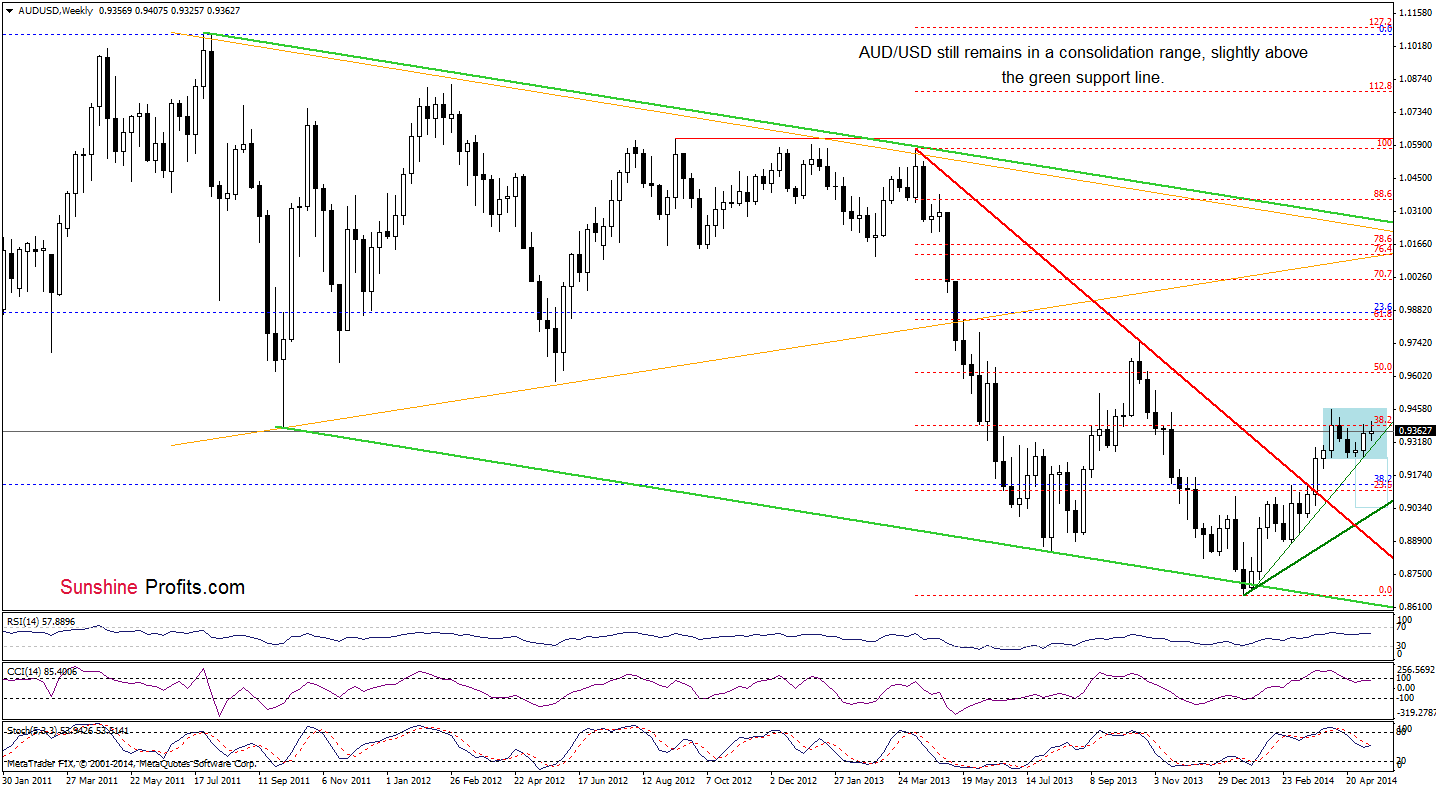
From the medium-term perpective, we see that AUD/USD is trading in the narrow range between the 38.2% Fibonacci retracement (based on the entire Apr.-Jan. decline) and the green support line. In our opinion, as long as there is no breakout above the nearest resistance level or breakdown below the major support, another sizable move is not likely to be seen.
Will the short-term chart give us any clues about futures moves? Let’s check.
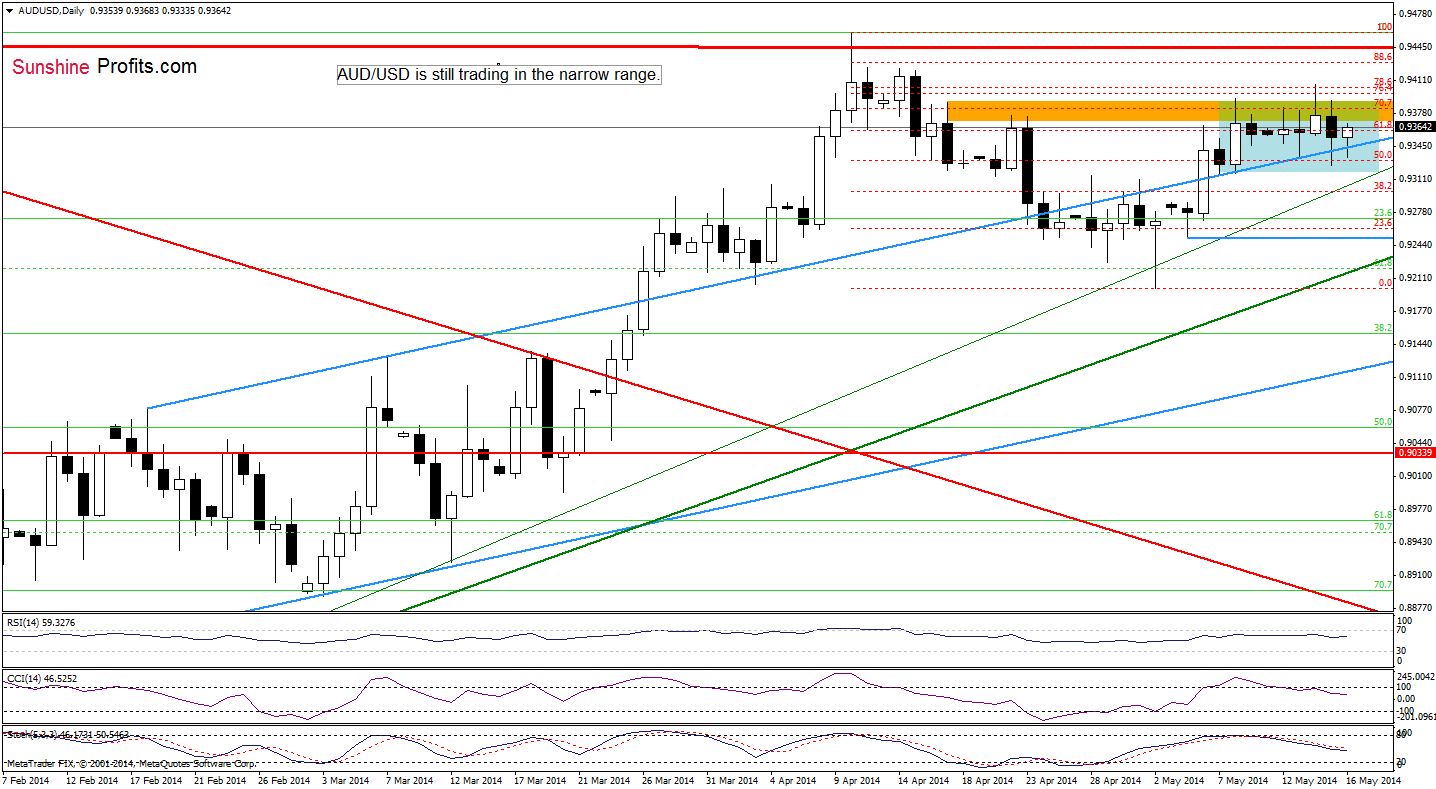
Although AUD/USD bounced off the blue support line once again, the exchange rate still remains below Wednesday high and the strong resistance zone. Therefore, what we wrote yesterday is up-to-date:
(…) In our opinion, there are a number of signs that a pullback in AUD/USD is close. First, the exchange rate reached the next resistance zone created by the 76.4% and 78.6% Fibonacci retracement levels (based on the entire recent decline). From our experience, this area usually stops (or at least decelerates) further improvement. Secondly, when we take a closer look at the daily chart, we notice a 5-wave sequence, which suggests that the correction is likely to be seen. Another negative signs come from the indicators. As you see, the RSI remains at its highest level since April high, while the CCI and Stochastic Oscillator generated sell signals. Additionally, there are negative divergences between them and the exchange rate, which increases the risk of trend reversal.
(…) all the above-mentioned bearish factors remain in place, which suggests that it may take some time before a breakout higher becomes likely. Therefore, we remain convinced that further deterioration is just around the corner and the current correction will accelerate if the exchange rate drops below the lower border of the consolidation (based on the May 8 low of 0.9318).
Very short-term outlook: bearish
Short-term outlook: bearish
MT outlook: bearish
LT outlook: bearish
Trading position (short-term): Short. Stop-loss order: 0.9410. We will keep you informed should anything change, or should we see a confirmation/invalidation of the above.
Thank you.
Nadia Simmons
Forex & Oil Trading Strategist
Przemyslaw Radomski, CFA
Founder, Editor-in-chief
Gold & Silver Trading Alerts
Forex Trading Alerts
Oil Investment Updates
Oil Trading Alerts

