
On Tuesday, Australia's Treasury's budget report showed that the deficit was forecast to fall from A$50 billion to A$30 billion, which pushed the Aussie higher. Earlier today, the Australian dollar extended gains and climbed to 1-month high against its U.S. counterpart. In this way, AUD/USD broke above the nearest resistance zone, approaching April high. Whether the situation is as bullish as it looks at the first glance?
In our opinion the following forex trading positions are justified - summary:
- EUR/USD: short (stop-loss order: 1.4040)
- GBP/USD: none
- USD/JPY: none
- USD/CAD: none
- USD/CHF: none
- AUD/USD: short (stop-loss order: 0.9410)
EUR/USD
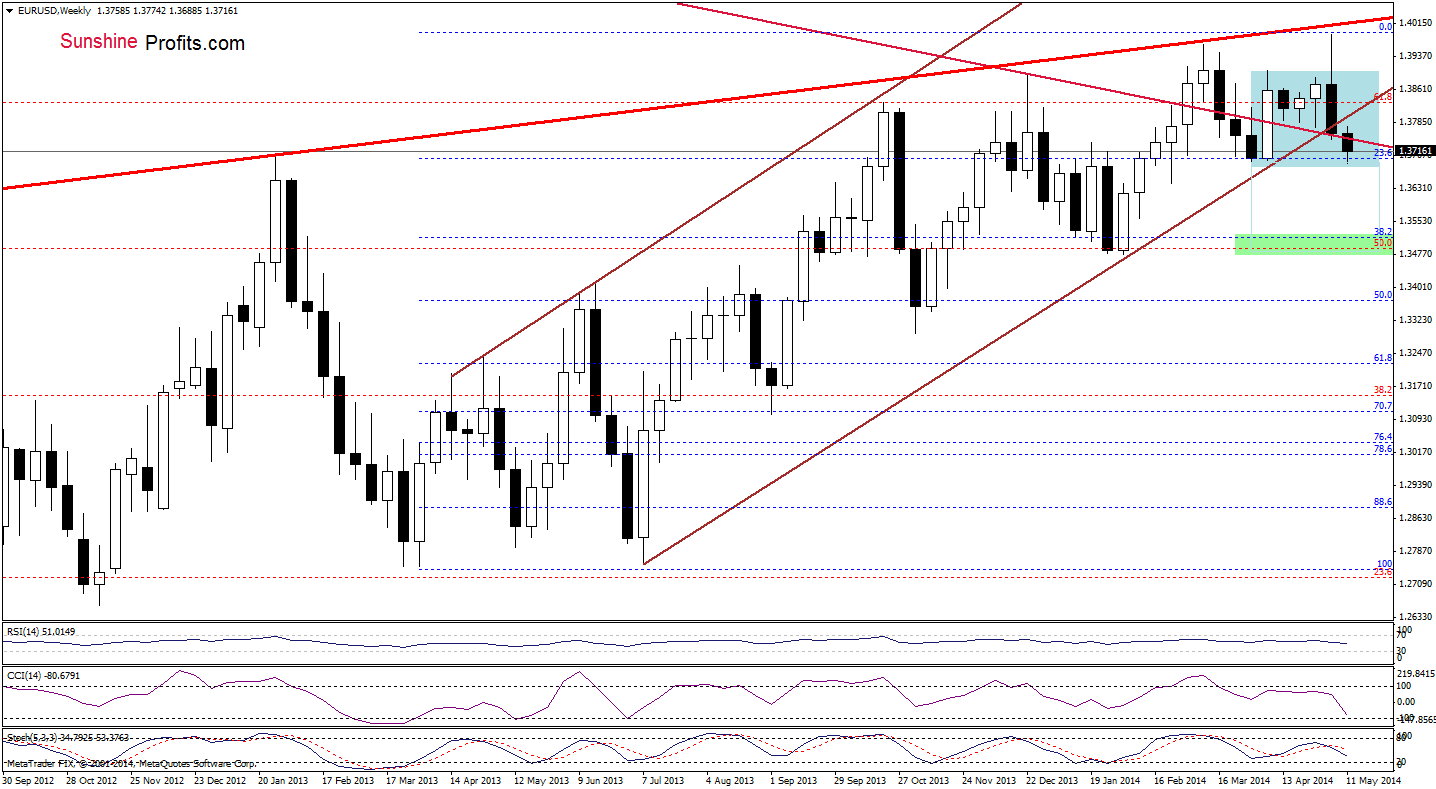
From this perspective, we see that the situation hasn’t changed much as EUR/USD is trading slightly above the lower border of the consolidation, but still below the previously-broken long-term declining line, which serves as resistance at the moment. Therefore, what we wrote yesterday is up-to-date:
(…) the exchange rate is currently trading slightly above the lower border of the consolidation. Will this support level be strong enough to withstand the selling pressure? In the very short term it may decelerate (or even pause) further deterioration. However, in a broader time perspective, we think that the breakdown below the long-term support line will be more important for forex traders . Why? Because although we saw similar price action in March, this time EUR/USD hasn’t got support from the lower border of the rising trend channel. To us, this is a strong bearish factor that signifies that further deterioration is just around the corner.
Having discussed the above, let’s focus on the short-term perspective.
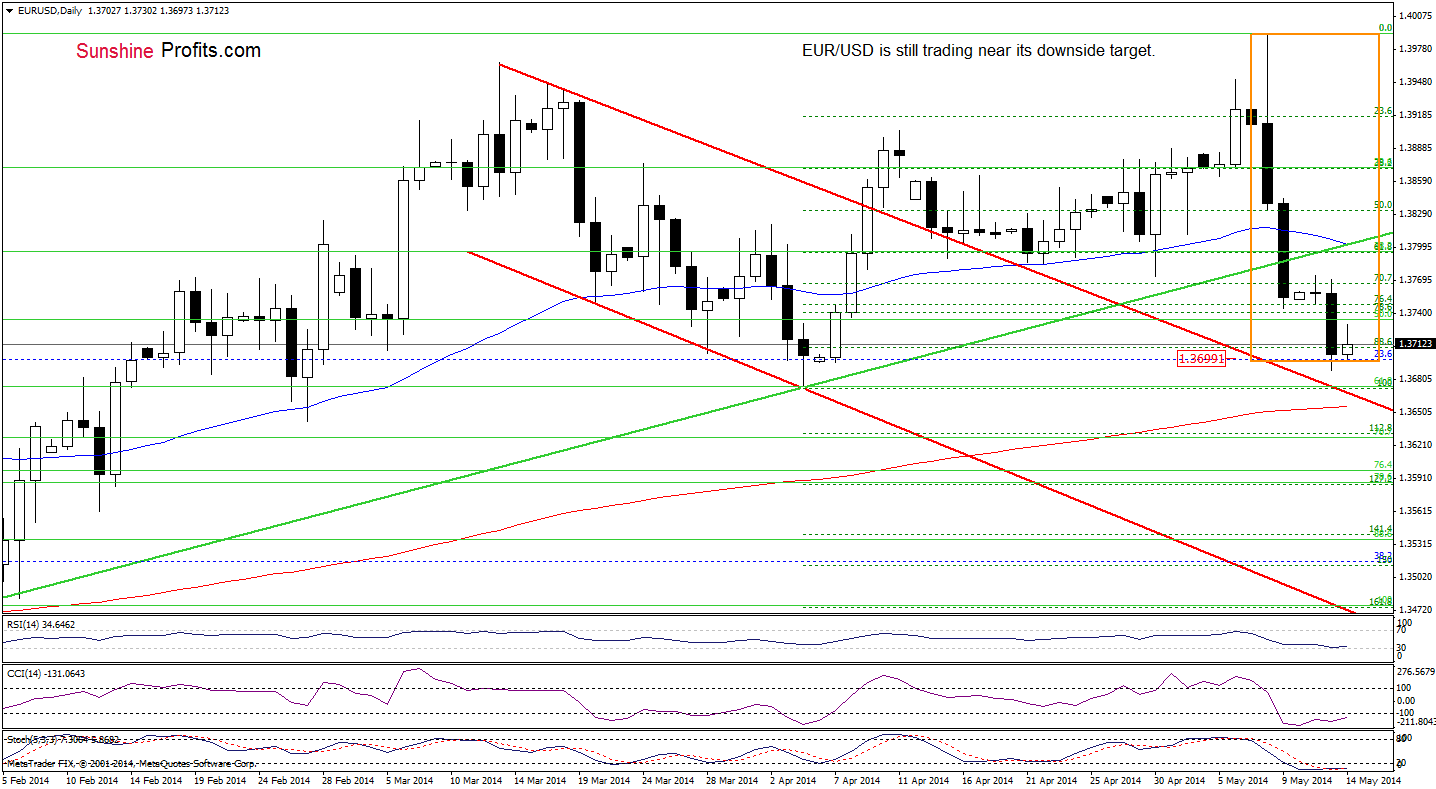
Quoting our last Forex Trading Alert:
(…) EUR/USD realized the (…) scenario, which may reduce the selling pressure and trigger a corrective upswing in the coming day (or days) – especially if the 23.6% Fibonacci retracement holds.
As you see on the above chart, we noticed such price action earlier today. However, taking into account the size of the declines that we saw in the recent days, this upswing is too small to change not only the short-term outlook, but also the very short-term picture, which remains bearish. Therefore, another attempt to move lower is still likely. If this is the case, we are convinced that the next downside target will be the upper line of the declining trend channel, which currently intersects the 61.8% Fibonacci retracement (based on the entire Feb-May rally). Connecting the dots, we remain bearish as EUR/USD declined below the long-term support line and think that further deterioration is just around the corner. Therefore, short positions opened last week are still justified and it seems to us that they will become even more profitable shortly.
Very short-term outlook: bearish
Short-term outlook: bearish
MT outlook: bearish
LT outlook: bearish
Trading position (short-term): Short. Stop-loss order: 1.4040. We will keep you informed should anything change, or should we see a confirmation/invalidation of the above.
USD/CHF
From the weekly perspective, the situation hasn’t changed much as USD/CHF is still trading above the upper border of the declining wedge. Today, we’ll examine the daily chart to find out where currency bulls could be stopped.
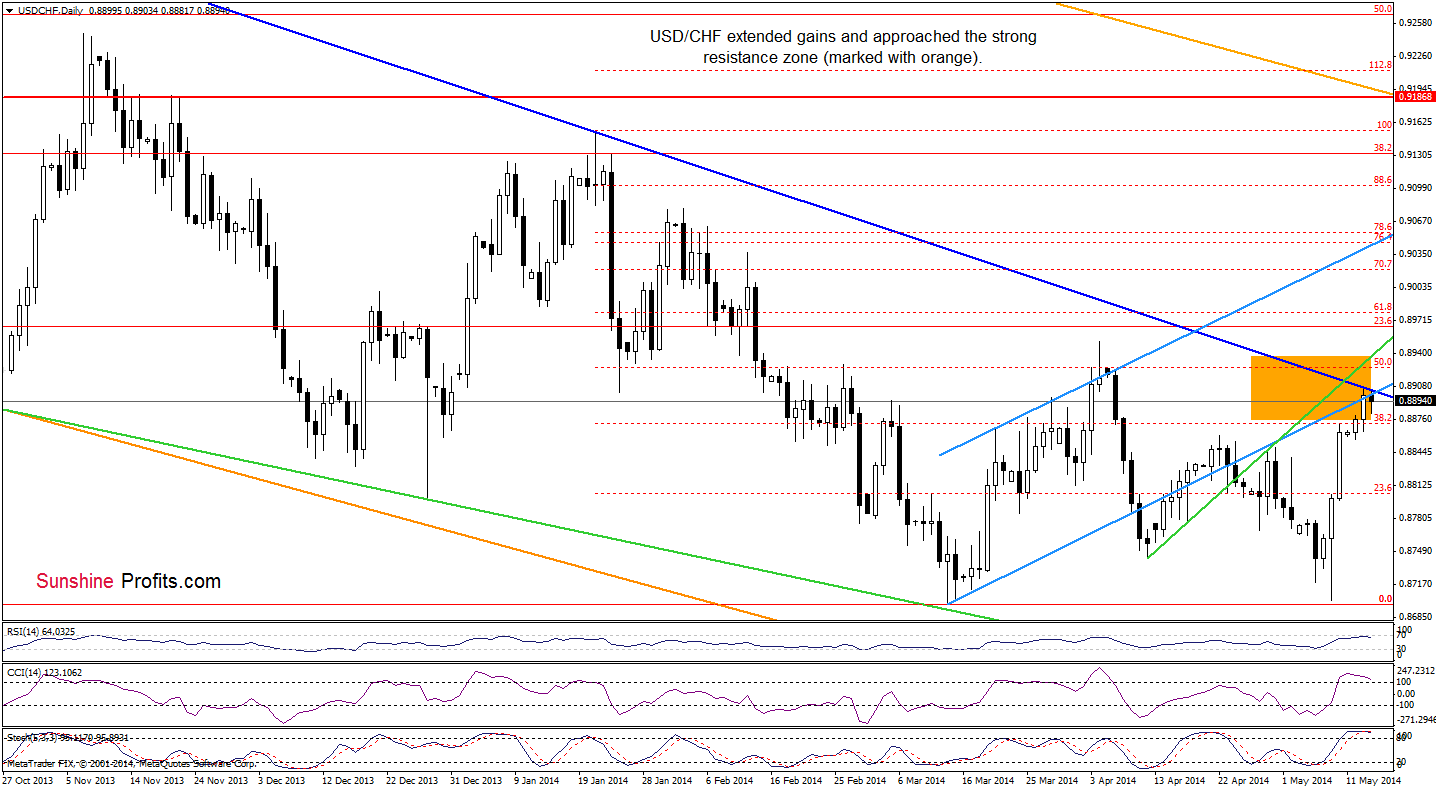
On Monday, we wrote the following:
(…) The exchange rate (…) approached the lower border of the rising trend channel (…) even if (…) the pair breaks above this resistance, the medium-term declining blue line (based on the Sept. and Jan. highs) and the very short-term green line (which is definitely less important at the moment) may stop further improvement. Additionally, the CCI and Stochastic Oscillator are overbought, which increases the risk of trend reversal.
Looking at the above chart, we see that the pair reached the above-mentioned resistance zone yesterday. Earlier today, we saw the first attempt to move lower, which suggests that trend reversal is still in play. In our opinion, if the exchange rate closes the day below the lower border of the rising trend channel (invalidating the breakout above this resistance line), we will likely see a pullback to at least 0.8858, where Monday low and the 23.6% Fibonacci retracement based on the recent rally are. Finishing our commentary on this currency pair, please note that the RSI climbed its highest level since April peak. Back then, such high reading of the indicator preceded a bigger correction. Therefore, if history repeats itself, we’ll see USD/CHF lower. Additionally, there is a negative divergence between the CCI and the exchange rate, which reinforce the bearish scenario.
Very short-term outlook: bearish
Short-term outlook: mixed
MT outlook: mixed with bullish bias
LT outlook: bearish
Trading position (short-term): In our opinion no positions are justified from the risk/reward perspective. We will keep you informed should anything change, or should we see a confirmation/invalidation of the above.
AUD/USD
The overall situation in the medium term hasn’t changed much as the exchange rate still remains in the consolidation range. Today, we’ll focus only on the very short-term changes.
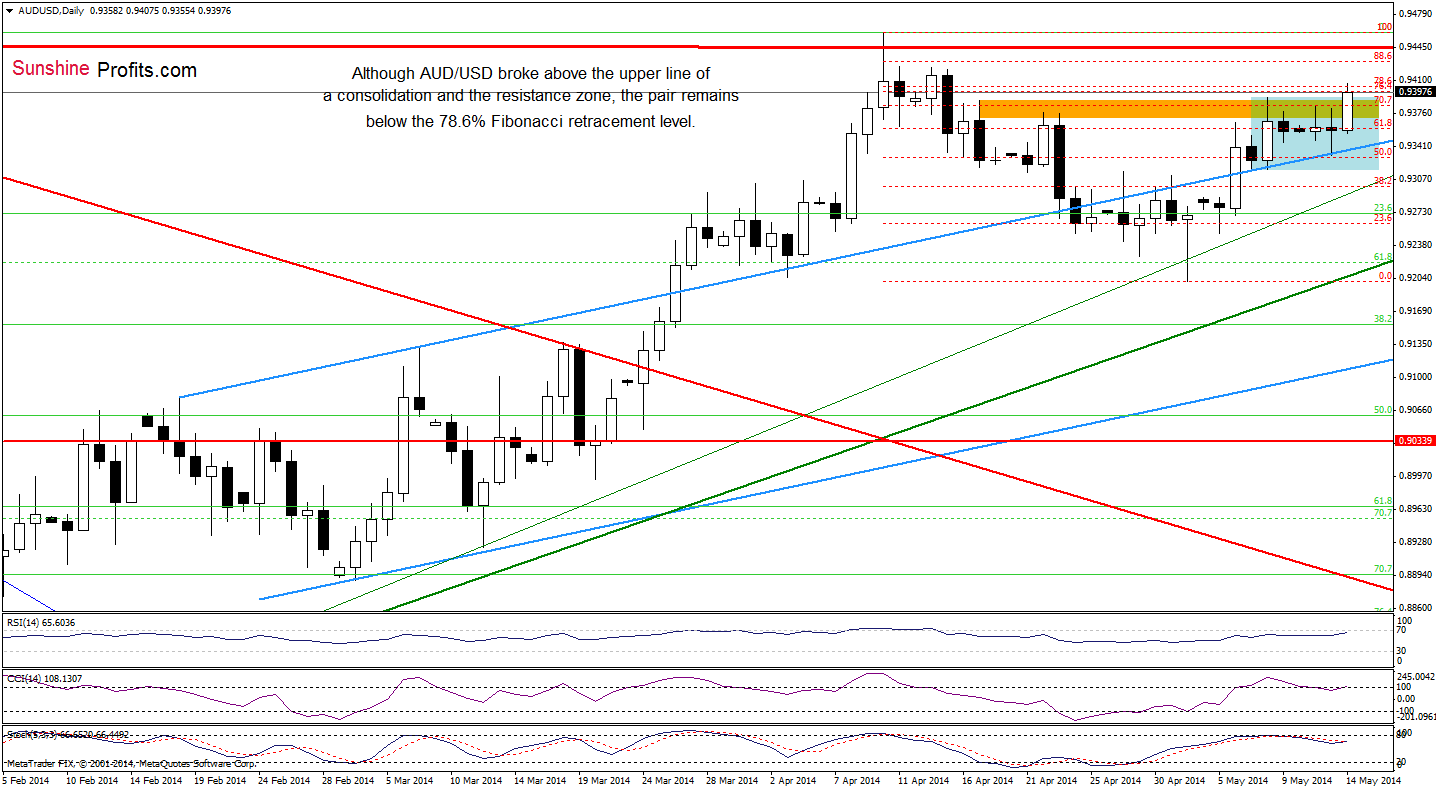
From this perspective, we see that the pair extended gains and broke above the strong resistance zone. Although this is a bullish signal, we remain skeptical. Why? In our opinion, there are a number of signs that at least a pullback in AUD/USD is close. First, the exchange rate reached the next resistance zone created by the 76.4% and 78.6% Fibonacci retracement levels (based on the entire recent decline). From our experience, this area usually stops (or at least decelerates) further improvement. Secondly, when we take a closer look at the daily chart, we notice a 5-wave sequence, which suggests that the correction is likely to be seen. Another negative signs come from the indicators. As you see, the RSI remains at its highest level since April high, while the CCI and Stochastic Oscillator generated sell signals. Additionally, there are negative divergences between them and the exchange rate, which increases the risk of trend reversal. Connecting the dots, we remain bearish.
Very short-term outlook: bearish
Short-term outlook: bearish
MT outlook: bearish
LT outlook: bearish
Trading position (short-term): Short. Stop-loss order: 0.9410 and initial price target: the lower border of the blue rising trend channel (currently at 0.9060). We will keep you informed should anything change, or should we see a confirmation/invalidation of the above.
Thank you.
Nadia Simmons
Forex & Oil Trading Strategist
Przemyslaw Radomski, CFA
Founder, Editor-in-chief
Gold & Silver Trading Alerts
Forex Trading Alerts
Oil Investment Updates
Oil Trading Alerts

