
Earlier today, the ZEW Institute showed that its index of German economic sentiment fell to a 16-month low this month. Additionally, the ZEW Institute reported that its economic sentiment index for the entire euro zone also moved down to 55.2 in May, from a reading of 61.2 the previous month. These disappointing numbers pushed the common currency to a 1-month low against the U.S. dollar. In this way, EUR/USD dropped to its downside target, but is it enough to trigger a corrective upswing?
In our opinion the following forex trading positions are justified - summary:
- EUR/USD: short (stop-loss order: 1.4040)
- GBP/USD: none
- USD/JPY: none
- USD/CAD: none
- USD/CHF: none
- AUD/USD: short (stop-loss order: 0.9410; initial price target: 0.9060)
EUR/USD
Yesterday, we wrote the following:
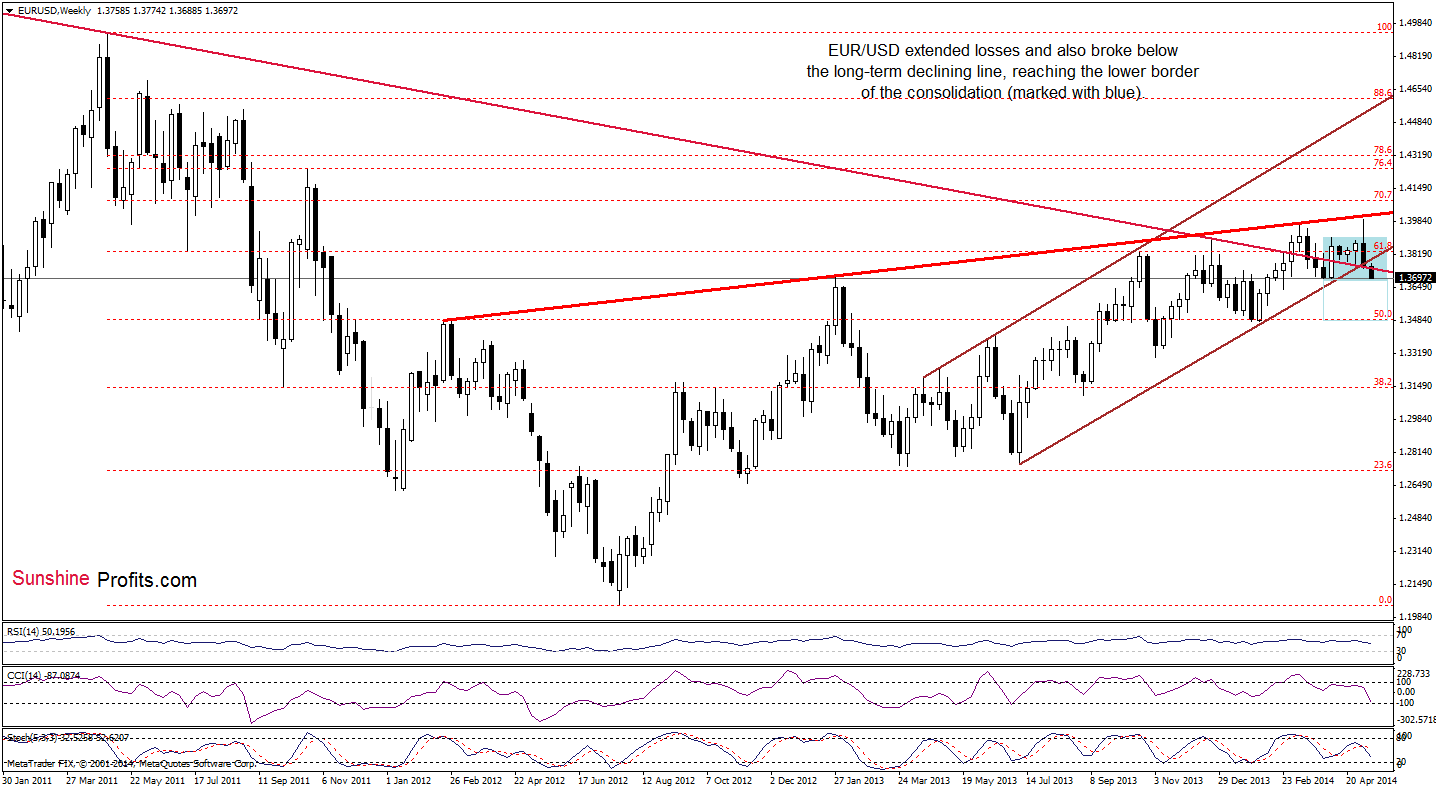
(…) EUR/USD extended losses and dropped below the lower border of the rising trend channel. Taking this bearish signal into account, we are convinced that the last support that can stop the selling pressure is the long-term declining line (…) If this strong support area holds, we may see a corrective upswing in the coming week. However, if it is broken, the exchange rate will likely drop to the lower border of the consolidation (marked with blue) created by the April low of 1.3696.
Earlier today, we noticed such price action and the exchange rate is currently trading slightly above the lower border of the consolidation. Will this support level be strong enough to withstand the selling pressure? In the very short term it may decelerate (or even pause) further deterioration. However, in a broader time perspective, we think that the breakdown below the long-term support line will be more important for forex traders . Why? Because although we saw similar price action in March, this time EUR/USD hasn’t got support from the lower border of the rising trend channel. To us, this is a strong bearish factor that signifies that further deterioration is just around the corner.
Having discussed the above, let’s focus on the short-term perspective.
Quoting our last Forex Trading Alert:
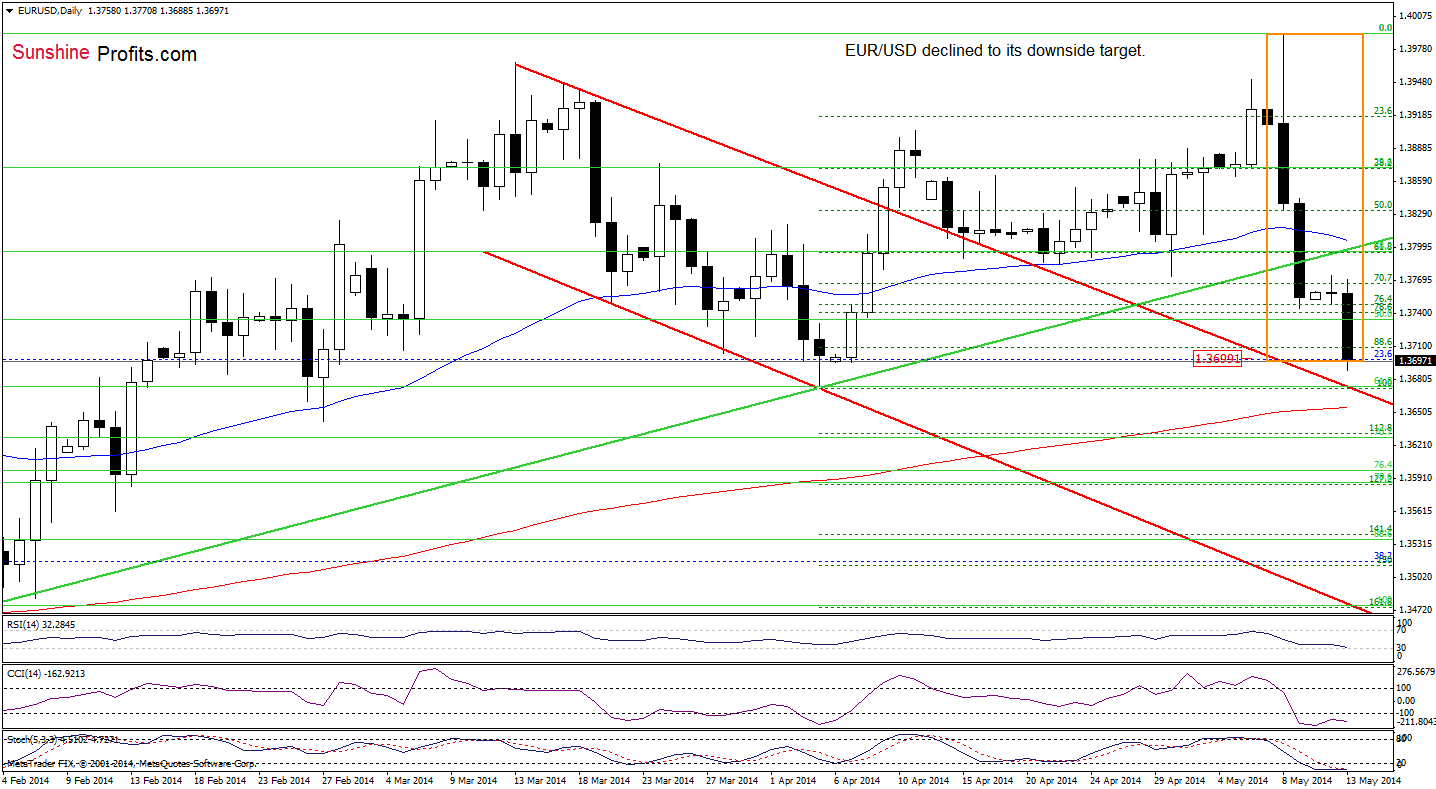
(…) the exchange rate hit an intraday low of 1.3745, approaching its downside target (…) Will it drop any further from here? We remain convinced that the answer is yes. However, before EUR/USD extends losses, we will need a breakdown below the nearest support zone (created by the 76.4% and 78.6% Fibonacci retracement levels based on the Apr.-May rally). If it happens, we’ll see a decline to around 1.3700 (where the 23.6% Fibonacci retracement based on the entire Apr. 2013-May 2014 rally is).
The above chart, clearly illustrates that EUR/USD realized the above-mentioned scenario, which may reduce the selling pressure and trigger a corrective upswing in the coming day (or days) – especially if the 23.6% Fibonacci retracement holds. However, if this support level is broken, we are convinced that the next downside target will be the upper line of the declining trend channel, which currently intersects the 61.8% Fibonacci retracement (based on the entire Feb-May rally). Connecting the dots, we remain bearish as EUR/USD declined below the long-term support line and think that further deterioration is just around the corner. Therefore, short positions opened last week are still justified and it seems to us that they will become even more profitable shortly.
Very short-term outlook: bearish
Short-term outlook: bearish
MT outlook: bearish
LT outlook: bearish
Trading position (short-term): Short. Stop-loss order: 1.4040. We will keep you informed should anything change, or should we see a confirmation/invalidation of the above.
AUD/USD
The overall situation in the medium term hasn’t changed much as the exchange rate still remains in the consolidation range. Today, we’ll focus only on the daily chart.
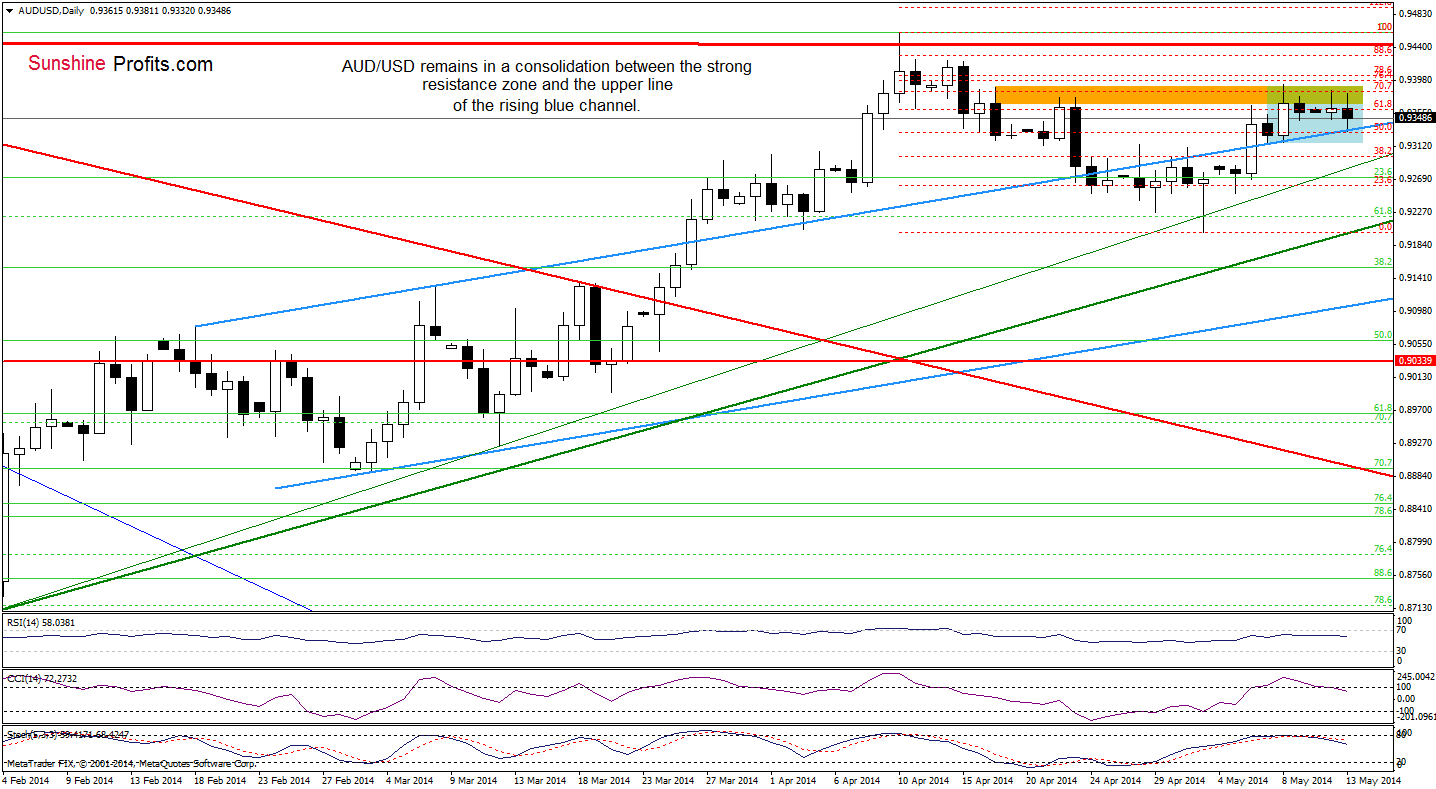
From this perspective, we see that AUD/USD declined to the blue support line and then rebounded, reaching the strong resistance zone once again. Despite these moves, none of them trigger a breakout or a breakdown, which underlines how important for forex traders they are. In our opinion, as long as they remain in play a bigger move to the downside (or upside) is not likely to be seen. Nevertheless, we think that the combination of the Apr. 14 and Apr. 22 highs, the 70.7% Fibonacci retracement based on the entire recent decline and the 38.2% Fibonacci retracement based on the entire Apr.-Jan. declines (the above-mentioned resistance zone) is much stronger than a single support line and the next move will be to the downside (especially, when we factor in sell signals generated by the indicators).
Finishing our commentary on this currency pair, we would like to draw your attention to a bearish signal that we discussed in our Forex Trading Alert posted on Friday:
(…) In our opinion, the current declines will accelerate, if the indicators generate sell signals. Please note that the CCI and Stochastic Oscillator are at their highest levels since the April peak. Back then, such high readings preceded a bigger correction. Therefore, if history repeats itself, we will likely see a drop not only below the blue and green support lines, but also a test of the strength of the medium-term green support line based on the Jan. lows (currently around 0.9180).
Taking all the above into account, we remain bearish.
Very short-term outlook: bearish
Short-term outlook: bearish
MT outlook: bearish
LT outlook: bearish
Trading position (short-term): Short. Stop-loss order: 0.9410 and initial price target: the lower border of the blue rising trend channel (currently at 0.9060). We will keep you informed should anything change, or should we see a confirmation/invalidation of the above.
Thank you.
Nadia Simmons
Forex & Oil Trading Strategist
Przemyslaw Radomski, CFA
Founder, Editor-in-chief
Gold & Silver Trading Alerts
Forex Trading Alerts
Oil Investment Updates
Oil Trading Alerts

