
Although the National Australia Bank reported earlier today that its business confidence index rose to 6 in April (from a reading of 4 in March), the Australian dollar was almost unchanged against its U.S. counterpart. Does this lack of reaction suggest upcoming weakness in AUD/USD?
In our opinion the following forex trading positions are justified - summary:
- EUR/USD: short (stop-loss order: 1.4040)
- GBP/USD: none
- USD/JPY: none
- USD/CAD: none
- USD/CHF: none
- AUD/USD: short (stop-loss order: 0.9410; initial price target: 0.9060)
EUR/USD
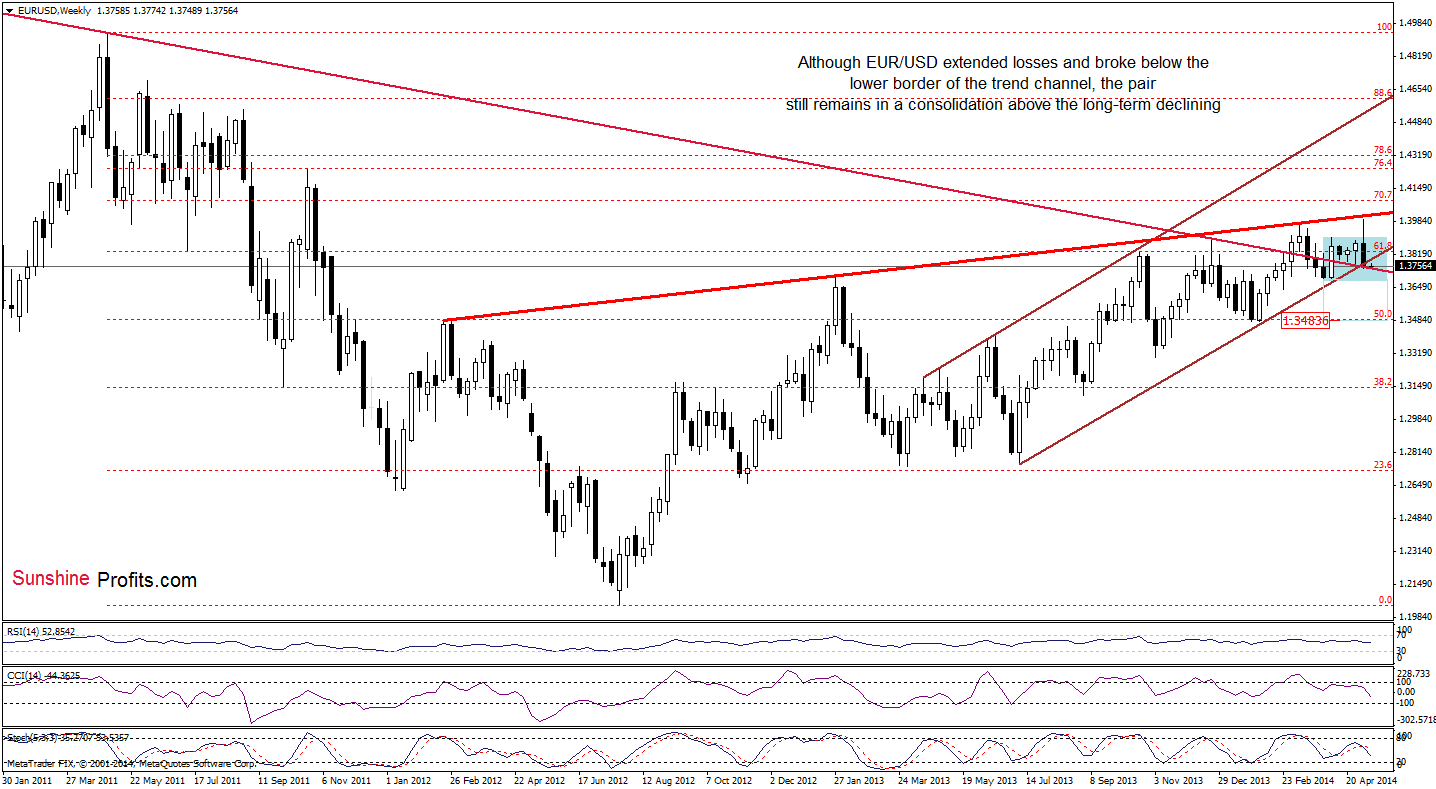
Looking at the above chart, we clearly see that the situation has deteriorated as EUR/USD extended losses and dropped below the lower border of the rising trend channel. Taking this bearish signal into account, we are convinced that the last support that can stop the selling pressure is the long-term declining line (currently around 1.3744). Therefore, what we wrote in our last Forex Trading Alert is up-to-date:
(…) If this strong support area holds, we may see a corrective upswing in the coming week. However, if it is broken, the exchange rate will likely drop to the lower border of the consolidation (marked with blue) created by the April low of 1.3696. From this perspective, we see that there are negative divergences between the CCI, Stochastic Oscillator and the exchange rate, which suggest that the bottom of the current correction is still ahead us.
Will the short-term picture give us clues where the exchange head next? Let’s check.
On Friday, we wrote the following:
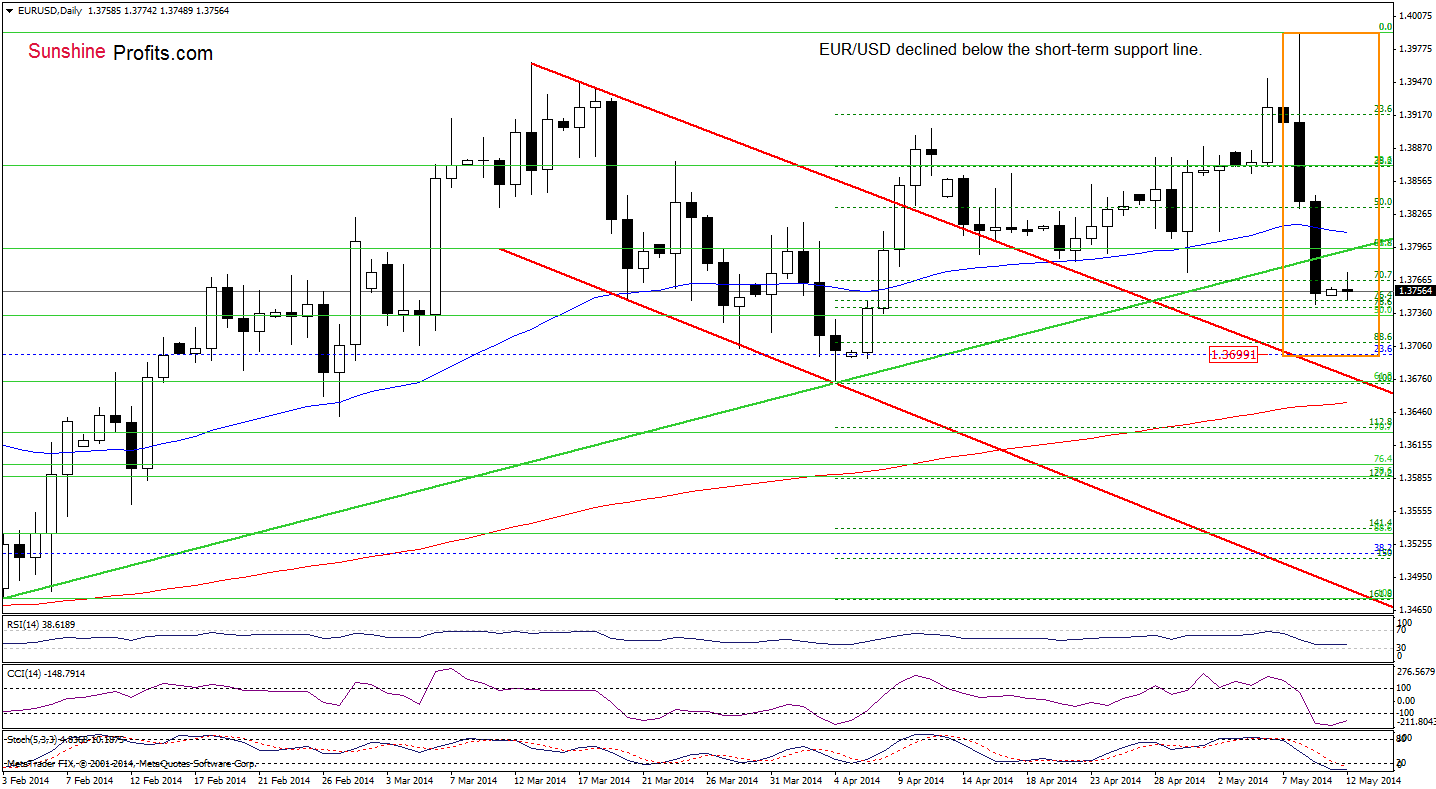
(…) it seems to us that the next downside target that may pause or stop (but the latter is less likely) the current correction is the 50% Fibonacci retracement (around 1.3735). If it holds, we may see a corrective upswing to the previously-broken green support line. However, if it is broken, we will likely see a drop to the upper line of the declining trend channel (currently around 1.3692) in the coming days.
On the above chart, we see that the exchange rate hit an intraday low of 1.3745, approaching its downside target on Friday. Since then the situation hasn’t changed much as the pair is still trading slightly above this level. Will it drop any further from here? We remain convinced that the answer is yes. However, before EUR/USD extends losses, we will need a breakdown below the nearest support zone (created by the 76.4% and 78.6% Fibonacci retracement levels based on the Apr.-May rally). If it happens, we’ll see a decline to around 1.3700 (where the 23.6% Fibonacci retracement based on the entire Apr. 2013-May 2014 rally is) or even to the above-mentioned upper line of the declining trend channel (currently around 1.3682). Connecting the dots, we remain bearish and think that short positions opened on Thursday are still justified and it seems to us that they will become even more profitable shortly.
Very short-term outlook: bearish
Short-term outlook: bearish
MT outlook: bearish
LT outlook: bearish
Trading position (short-term): Short. Stop-loss order: 1.4040. We will keep you informed should anything change, or should we see a confirmation/invalidation of the above.
USD/CHF
Quoting our last Forex Trading Alert:
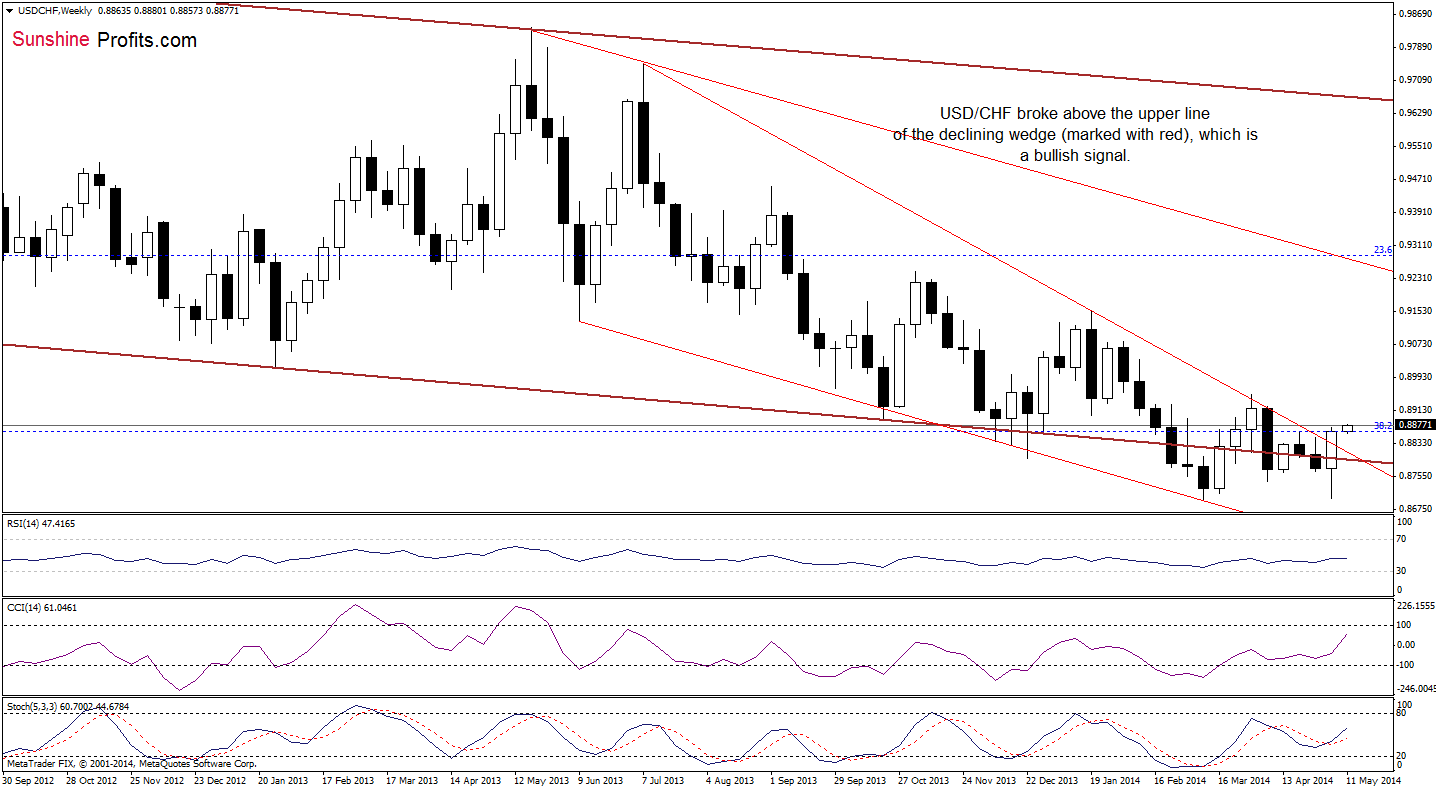
(…) a sharp corrective upswing (…) took USD/CHF above the upper border of the declining wedge. Although the breakout above this resistance line is not confirmed at the moment, we think that this is a strong bullish signal and further improvement is likely to be seen. In our opinion, if the breakout is not invalidated, the exchange rate may extend rally to around the April high of 0.8922.
Earlier today, USD/CHF extended gains and climbed above the last week’s high, which suggests the above-mentioned bullish scenario is likely to be seen in the coming days.
Having discussed that, let’s check the daily chart to find out is there anything on the horizon that could stop further improvement in the short term.
On Friday, we wrote the following:
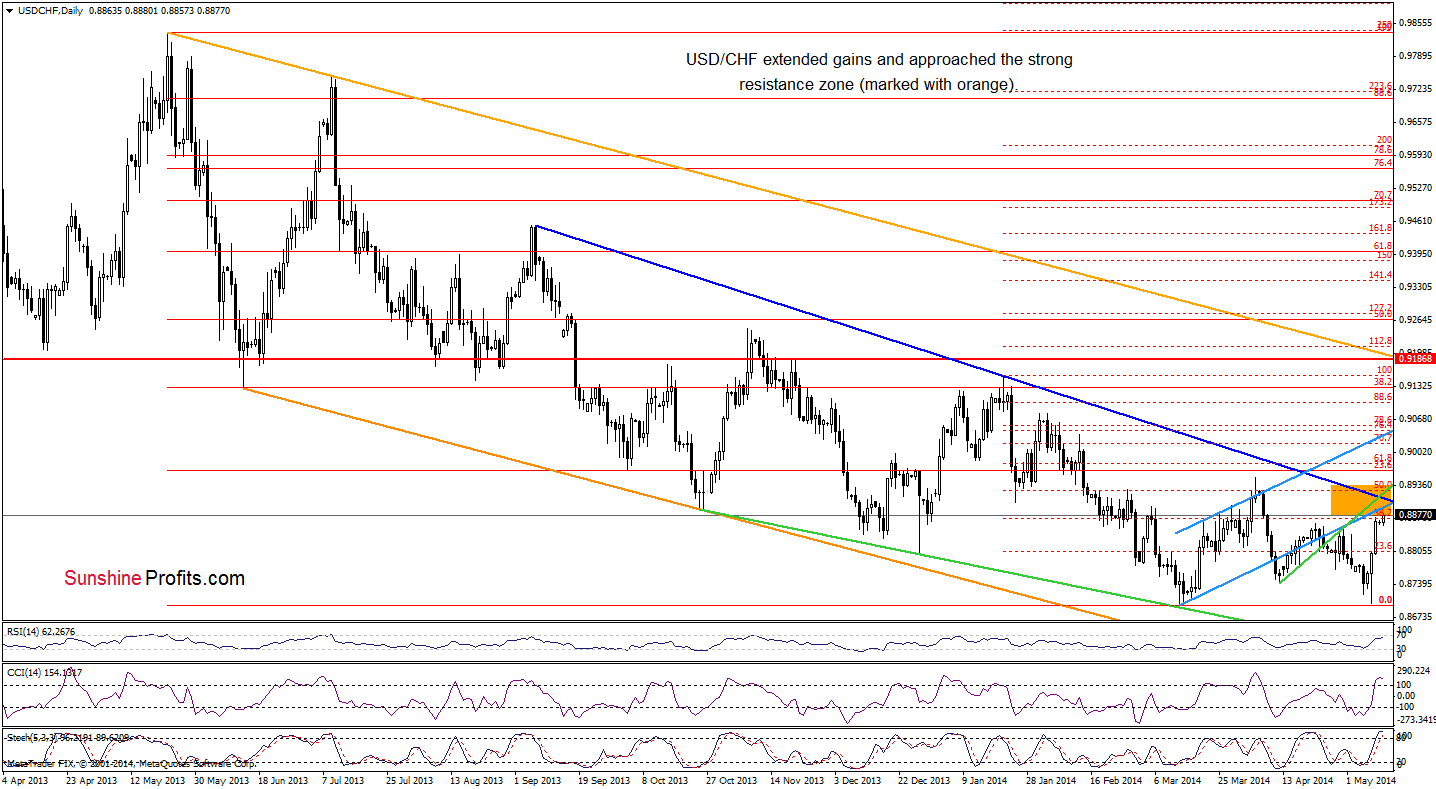
(…) USD/CHF approached the resistance zone based on the recent high, which may decelerate further improvement. Nevertheless, taking into account the breakout above the medium-term resistance (the upper line of the declining wedge) and buy signals generated by the indicators, it seems doubtful that the pair will not rise any further. In our opinion, the resistance, which may pause the rally is around 0.8884 where the lower border of the rising trend channel is.
The above chart clearly shows that we noticed such price action on Friday. The exchange rate not only broke above the resistance zone, but also approached the lower border of the rising trend channel, which successfully decelerated gains in mid-April and stopped rally at the end of the previous month. Will history repeat once again? In opinion, such scenario cannot be ruled out. Why? Because even if forex traders push the buy button and the pair breaks above this resistance, the medium-term declining blue line (based on the Sept. and Jan. highs) and the very short-term green line (which is definitely less important at the moment) may stop further improvement. Additionally, the CCI and Stochastic Oscillator are overbought, which increases the risk of trend reversal. Therefore, we think that it’s worth to keep an eye on this currency pair, because a profitable opportunity might be just around the corner.
Very short-term outlook: mixed
Short-term outlook: mixed
MT outlook: mixed with bullish bias
LT outlook: bearish
Trading position (short-term): In our opinion no positions are justified from the risk/reward perspective. We will keep you informed should anything change, or should we see a confirmation/invalidation of the above.
AUD/USD
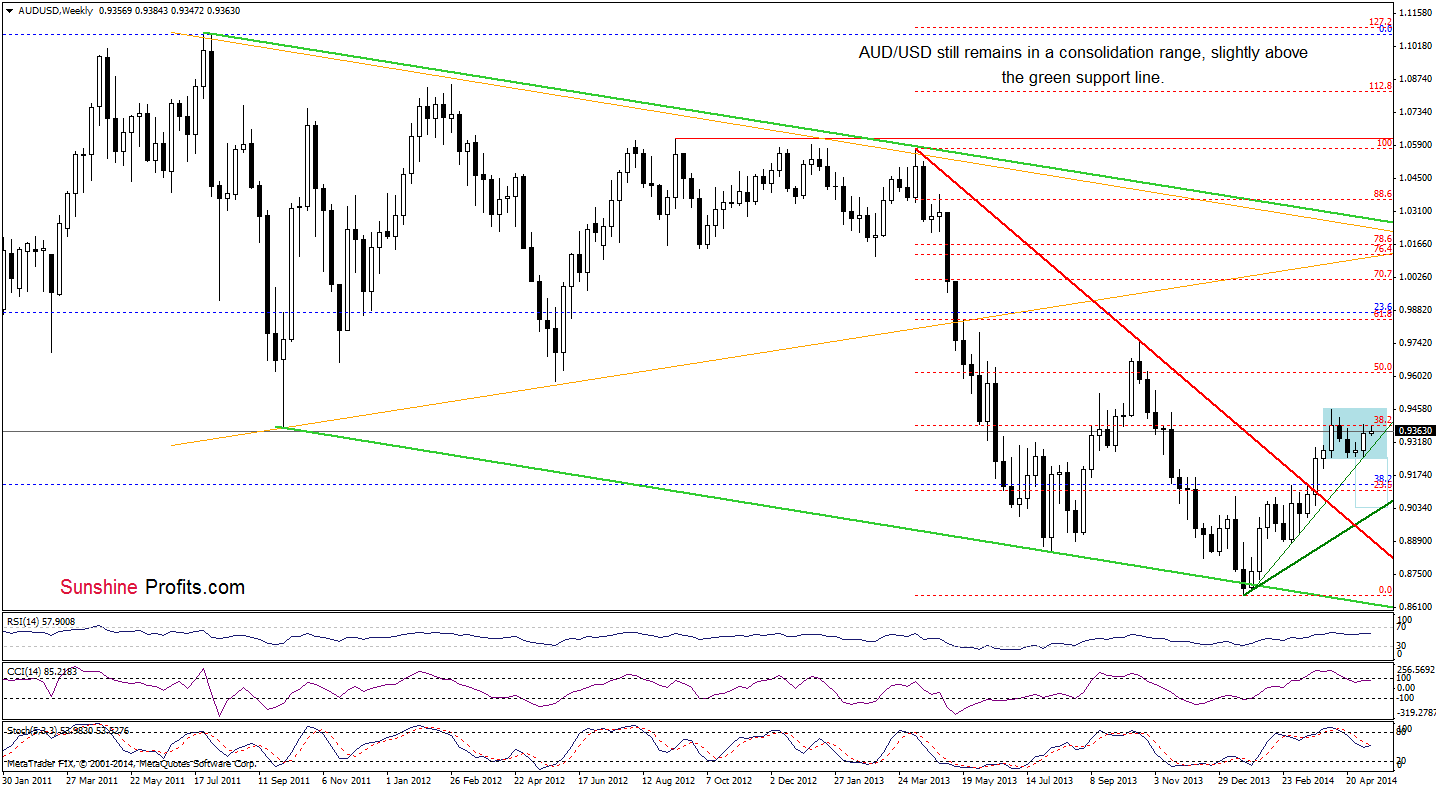
The overall situation in the medium term hasn’t changed much as the exchange rate still remains in the consolidation range. Therefore, what we wrote on Friday is up-to-date:
(…) Although AUD/USD extended gains, from this perspective, we see that the pair reached the previously-broken 38.2% Fibonacci retracement (based on the entire Apr.-Jan. declines), which serves as resistance. If it holds, we will likely see a pullback and the downside target will be the green support line (which corresponds to the lower corder of the consolidation at the moment). On the other hand, if we see a breakout above the nearest resistance level, AUD/USD will likely climb to the April high. In our opinion, the first scenario is more likele as sell signals generated by the CCI and Stochastic Oscillator remain in place.
Once we know the above, let’s focus on changes in the short term.
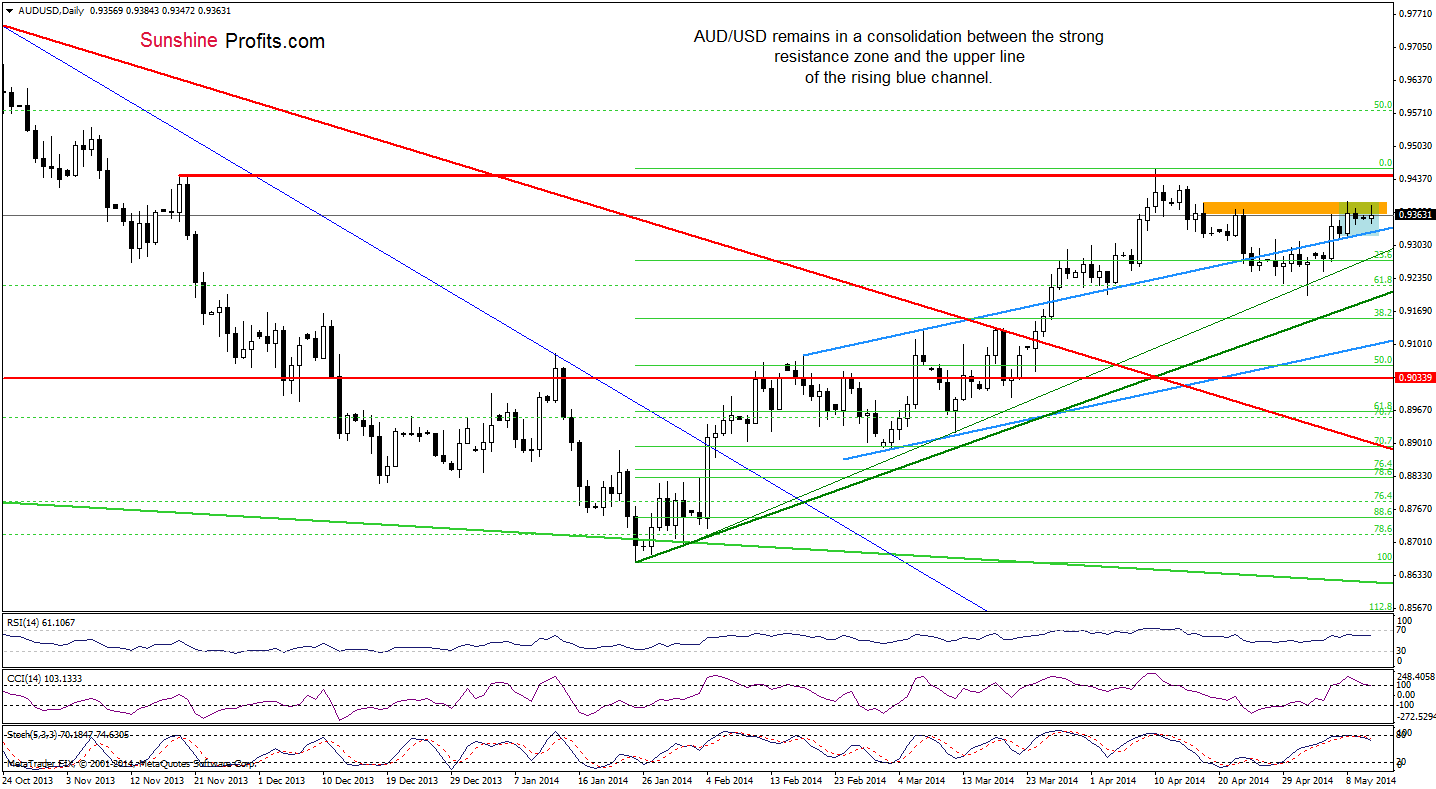
From the daily perspective, we see that AUD/USD is currently consolidating. This is not surprising as it has reached a strong resistance zone (created by the Apr. 14 and Apr. 22 highs, the 70.7% Fibonacci retracement based on the entire recent decline and reinforced by the 38.2% Fibonacci retracement based on the entire Apr.-Jan. declines) and it may take some time before a breakout higher becomes likely. Please note that the Stochastic Oscillator generated a sell signal, while the CCI is very close to doing it. At this point, we would like to draw your attention to a bearish signal that we discussed in our last Forex Trading Alert:
(…) In our opinion, the current declines will accelerate, if the indicators generate sell signals. Please note that the CCI and Stochastic Oscillator are at their highest levels since the April peak. Back then, such high readings preceded a bigger correction. Therefore, if history repeats itself, we will likely see a drop not only below the blue and green support lines, but also a test of the strength of the medium-term green support line based on the Jan. lows (currently around 0.9180).
Taking all the above into account, we remain bearish.
Very short-term outlook: bearish
Short-term outlook: bearish
MT outlook: bearish
LT outlook: bearish
Trading position (short-term): Short. Stop-loss order: 0.9410 and initial price target: the lower border of the blue rising trend channel (currently at 0.9060). We will keep you informed should anything change, or should we see a confirmation/invalidation of the above.
Thank you.
Nadia Simmons
Forex & Oil Trading Strategist
Przemyslaw Radomski, CFA
Founder, Editor-in-chief
Gold & Silver Trading Alerts
Forex Trading Alerts
Oil Investment Updates
Oil Trading Alerts

