
Today, the U.S. dollar moved higher against major currencies as ongoing concerns over tensions in Ukraine and upbeat U.S. jobless claims data released yesterday supported the greenback. As a result, EUR/USD declined sharply, breaking below its initial downside targets, while GBP/USD dropped below major medium-term support. Additionally, the Australian dollar slipped under the key resistance zone. Does this show of weakness mean that the worst for the U.S. currency is behind us? Where the major currency pairs head in the coming week?
In our opinion the following forex trading positions are justified - summary:
- EUR/USD: short (stop-loss order: 1.4040)
- GBP/USD: none
- USD/JPY: none
- USD/CAD: none
- USD/CHF: none
- AUD/USD: short (stop-loss order: 0.9410; initial price target: 0.9060)
EUR/USD
Quoting our last Forex Trading Alert:
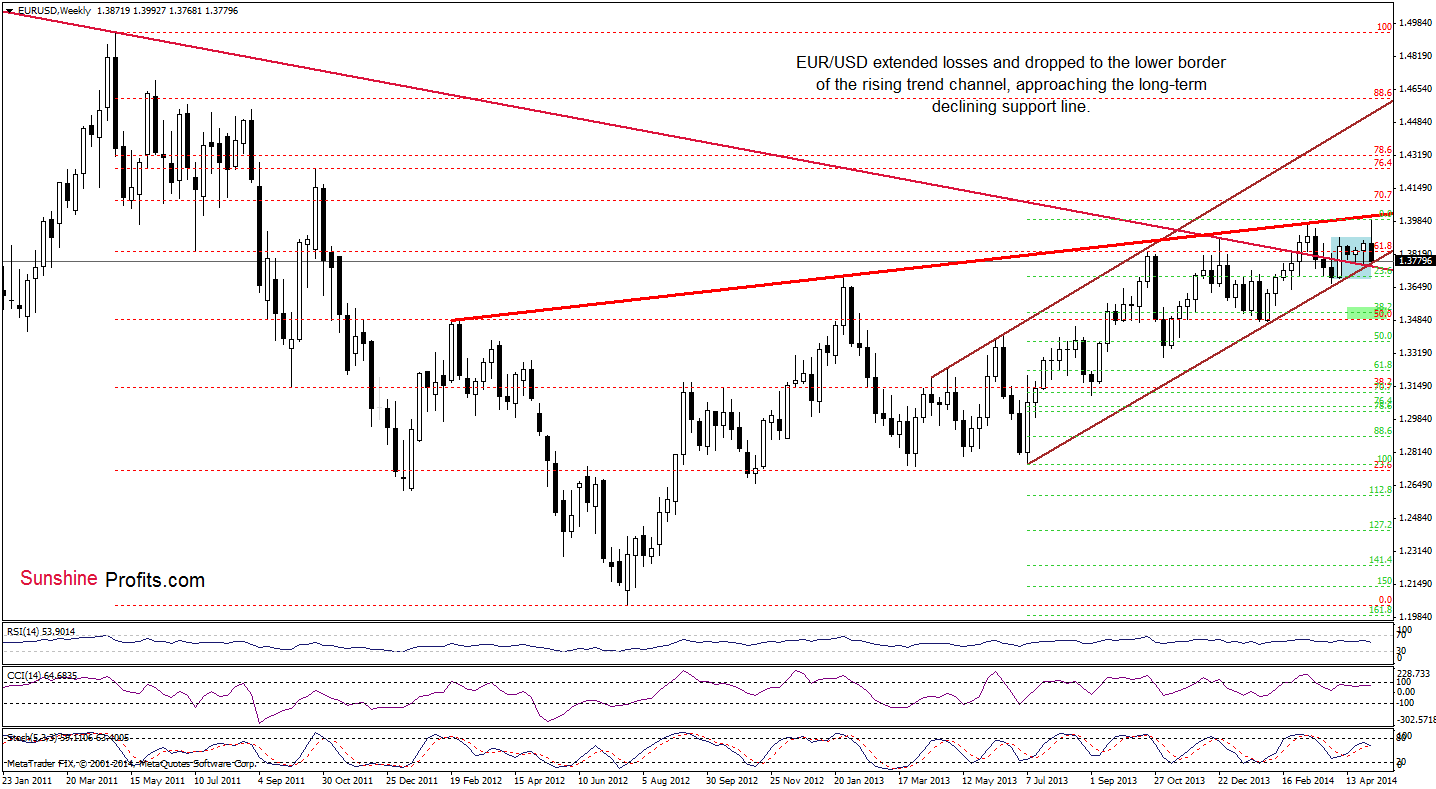
(…) a breakout above the previous high was invalidated, which is a strong bearish signal that suggests that further deterioration is just around the corner.
As it is clear from the chart above, EUR/USD extended losses and declined to the lower border of the rising trend channel, approaching the long-term declining line. If this strong support area holds, we may see a corrective upswing in the coming week. However, if it is broken, the exchange rate will likely drop to the lower border of the consolidation (marked with blue) created by the April low of 1.3696. From this perspective, we see that there are negative divergences between the CCI, Stochastic Oscillator and the exchange rate, which suggest that the bottom of the current correction is still ahead us.
Will the sort-term picture give us clues where the exchange rate could drop? Let’s find out.
In our yesterday’s Forex Trading Alert, we wrote the following:
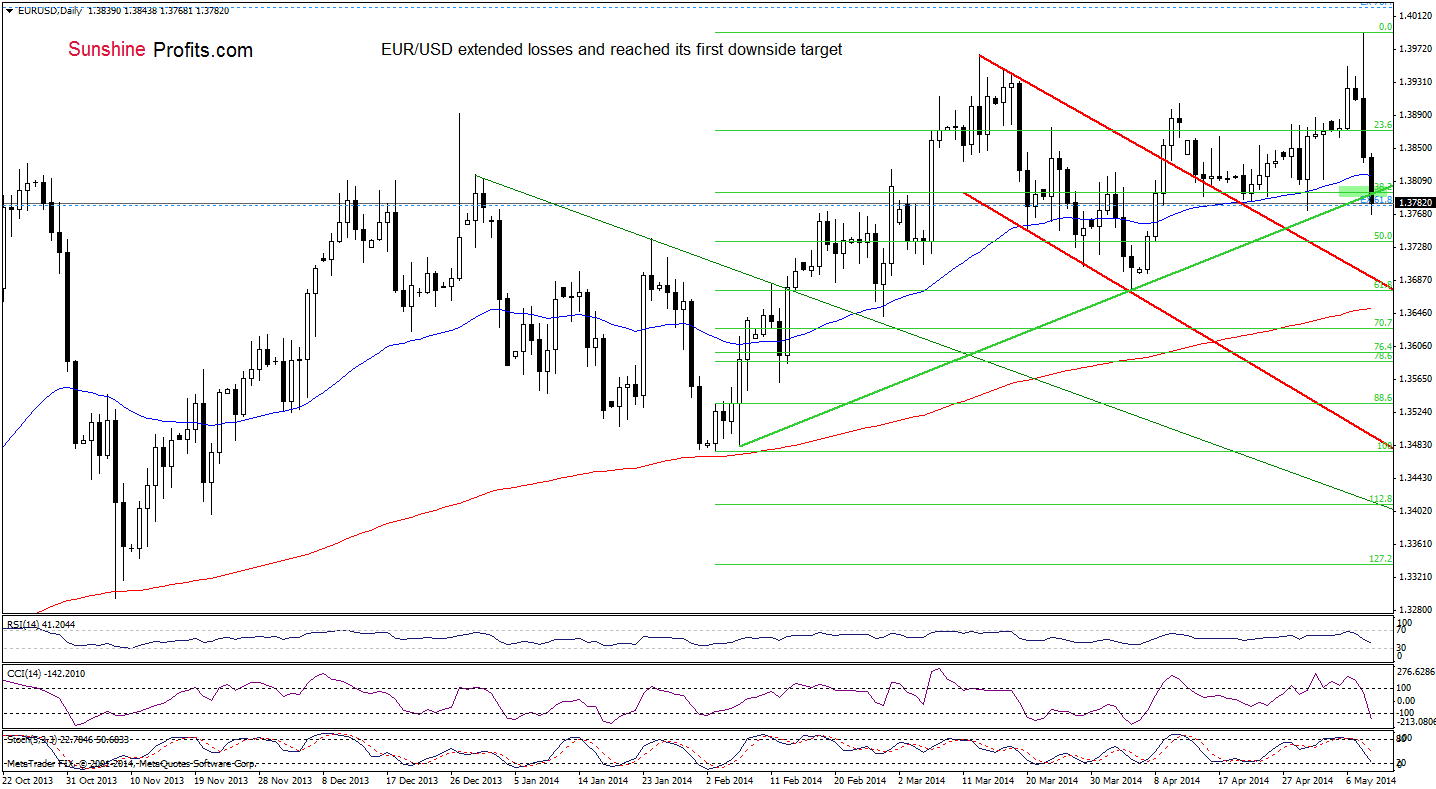
(…) The pair erased all this week’s gains and is on a path to the 50-day moving average. If this is the case, this support line may stop further declines (similarly to what we saw in the recent two weeks). However, we think that in the current circumstances, it is doubtful that EUR/USD will rebound once again. In our opinion, the downside target, which may decelerate further deterioration will be around 1.3800 where the 38.2% Fibonacci retracement and the medium-term support line are.
Looking at the above chart, we clearly see that although EUR/USD reached the above-mentioned downside targets, they didn’t manage to stop the selling pressure, which accelerate further declines. From this perspective, it seems to us that the next downside target that may pause or stop (but the latter is less likely) the current correction is the 50% Fibonacci retracement (around 1.3735). If it holds, we may see a corrective upswing to the previously-broken green support line. However, if it is broken, we will likely see a drop to the upper line of the declining trend channel (currently around 1.3692) in the coming days. Taking all the above into account, we remain bearish and think that short positions opened yesterday are still justified.
Very short-term outlook: bearish
Short-term outlook: bearish
MT outlook: bearish
LT outlook: bearish
Trading position (short-term): Short. Stop-loss order: 1.4040. We will keep you informed should anything change, or should we see a confirmation/invalidation of the above.
GBP/USD
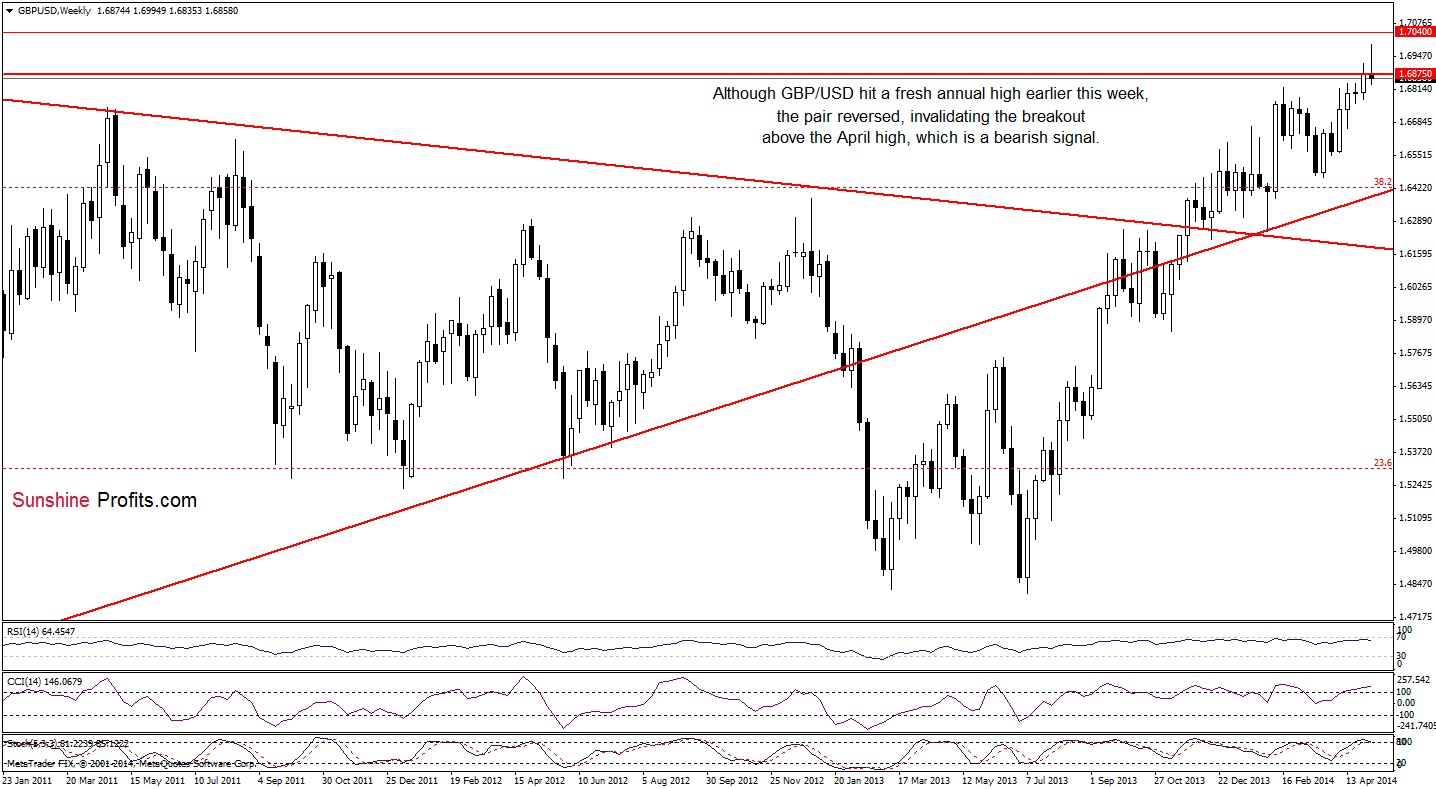
From the weekly perspective, we see that the situation has deteriorated as GBP/USD declined, invalidating the breakout above the April high. On top of that, with this downswing, the pair also invalidated the breakout above the Nov. 2009 high. In our opinion, this is a strong bearish signal, which will likely trigger further deterioration in the coming week (or even weeks) – especially when we factor in the current position of the indicators (the CCI is overbought, while the Stochastic Oscillator generated a sell signal).
How low could the exchange rate decline? Let’s take a closer look at the daily chart.
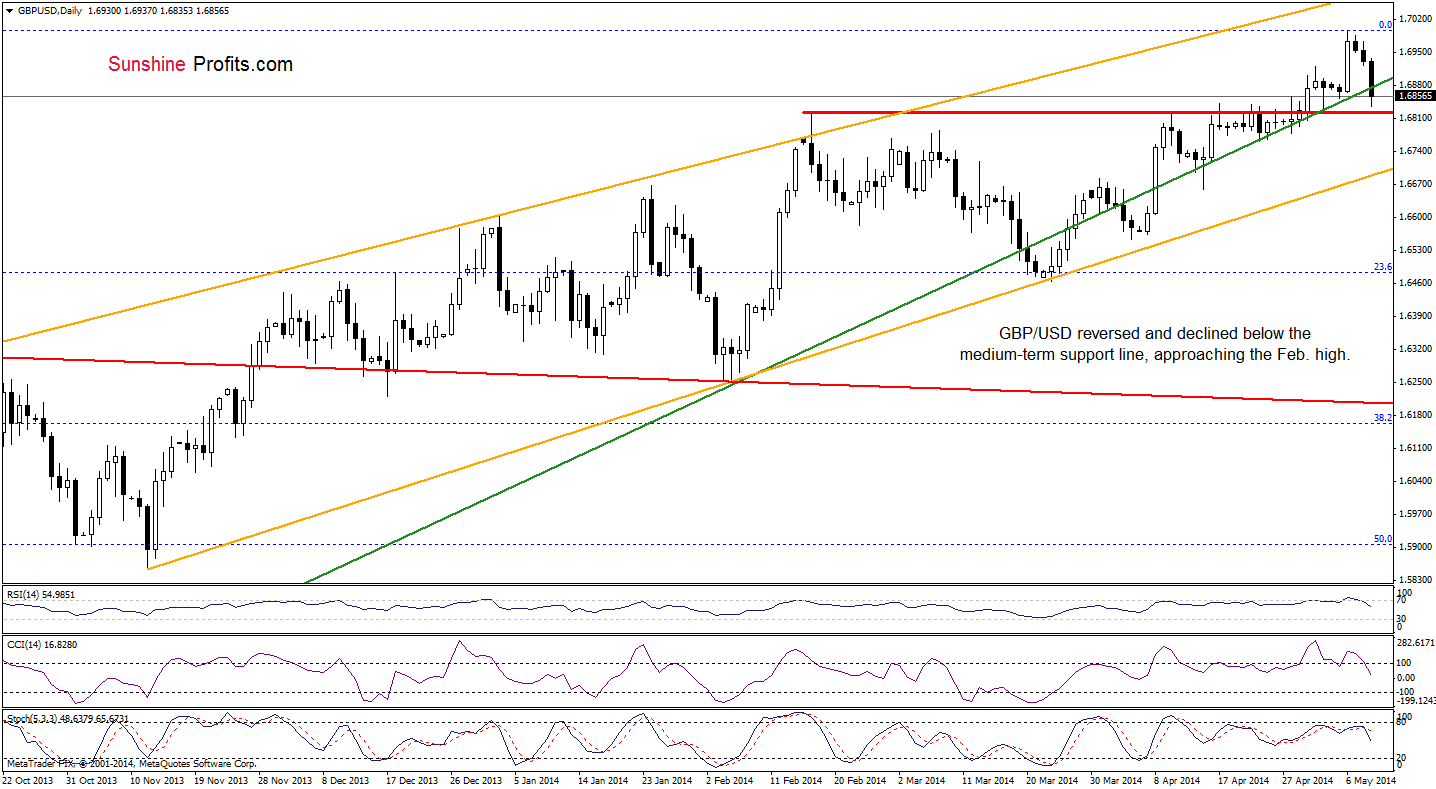
Looking at the daily chart, we see an additional bearish signal – the breakdown below the medium-term green support line, which successfully stopped several times declines in the previous month. Another warning sign comes from the indicators. They all generated sell signals, which will likely encourage forex traders to push the sell button in the coming. Nevertheless, in our opinion, it’s worth wait for a breakdown below the Feb. high before opening short positions. Why? Because in the previous month there were several drops below the medium-term green support line, but none of them trigger a sizable downswing. Therefore, we think that only if the pair invalidates the breakout above the Feb. peak, the current correction will accelerate and we’ll see a bigger downward move.
Very short-term outlook: bearish
Short-term outlook: mixed with bearish bias
MT outlook: bearish
LT outlook: mixed
Trading position (short-term): In our opinion, no positions are justified from the risk/reward perspective. We will keep you informed should anything change, or should we see a confirmation/invalidation of the above.
USD/JPY
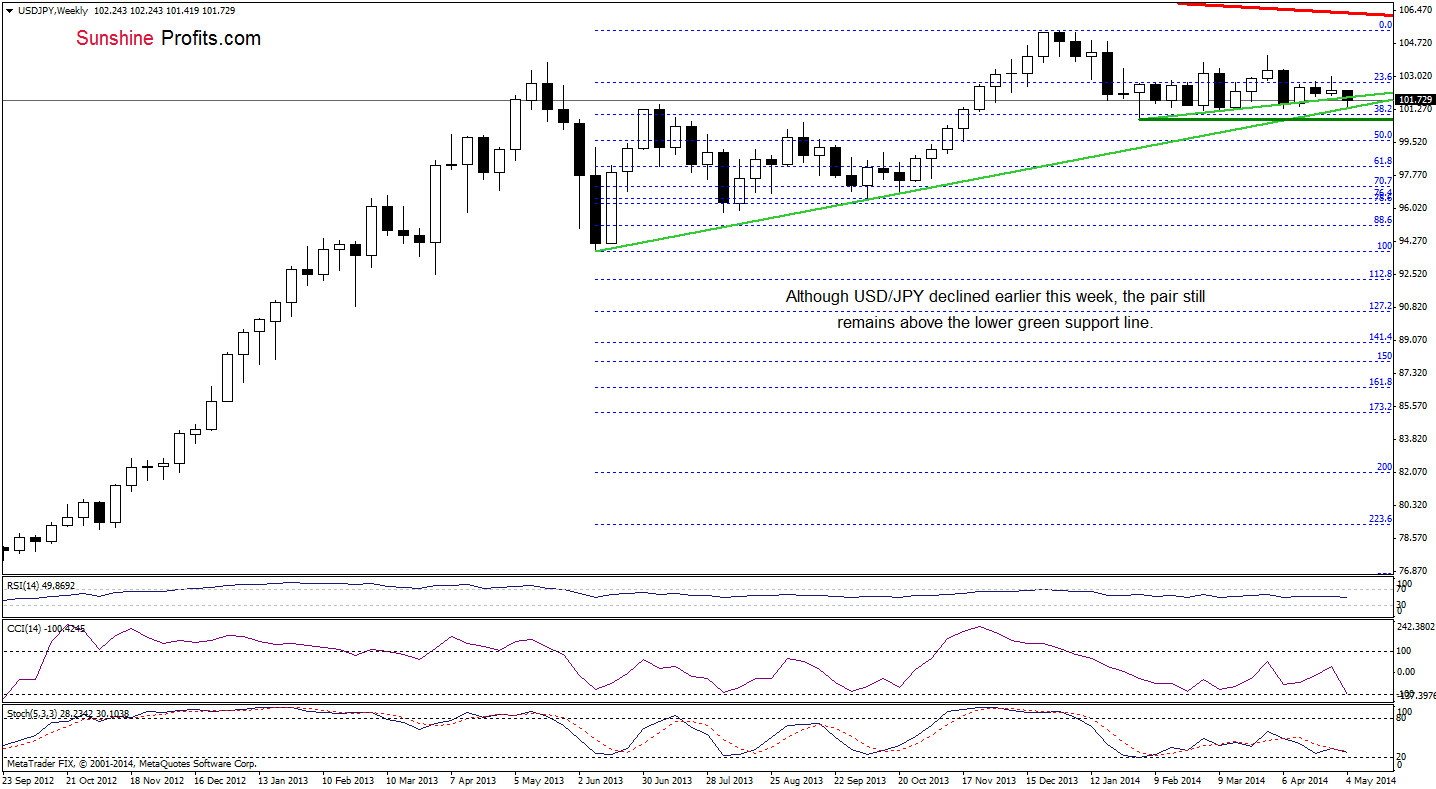
From the weekly perspective, we see that USD/JPY extended losses this week, which resulted in a decline that took the pair below the upper green line. Although this support didn’t withstand, the lower line manage to stop the selling pressure. As a result, the exchange rate rebounded slightly, but it still remains in a narrow range between these two lines. What’s next? On one hand, if the pair invalidates the breakdown below the medium-term line, we will likely see a corrective upswing to around 103, where the April high is. On the other hand, even if we don’t see such improvement, we think that the space for further declines is limited by the March or April low (around 101.20-101.31).
Once we know the medium-term picture, let’s take a look at the daily chart.
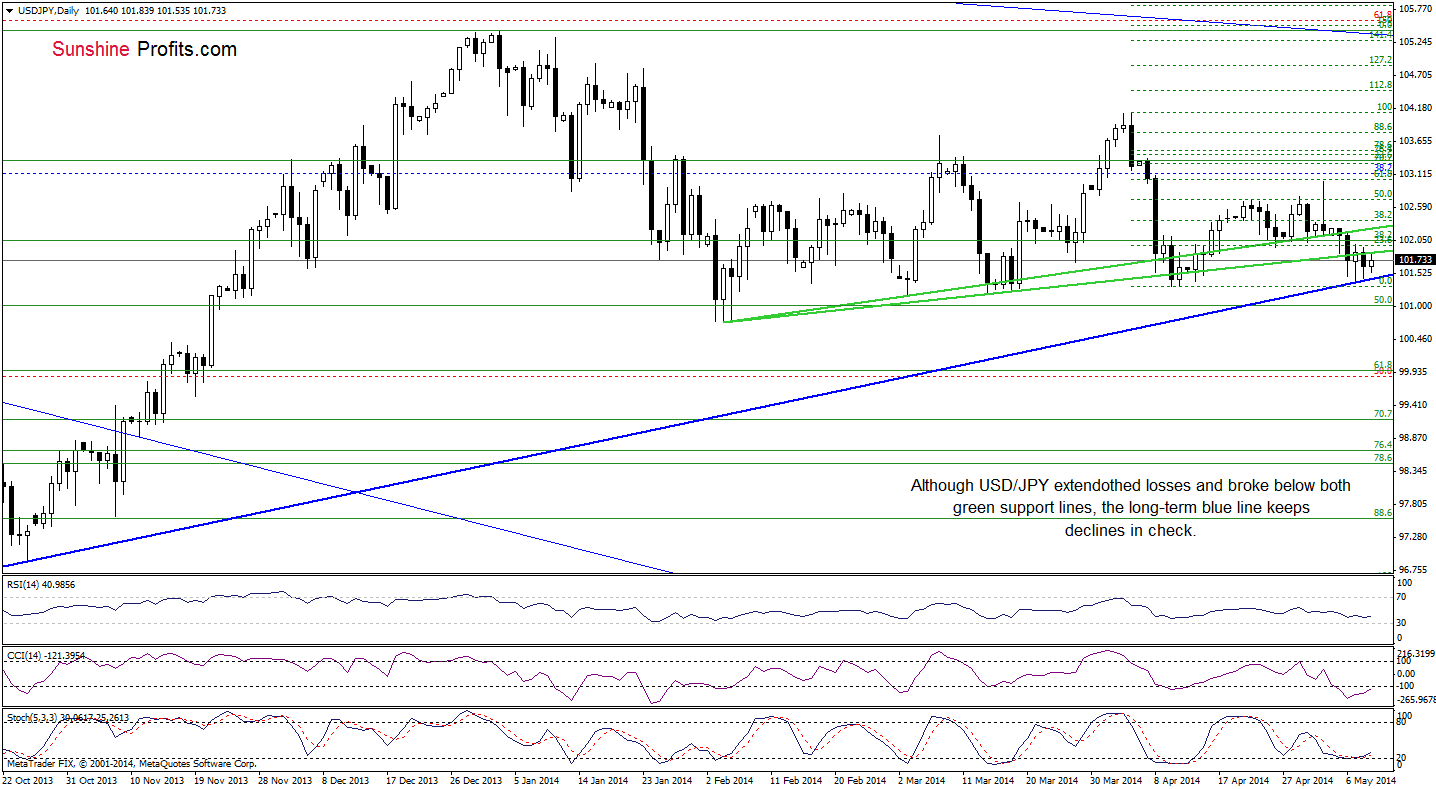
On the above chart, we see that USD/JPY is trading in a narrow range between the medium-term and the long term support/resistance lines. As we mentioned earlier, discussing the medium-term picture, the pair may head both north and south. However, taking into account the proximity to the April low and the current position of the indicators, it seems to us that a corrective upswing from here is more likely to be seen. Nevertheless, before we see USD/JPY at higher levels, the pair might have a tough time breaking through the previously-broken resistance lines.
Very short-term outlook: bullish
Short-term outlook: mixed with bullish bias
MT outlook: bullish
LT outlook: bearish
Trading position (short-term): In our opinion no positions are justified from the risk/reward perspective at the moment. We will keep you informed should anything change, or should we see a confirmation/invalidation of the above.
USD/CAD
In our Forex Trading Alert posted on May 6, we wrote the following:
(…) USD/CAD declined below its initial target, which means that we will see the test of the strength of the previous month low in the very near future (…) if it is broken, it seems quite likely that USD/CAD will decline to the long-term declining support line based on the Sept.2002 and March 2009 highs (marked with red) – currently around 1.0770. Looking at the position of the indicators, we see that they support the bearish case at moment, which suggests that a fresh 2014 low is just around the corner.
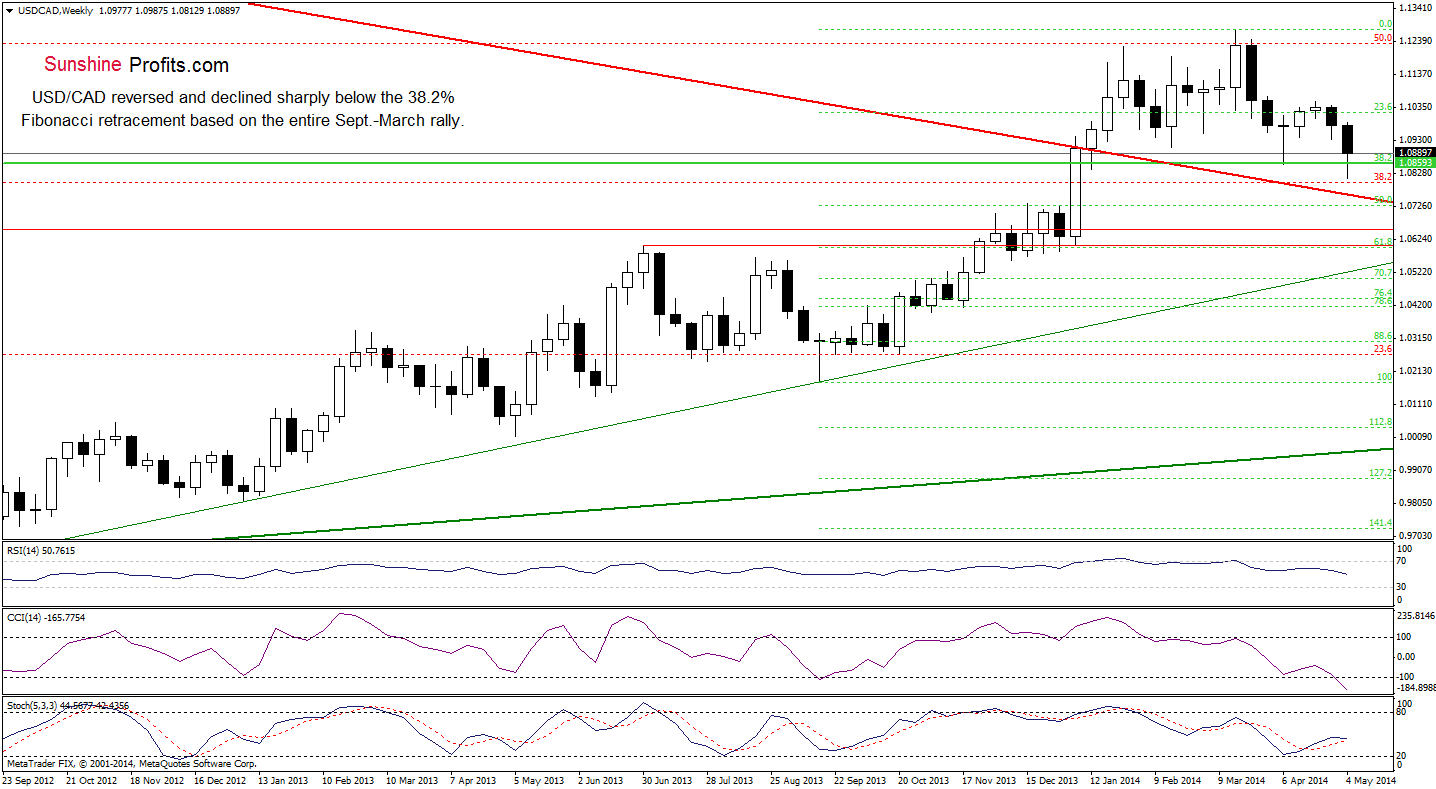
From this perspective, we see that although the exchange rate didn’t reached its downside target, the pair fell to a new 2014 low. With this downward move, USD/CAD declined (only temporarily) below the 38.2% Fibonacci retracement based on the entire Sept.-March rally and the support level based on the 2010 high. However, as you see on the weekly chart, the breakdown below these lines was invalidated, which is a bullish signal to us. Therefore, if the exchange rate closes this week above them, we may see further improvement in the following days.
How far the exchange rate could climb? Let’s look for answers to this question on the short-term chart.
Quoting our Forex Trading Alert posted on May 6:
(…) if the nearest support level doesn’t trigger a corrective upswing and the pair breaks below it, we will likely see a drop to the rising medium-term support line based on the Sept. and Oct. lows (…).
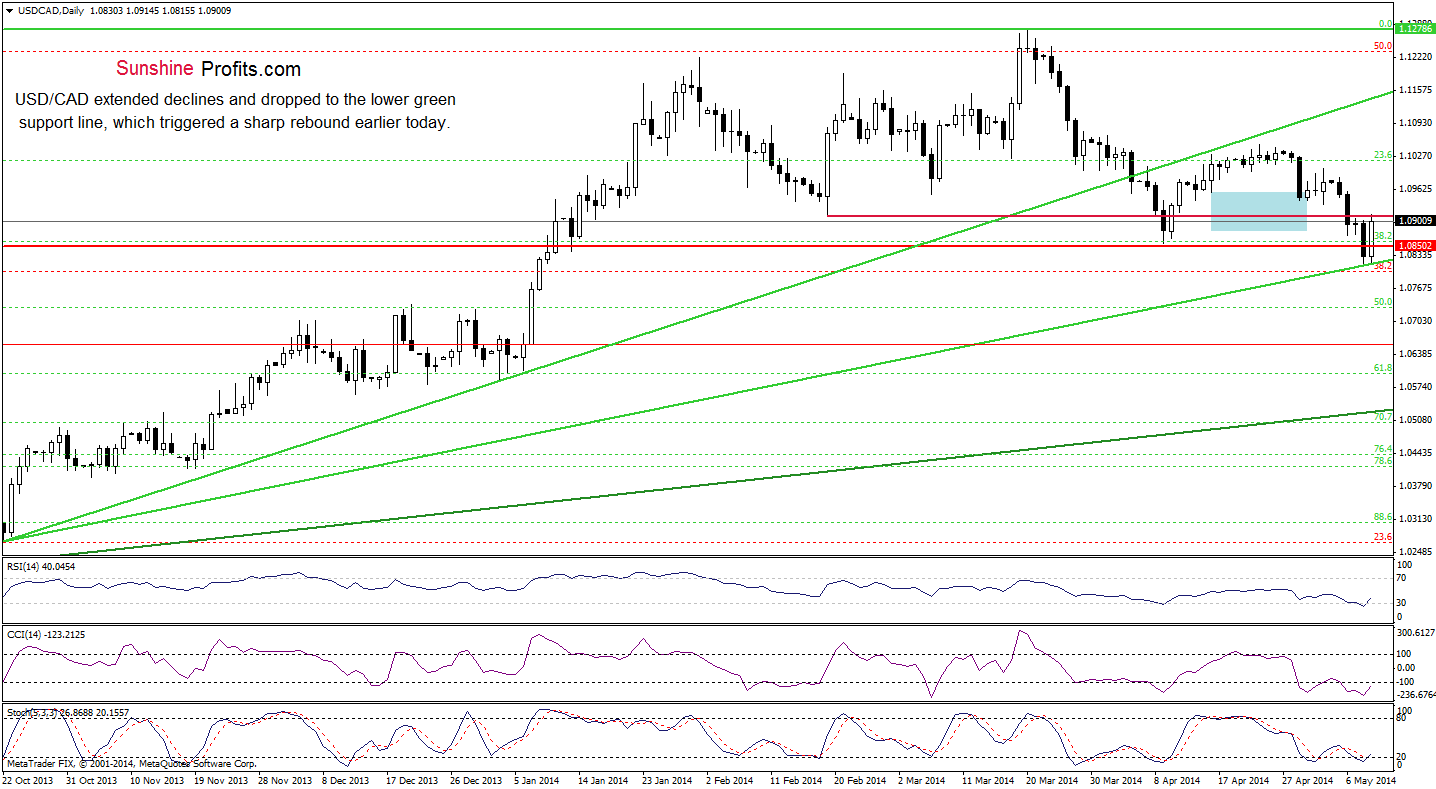
As you see on the above chart, the pair almost realized the above-mentioned scenario yesterday. Such price action reduced the selling pressure as traders who had bet on lower values locked in their profits. In reaction to this, USD/CAD bounced off the rising medium-term support line and climbed above the Apr. 9 low, invalidating the breakdown below this level. In this way, the exchange rate came back above the previously-broken 38.2% Fibonacci retracement based on the entire Sept.-March rally, which is an additional positive signal. On top of that, the RSI and Stochastic Oscillator generated buy signals, while the CCI is close to doing it. To us, all the above signifies that the correction might be over. If this is the case, we may see further improvement and an increase to at least 1.100 in the coming week.
Very short-term outlook: bullish
Short-term outlook: bullish
MT outlook: bullish
LT outlook: bearish
Trading position (short-term): In our opinion no positions are justified from the risk/reward perspective as the space for further declines may be limited. We will keep you informed should anything change, or should we see a confirmation/invalidation of the above.
USD/CHF
Quoting our Forex Trading Alert posted on Apr. 30:
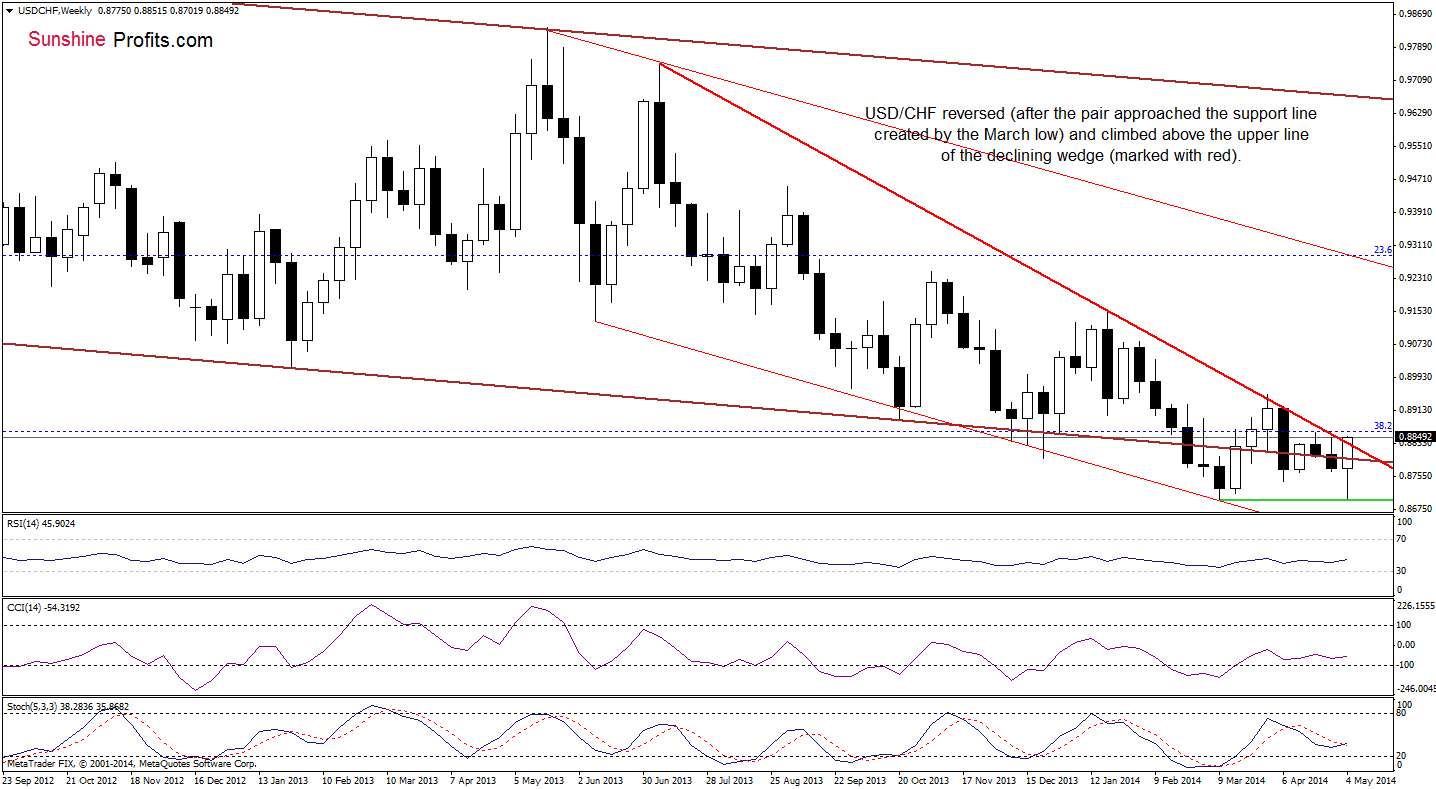
(…) a decline (…) took the pair to the lower line of the declining trend channel once again. If this support holds, we may see a corrective upswing to the weekly high and an attempt to break above the upper border of the declining wedge. However, if the lower line of the brown trend channel is broken, USD/CHF will likely test the weekly low of 0.8769.
Looking at the above chart, we see that the exchange rate closed the previous week below the long-term support, which triggered further deterioration in the recent days. We witnessed not only a drop below the level of 0.8769, but also a test of the strength of the 2014 low. As it turned out, earlier this week, the support level withstood the selling pressure, which resulted in a sharp corrective upswing that took USD/CHF above the upper border of the declining wedge. Although the breakout above this resistance line is not confirmed at the moment, we think that this is a strong bullish signal and further improvement is likely to be seen. In our opinion, if the breakout is not invalidated, the exchange rate may extend rally to around the April high of 0.8922.
Once we know the above, let’s check the daily chart to find out is there anything on the horizon that could stop further improvement in the short term.
In our Forex Trading Alertposted on Apr. 30, we wrote the following:
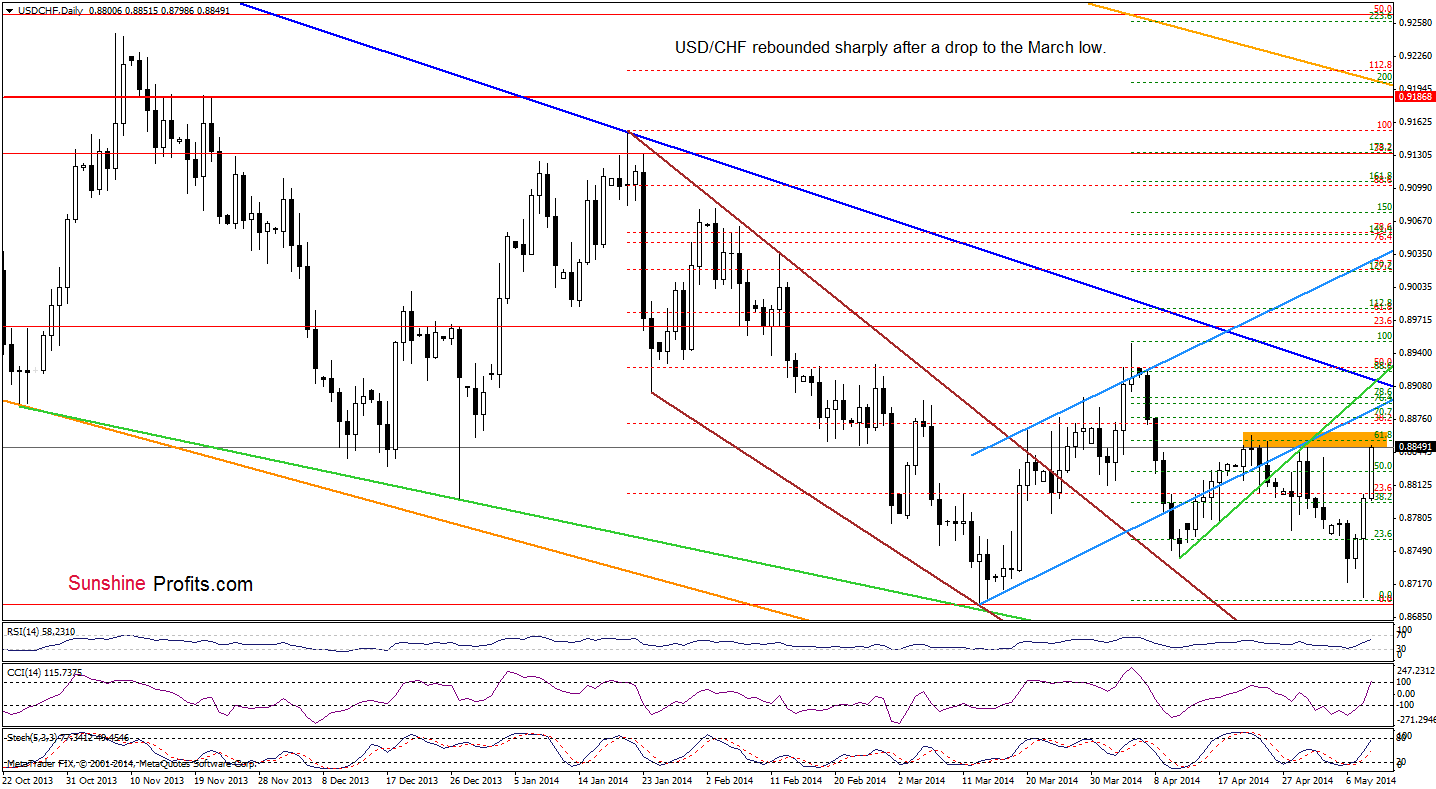
(…) it seems to us that the recent increase was nothing more than a verification of the breakdown below the very short-term green line and the lower border of the rising trend channel. If this is the case, another attempt to move lower should not surprise us – especially if the pair declines below the lower line of the declining trend channel (marked on the weekly chart).
From this perspective, we see that the above-mentioned verification of the breakdown below two key resistance lines triggered a sharp decline, which took the exchange rate to slightly above the 2014 low. As we mentioned earlier, this strong support encouraged forex traders to push the buy button once again and the pair rebounded sharply in recent days. With this upswing, USD/CHF approached the resistance zone based on the recent high, which may decelerate further improvement. Nevertheless, taking into account the breakout above the medium-term resistance (the upper line of the declining wedge) and buy signals generated by the indicators, it seems doubtful that the pair will not rise any further. In our opinion, the resistance, which may pause the rally is around 0.8884 where the lower border of the rising trend channel is.
Very short-term outlook: bullish
Short-term outlook: bullish
MT outlook: mixed with bullish bias
LT outlook: bearish
Trading position (short-term): In our opinion no positions are justified from the risk/reward perspective. We will keep you informed should anything change, or should we see a confirmation/invalidation of the above.
AUD/USD
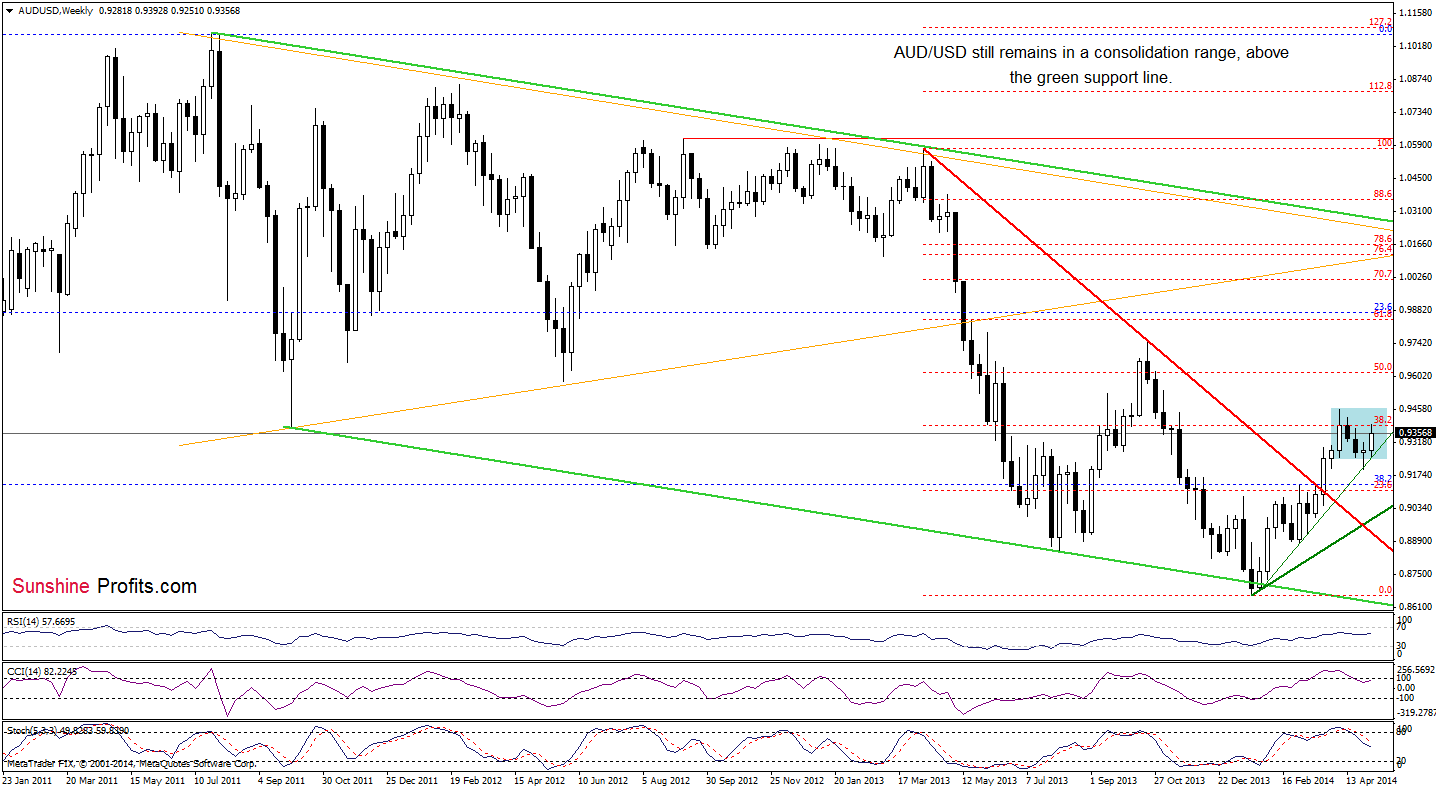
The overall situation in the medium term hasn’t changed much as the exchange rate still remains in the consolidation range. Therefore, what we wrote yesterday is up-to-date:
(…) Although AUD/USD extended gains, from this perspective, we see that the pair reached the previously-broken 38.2% Fibonacci retracement (based on the entire Apr.-Jan. declines), which serves as resistance. If it holds, we will likely see a pullback and the downside target will be the green support line (which corresponds to the lower corder of the consolidation at the moment). On the other hand, if we see a breakout above the nearest resistance level, AUD/USD will likely climb to the April high. In our opinion, the first scenario is more likele as sell signals generated by the CCI and Stochastic Oscillator remain in place.
Once we know the above, let’s focus on changes in the short term.
Yesterday, we wrote the following:
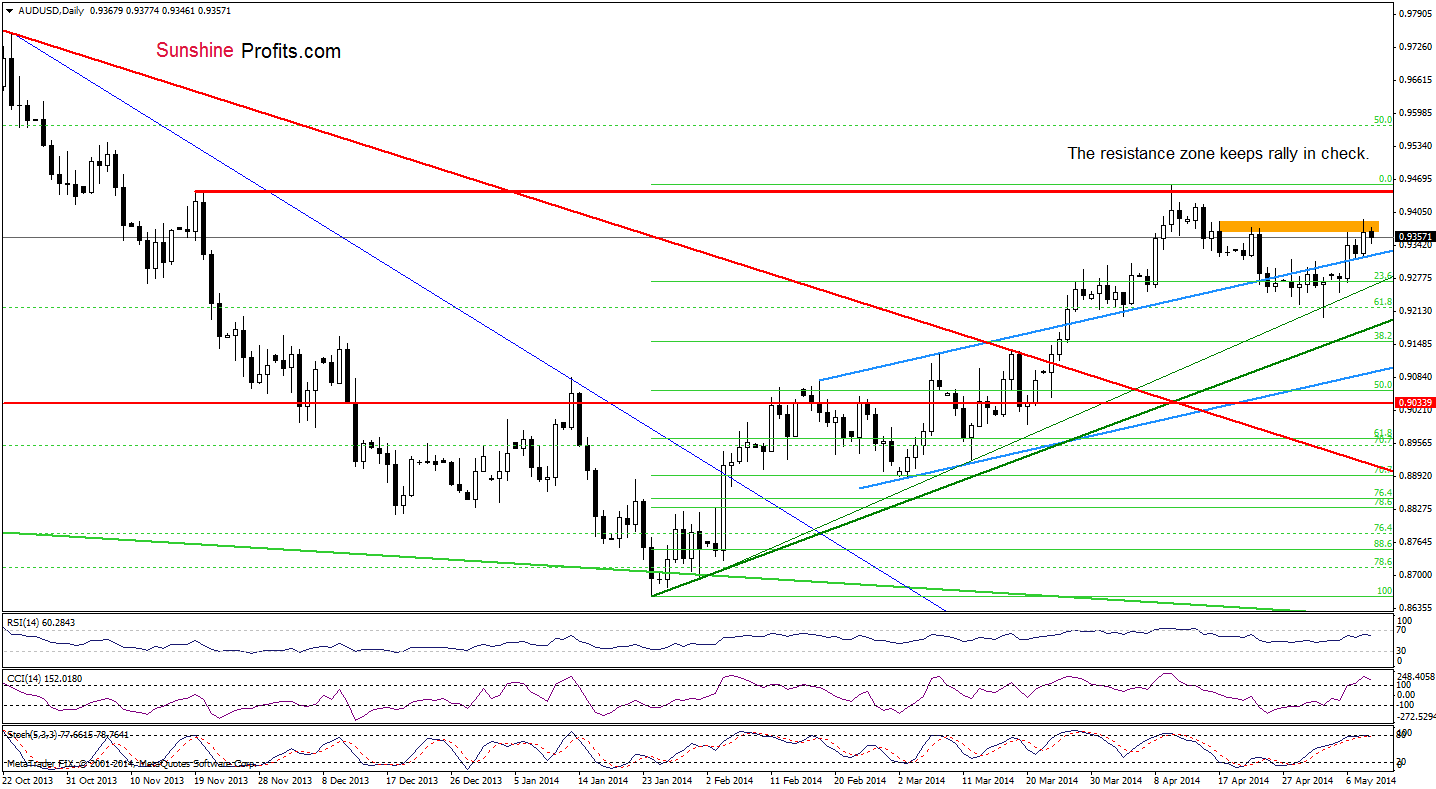
(…) the resistance zone still holds (and is reinforced by the 38.2% Fibonacci retracement based on the entire Apr.-Jan. declines). Taking fact into account and combining it with the current position of the indicators (the CCI and Stochastic Oscillator are overbought), we think that another drop to the blue support line is likely to be seen.
Although AUD/USD didn’t drop to its downside target yet, the resistance area keeps rally in check. This provide us with bearish implication and suggests that realization of the above-mentioned scenario is more likely than not. In our opinion, the current declines will accelerate, if the indicators generate sell signals. Please note that the CCI and Stochastic Oscillator are at their highest levels since the April peak. Back then, such high readings preceded a bigger correction. Therefore, if history repeats itself, we will likely see a drop not only below the blue and green support lines, but also a test of the strength of the medium-term green support line based on the Jan. lows (currently around 0.9180). Taking all the above into account, we remain bearish.
Very short-term outlook: bearish
Short-term outlook: bearish
MT outlook: bearish
LT outlook: bearish
Trading position (short-term): Short. Stop-loss order: 0.9410 and initial price target: the lower border of the blue rising trend channel (currently at 0.9060). We will keep you informed should anything change, or should we see a confirmation/invalidation of the above.
Thank you.
Nadia Simmons
Forex & Oil Trading Strategist
Przemyslaw Radomski, CFA
Founder, Editor-in-chief
Gold & Silver Trading Alerts
Forex Trading Alerts
Oil Investment Updates
Oil Trading Alerts

