
Earlier today, U.S. dollar increased against major currencies after the Commerce Department showed that U.S. orders for long lasting manufactured goods rose 2.6% in March, beating expectations for a 2% gain. Additionally, core durable goods orders (without volatile transportation items) increased 2% in the previous month, well above forecasts for a 0.6% gain. Because of these better-than-expected numbers, AUD/USD broke below important support lines. Does this drop change the outlook for the exchange rate?
In our opinion the following forex trading positions are justified - summary:
- EUR/USD: none
- GBP/USD: short (stop-loss order: 1.6855)
- USD/JPY: none
- USD/CAD: none
- USD/CHF: none
- AUD/USD: short (stop-loss order: 0.9410; initial price target: 0.9060)
EUR/USD
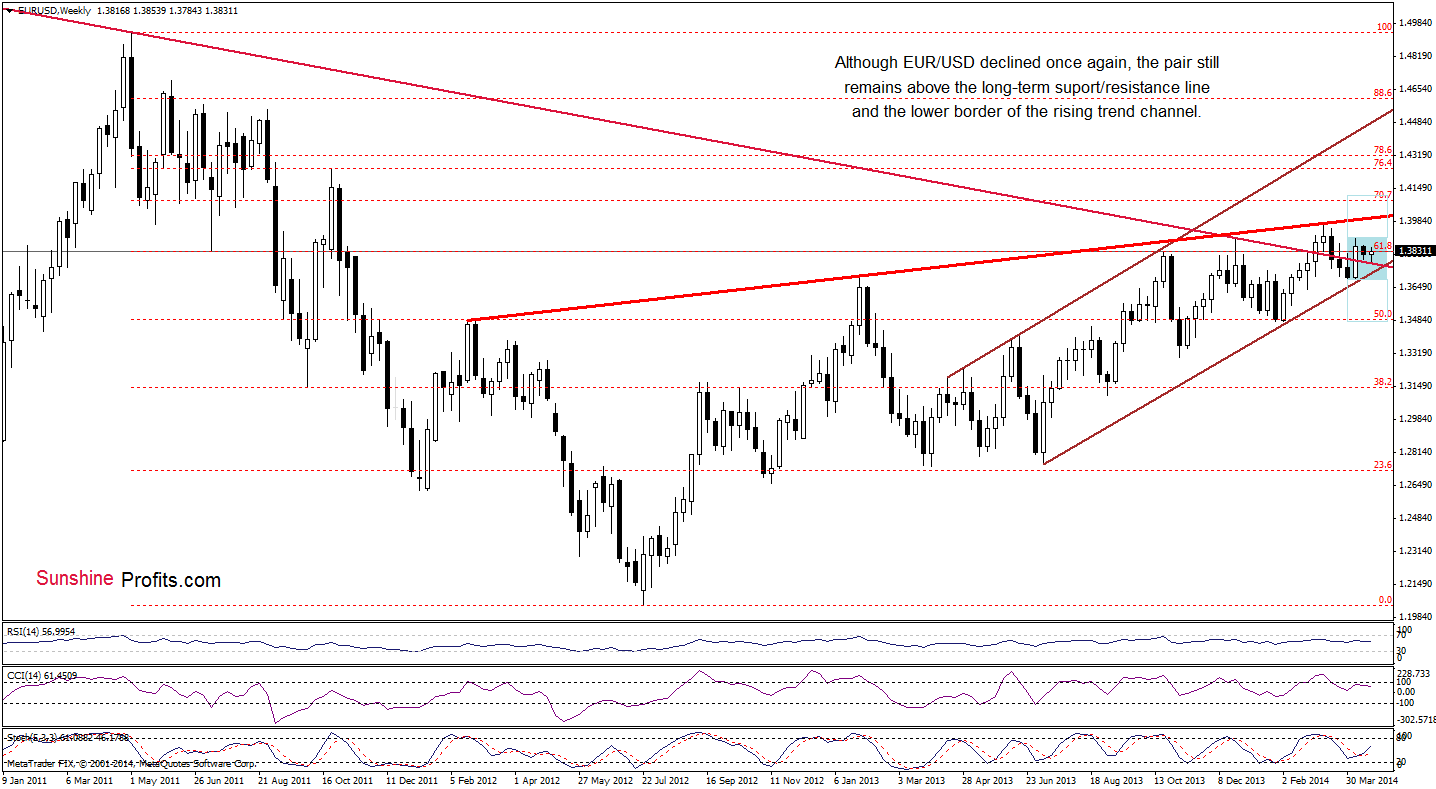
From the weekly perspective, we see that the situation hasn’t changed much. So, what we wrote yesterday is still up-to-date.
(…) EUR/USD remains in a consolidation (marked with light blue). If the proximity to the previously-broken long-term declining line encourages buyers to act, we will likely see an increase to the upper border of the consolidation (at 1.3905). However, if this important support line is broken, we may see a drop to the lower border of the rising trend channel (currently around 1.3728).
Once we know the above, let’s take a look at the daily chart.
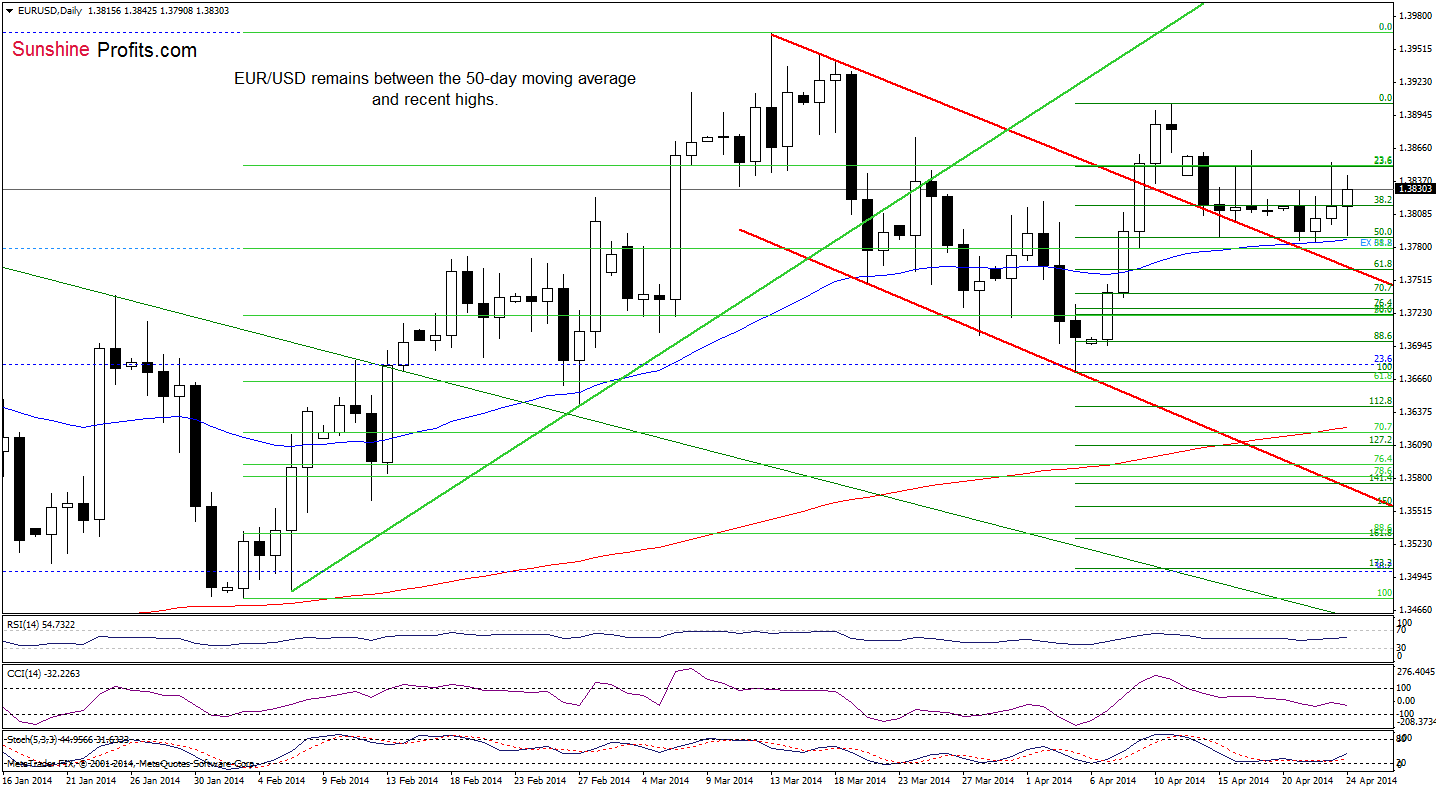
As you see on the above chart, although the sellers push EUR/USD lower earlier today, the 50-day moving average successfully stopped further deterioration. From this perspective, it seems that as long as this support is in play, the space for declines is limited and another attempt to move higher should not surprise us. If this is the case, and the pair moves above the April 17 high, we will likely see an increase to the April high (1.3905). Nevertheless, if the resistance level holds, we may see another test of the strength of the 50-day moving average (currently at 1.3787).
Very short-term outlook: mixed
Short-term outlook: mixed
MT outlook: bearish
LT outlook: bearish
Trading position: In our opinion no positions are justified from the risk/reward perspective. We will keep you informed should anything change, or should we see a confirmation/invalidation of the above.
GBP/USD
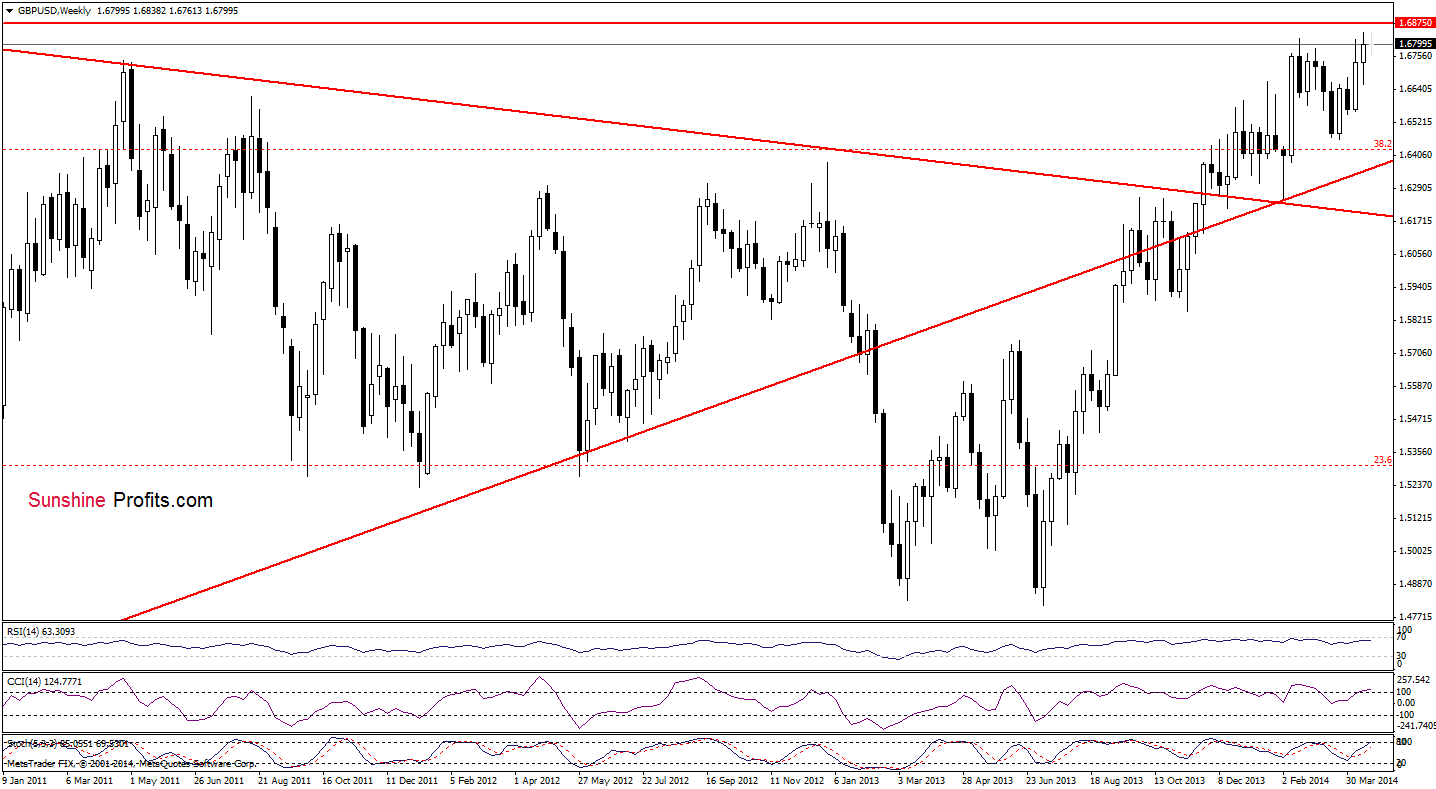
From the weekly perspective, the situation hasn’t changed much as GBP/USD still remains under the 2014 high and the strong resistance zone created by Aug. and Nov. 2009 highs, which may pause or even stop further improvement. Taking these facts into account, another attempt to move lower should not surprise us.
To have more complete picture of the current situation in GBP/USD, let’s take a look at the daily chart.
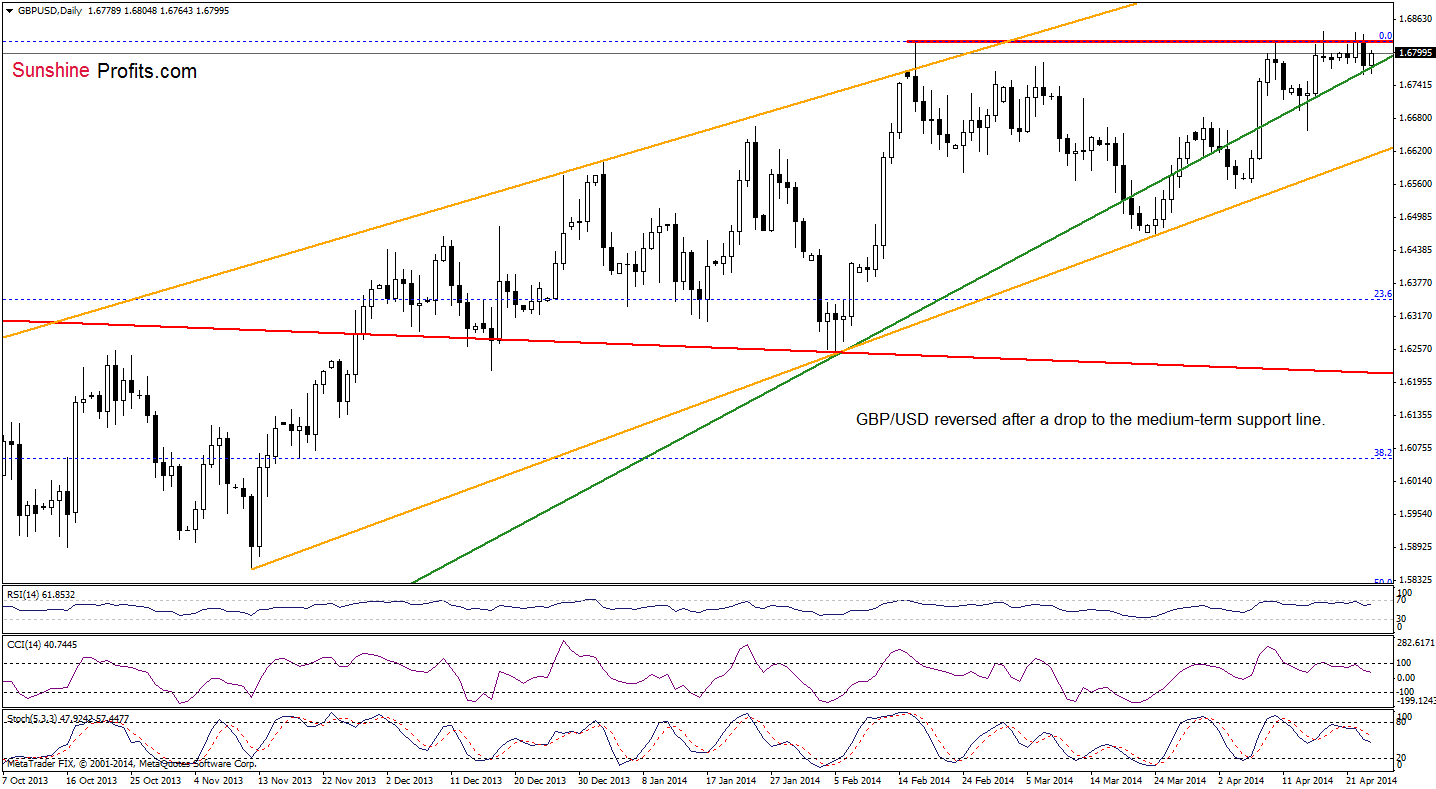
As you see on the above chart, the exchange rate rebounded after another drop to the green medium-term line earlier today. Despite today’s improvement, GBP/USD still remains below the resistance level (created by the annual high) and sell signals generated by all indictors remain in place. Connecting the dots, it seems that the sellers do not give up and we’ll likely see another attempt to break below the major support line in the near future. At this point, we would like to recall yesterday’s Forex Trading Alert:
(…) if it is broken, we will likely see a bigger decline and the initial downside target will be around 1.6659, where the Apr.15 low is. The probability for the decline is not huge, but if it happens, then the following decline is likely to be significant. That's why we think the short positions are still justified.
Very short-term outlook: bearish
Short-term outlook: bearish
MT outlook: bearish
LT outlook: mixed
Trading position (short-term; our opinion): Short. Stop-loss order: 1.6855. Please note that if the pair moves above our stop-loss level, it seems that it will rally some more before heading south once again. If this is the case, we’ll consider re-opening short positions around the 2009 high. We will keep you informed should anything change, or should we see a confirmation/invalidation of the above.
USD/JPY
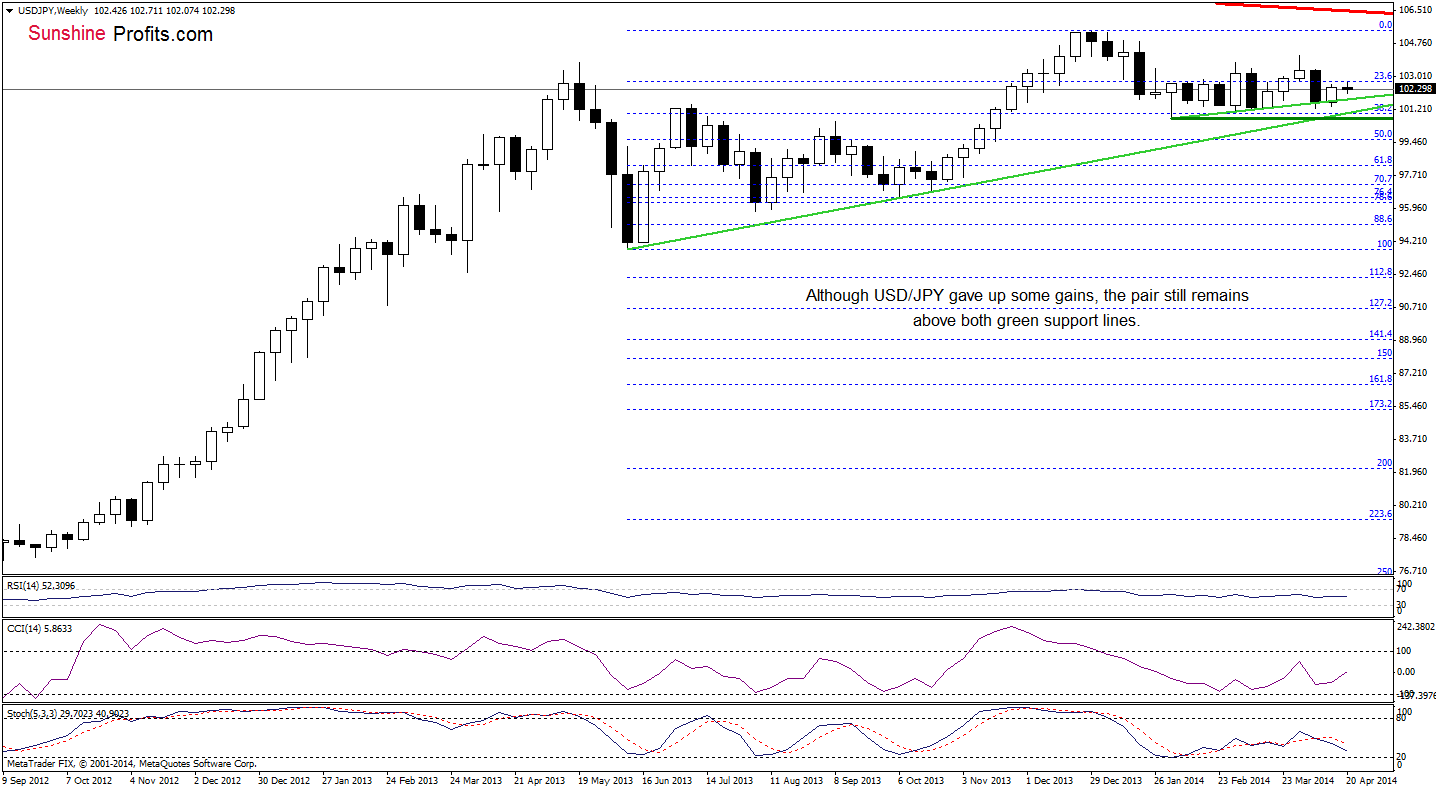
From the weekly perspective, we see that although USD/JPY gave up some gains, the overall situation hasn’t changed much as the exchange rate remains above both green support lines.
Is the short-term outlook also bullish? Let’s take a look at the daily chart.
In our Forex Trading Alert posted on Tuesday, we wrote the following:
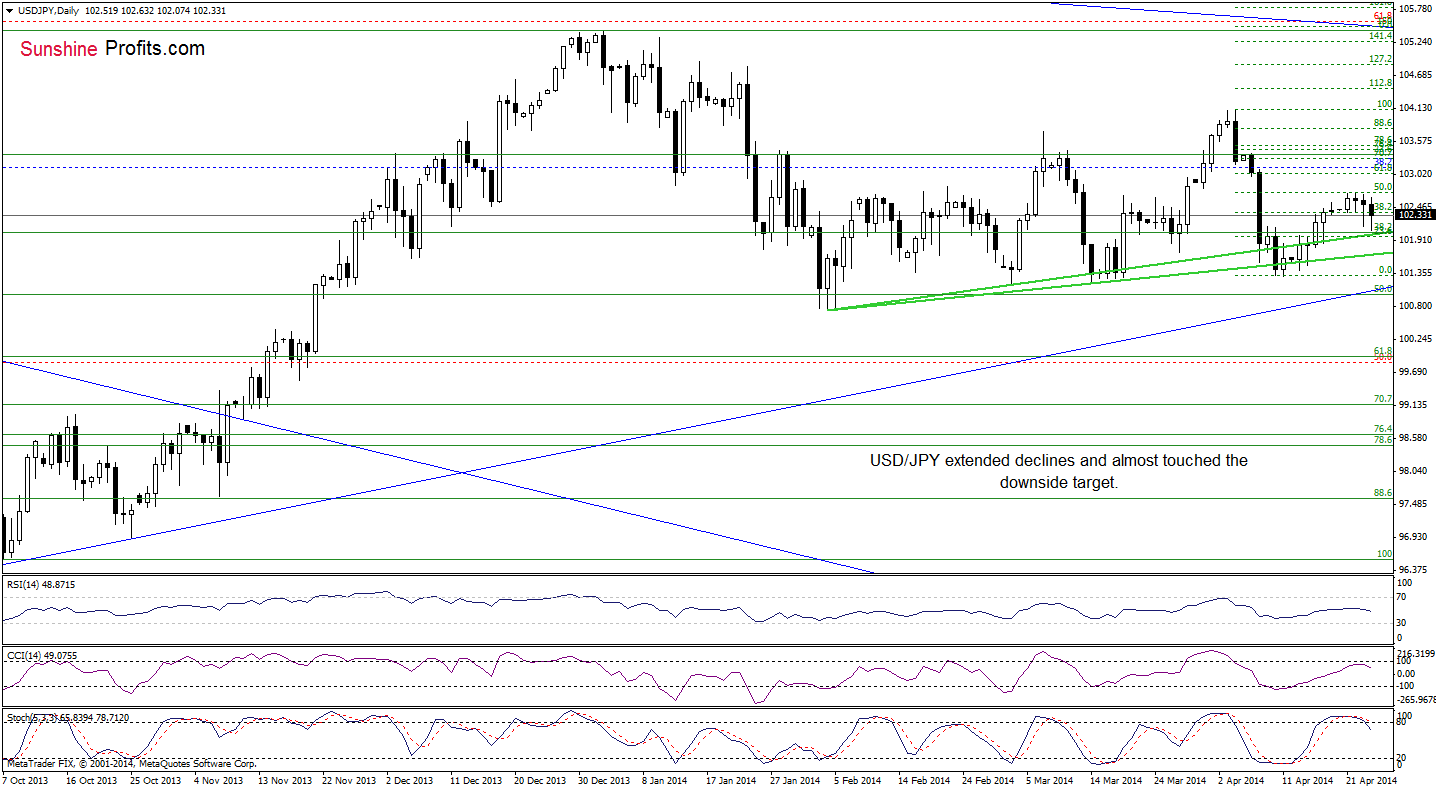
(…) the initial upside target will be around 102.70, where the 50% Fibonacci retracement based on the recent decline is.(…) If this resistance level holds, we may see a pullback to the upper green support line (currently around 101.96).
Yesterday, we added:
(…) USD/JPY declined below yesterday’s low (…), taking into account the current position of the indicators (the CCI and Stochastic Oscillator generated sell signals), it seems that the sellers will realize this bearish scenario in the coming day (or days).
Looking at the above chart, we see that although the exchange rate rebounded yesterday, this improvement was only temporarily. Earlier today, the pair extended losses and the sellers approached their downside target once again. On one hand, if this support line encourages buyers to act, we may see a corrective upswing to the recent highs. However, if it is broken, we will likely see a drop to the lower green line (currently around 101.68).
Very short-term outlook: bearish
Short-term outlook: mixed with bearish bias
MT outlook: bullish
LT outlook: bearish
Trading position (short-term): In our opinion no positions are justified from the risk/reward perspective at the moment. We will keep you informed should anything change, or should we see a confirmation/invalidation of the above.
USD/CAD
Looking at USD/CAD from the weekly perspective, we see that the situation hasn’t changed. So, what we wrote in our previous Forex Trading Alert is still valid.
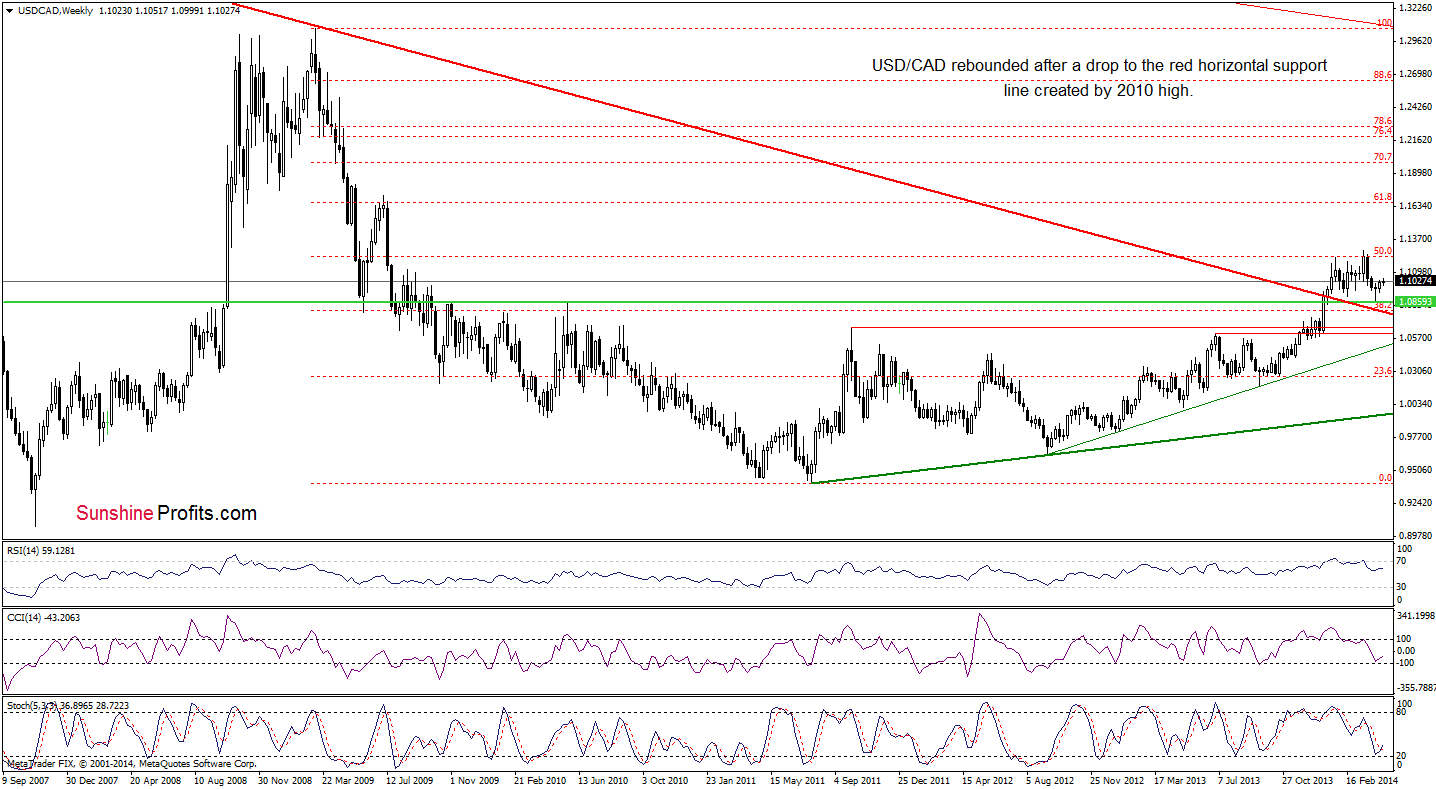
(…) although the exchange rate declined in the previous weeks, it still remains above the previously-broken long term declining support/resistance line (marked with red). With this downward move, the pair declined to the horizontal green support line (created by the 2010 high) and rebounded. Nevertheless, the size of the corrective upswing is still quite small, which suggests that another attempt to move lower can’t be ruled out.
Before we summarize this currency pair, let’s move on to the daily chart.
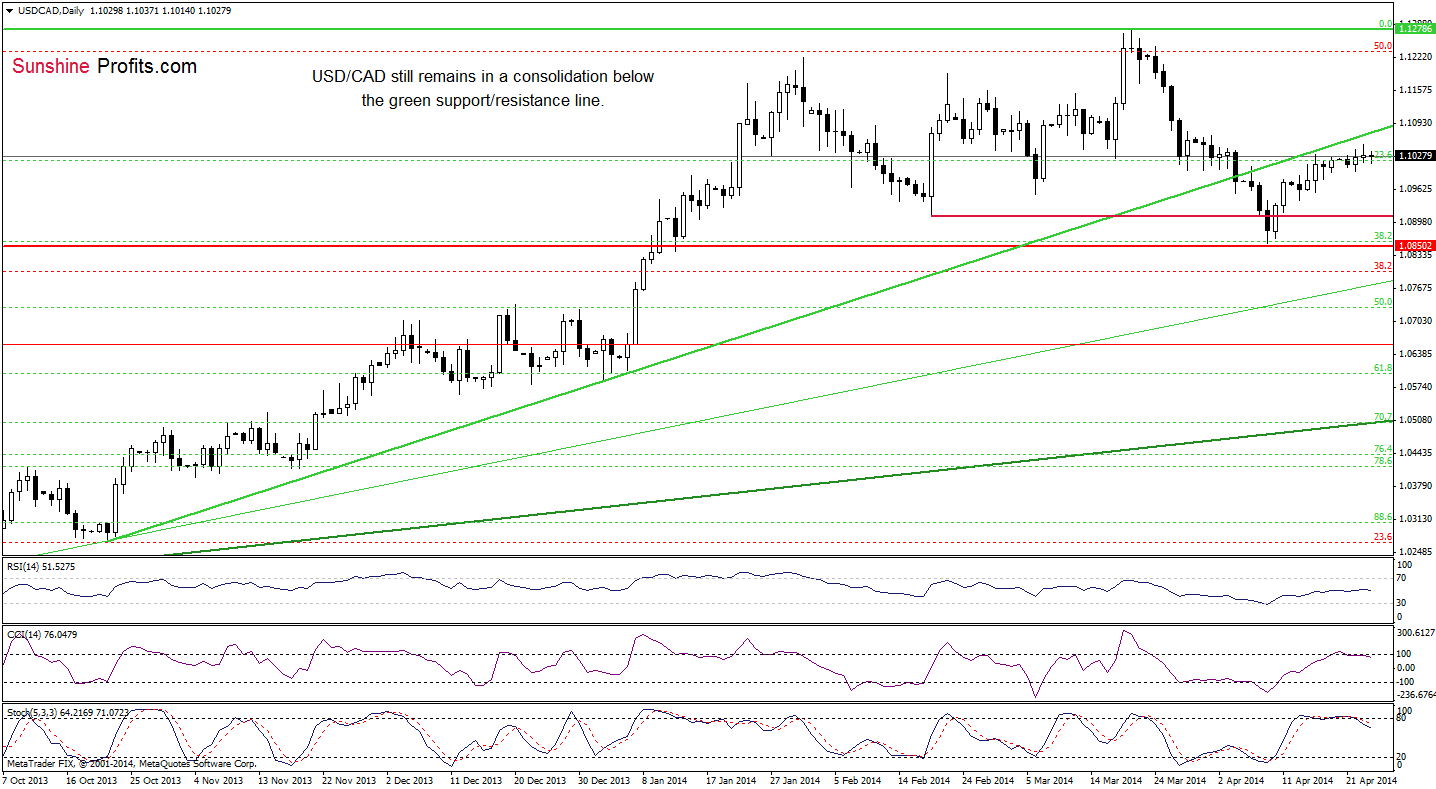
On the above chart, we see that the situation hasn’t changed much as USD/CAD still remains in a consolidation between the Apr.16 high and low. On one hand, if USD/CAD moves higher once again, we may see another attempt to break above the green resistance line. However, taking into account the current position of the indicators (the CCI and Stochastic Oscillator generated sell signals yesterday), it seems that a correction in the coming days should not surprise us. If this is the case, we will likely see a pullback to around 1.0982 (the April 17 low) or even to 1.0958, where the lower border of the consolidation is.
Very short-term outlook: mixed with bearish bias
Short-term outlook: mixed with bearish bias
MT outlook: bullish
LT outlook: bearish
Trading position (short-term): In our opinion no positions are justified from the risk/reward perspective. We will keep you informed should anything change, or should we see a confirmation/invalidation of the above.
USD/CHF
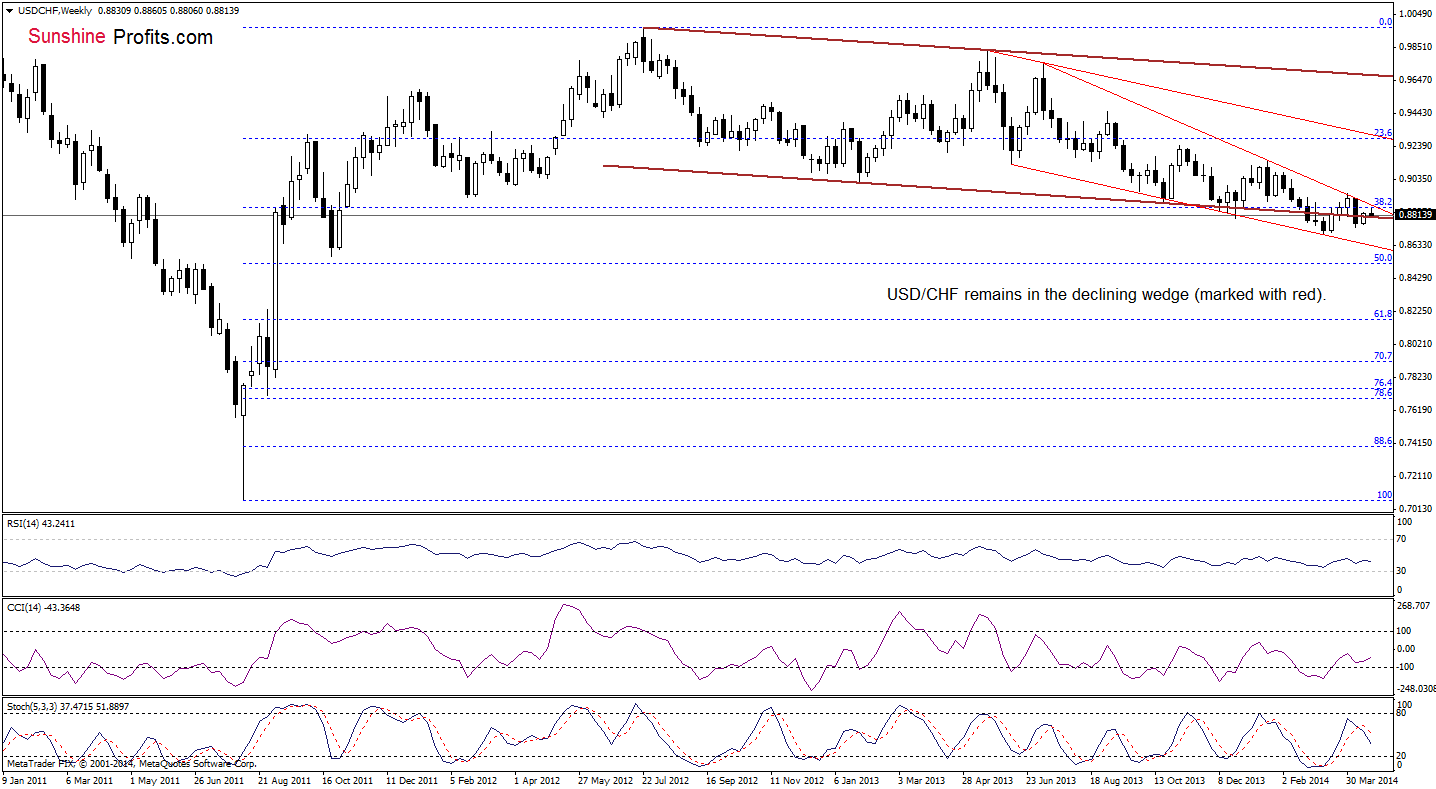
From this perspective, we see that the situation hasn’t changed much. Therefore, what we wrote yesterday is still up-to-date.
(…) If the proximity to the upper border of the declining wedge encourages sellers to act, we may see further deterioration and a drop to the lower line of the declining trend channel (marked with brown) – currently around 0.8800.
Once we know the above, let’s take a closer look at the daily chart.
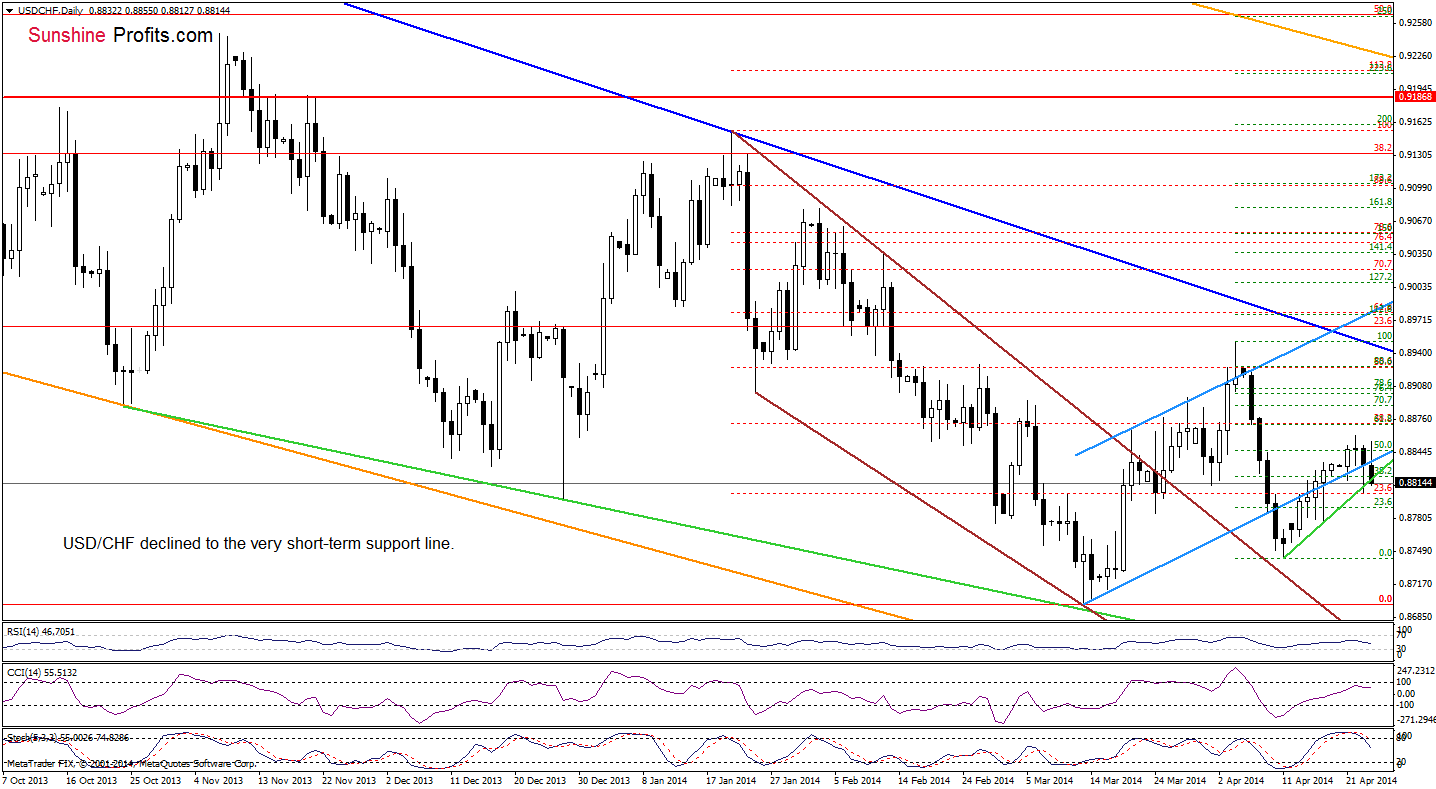
Quoting our previous Forex Trading Alert:
(…) the exchange rate dropped to the very short-term support line based on Apr.11 and Apr.17 lows. If this line holds, we may see a corrective upswing and an increase to around yesterday’s high.
On the daily chart, we see that the buyers realized this pro growth scenario earlier today. Despite this increase, USD/JPY reversed and declined to the above-mentioned support line once again. If history repeats itself, we will likely see another upswing to around 0.8855. Nevertheless, taking into account sell signals generated by the CCI and Stochastic Oscillator, it seems that the sellers will likely try to push the pair lower in the near future. In this case, we may see a decline to the Apr.17 low or even to the monthly low of 0.8742.
Very short-term outlook: mixed
Short-term outlook: mixed
MT outlook: bearish
LT outlook: bearish
Trading position (short-term): In our opinion no positions are justified from the risk/reward perspective. We will keep you informed should anything change, or should we see a confirmation/invalidation of the above.
AUD/USD
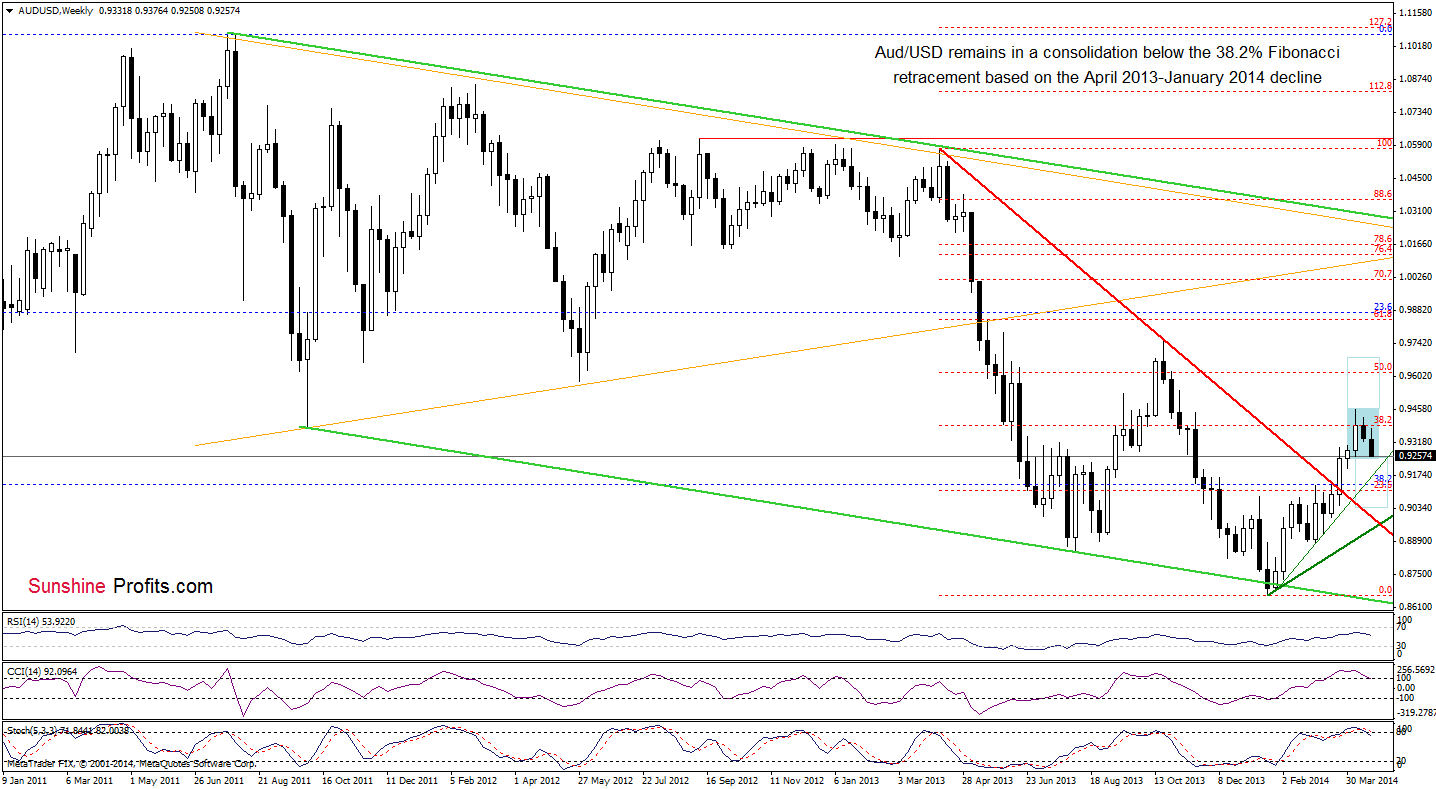
Looking at the weekly chart, we see that the situation has deteriorated as AUD/USD slipped (so far, only temporarily) below the lower border of the consolidation range. If the buyers do not manage to push the pair above this line, we may see further deterioration and a drop to around 0.9046 (at this level the size of the downswing corresponds to the height of the consolidation range). Please keep in mind that sell signals generated by the CCI and Stochastic Oscillator remain in place, supporting the bearish case.
Once we know the medium-term situation, let’s move on to the daily chart.
Quoting our previous Forex Trading Alert:
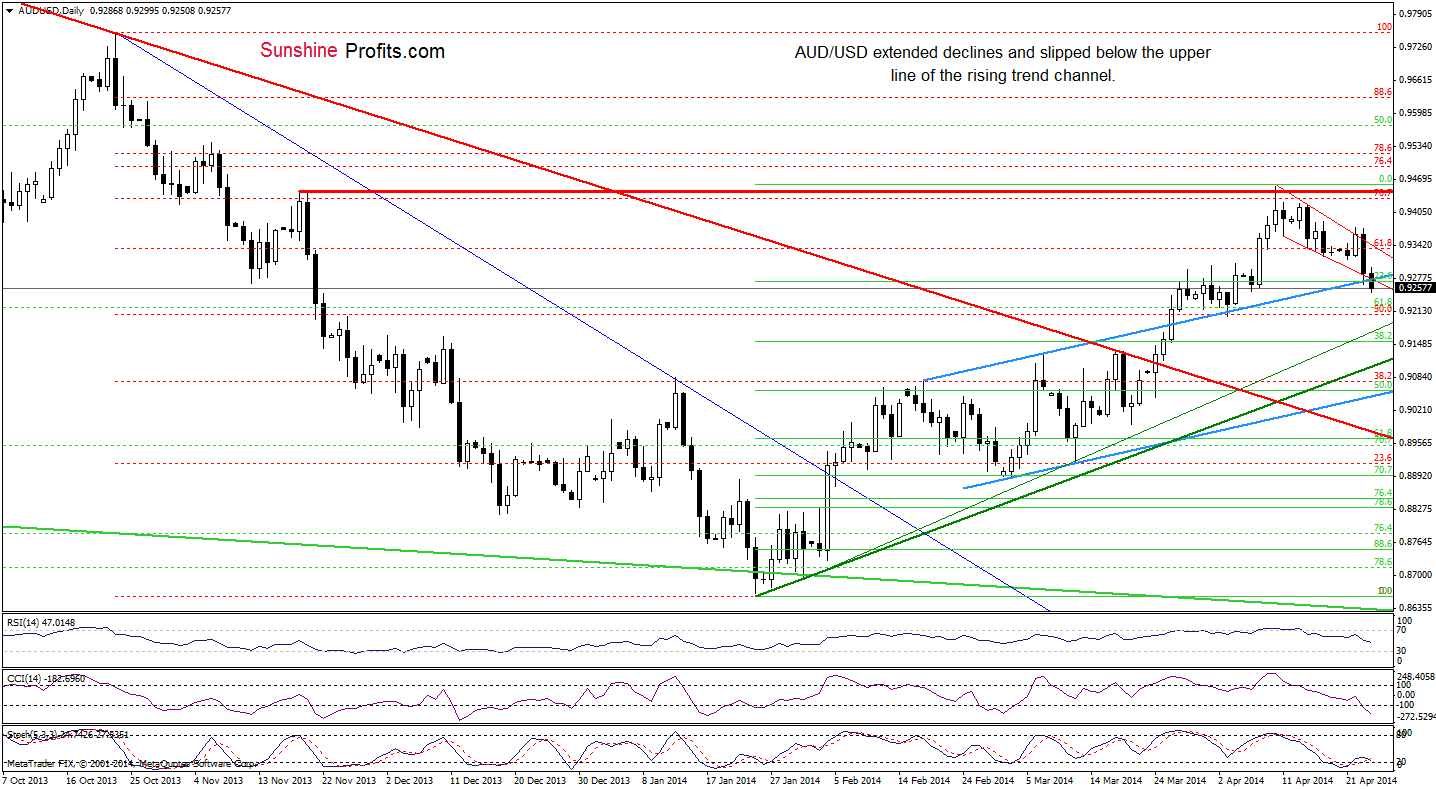
(…) the pair not only dropped below the lower border of the declining trend channel, but also reached the upper line of the blue rising trend channel. If the combination of these two support lines encourages buyers to push the exchange rate higher, we may see another attempt to break above the red declining resistance line. However, if this strong support area is broken, the initial downside target will be around 0.9204, where the Apr.3 low is.
As you see on the above chart, the exchange rate extended declines earlier today. With this downswing, AUD/USD broke below the upper line of the blue rising trend channel, which is a strong bearish signal. Taking this fact into account, the sellers will likely try to reach the initial downside target in the coming day (or days).
Very short-term outlook: bearish
Short-term outlook: bearish
MT outlook: bearish
LT outlook: bearish
Trading position (short-term): In our opinion, opening short positions at the following terms is a good idea. Stop-loss order: 0.9410 and initial price target: the lower border of the blue rising trend channel (currently at 0.9060). We will keep you informed should anything change as far as our opinion is concerned, or should we see a confirmation/invalidation of the above. The above is not an investment / trading advice and please note that trading (especially using leveraged instruments such as futures or on the forex market) involves risk.
Thank you.
Nadia Simmons
Forex & Oil Trading Strategist
Przemyslaw Radomski, CFA
Founder, Editor-in-chief
Gold & Silver Trading Alerts
Forex Trading Alerts
Oil Investment Updates
Oil Trading Alerts

