
Earlier today, the euro moved lower against the U.S. dollar after data showed that existing home sales fell by 0.2% in the previous month to 4.59 million units, beating expectations for 4.55 million units. In reaction to this, the common currency approached an important support line once again. What impact could it have on future price moves?
In our opinion the following forex trading positions are justified - summary:
- EUR/USD: none
- GBP/USD: short (stop-loss order: 1.6855)
- USD/JPY: none
- USD/CAD: none
- USD/CHF: none
- AUD/USD: none
EUR/USD
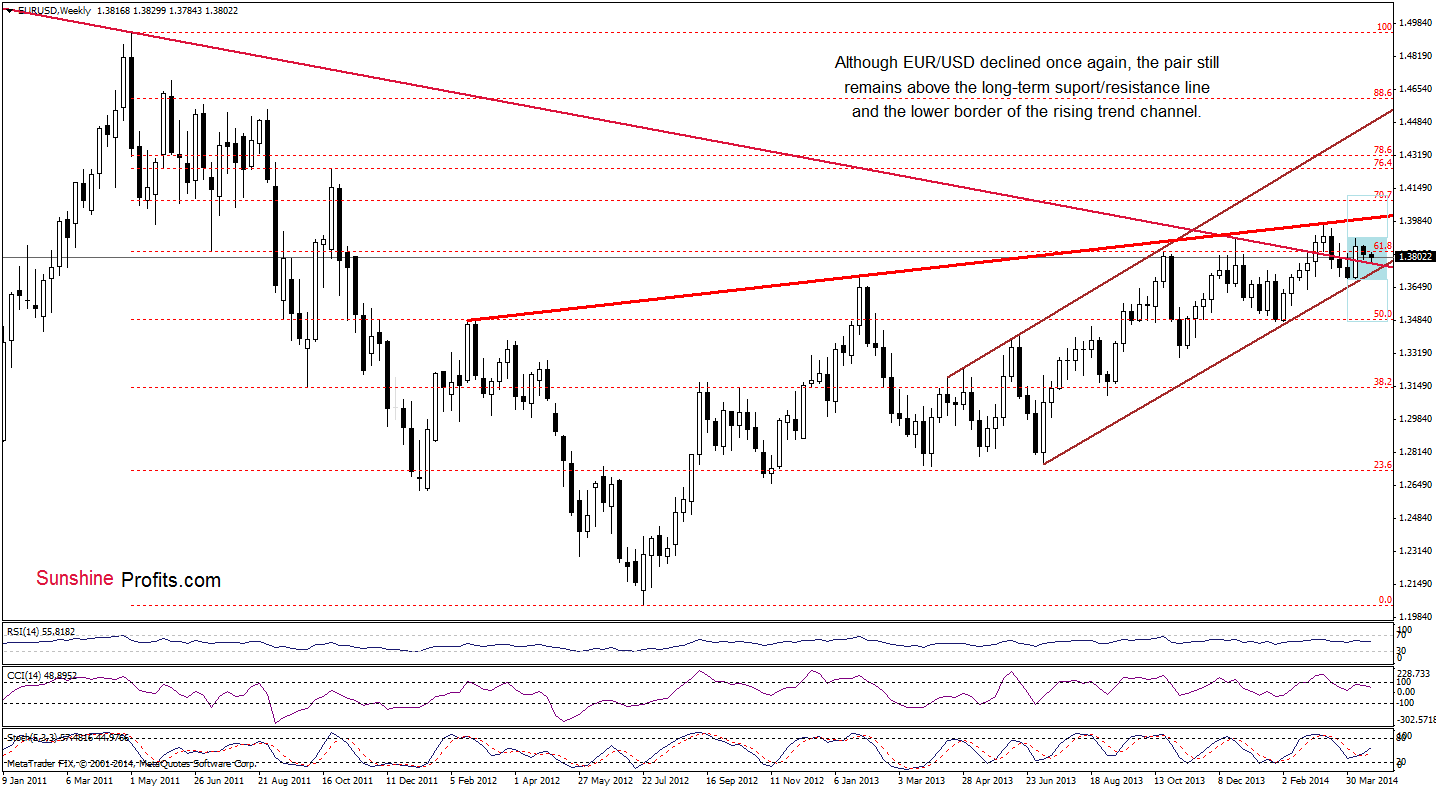
From the weekly perspective, we see that despite recent declines the situation hasn’t changed much as EUR/USD remains in a consolidation (marked with light blue). If the proximity to the previously-broken long-term declining line encourages buyers to act, we will likely see an increase to the upper border of the consolidation (at 1.3905). However, if this important support line is broken, we may see a drop to the lower border of the rising trend channel (currently around 1.3728).
Once we know the above, let’s take a look at the daily chart.
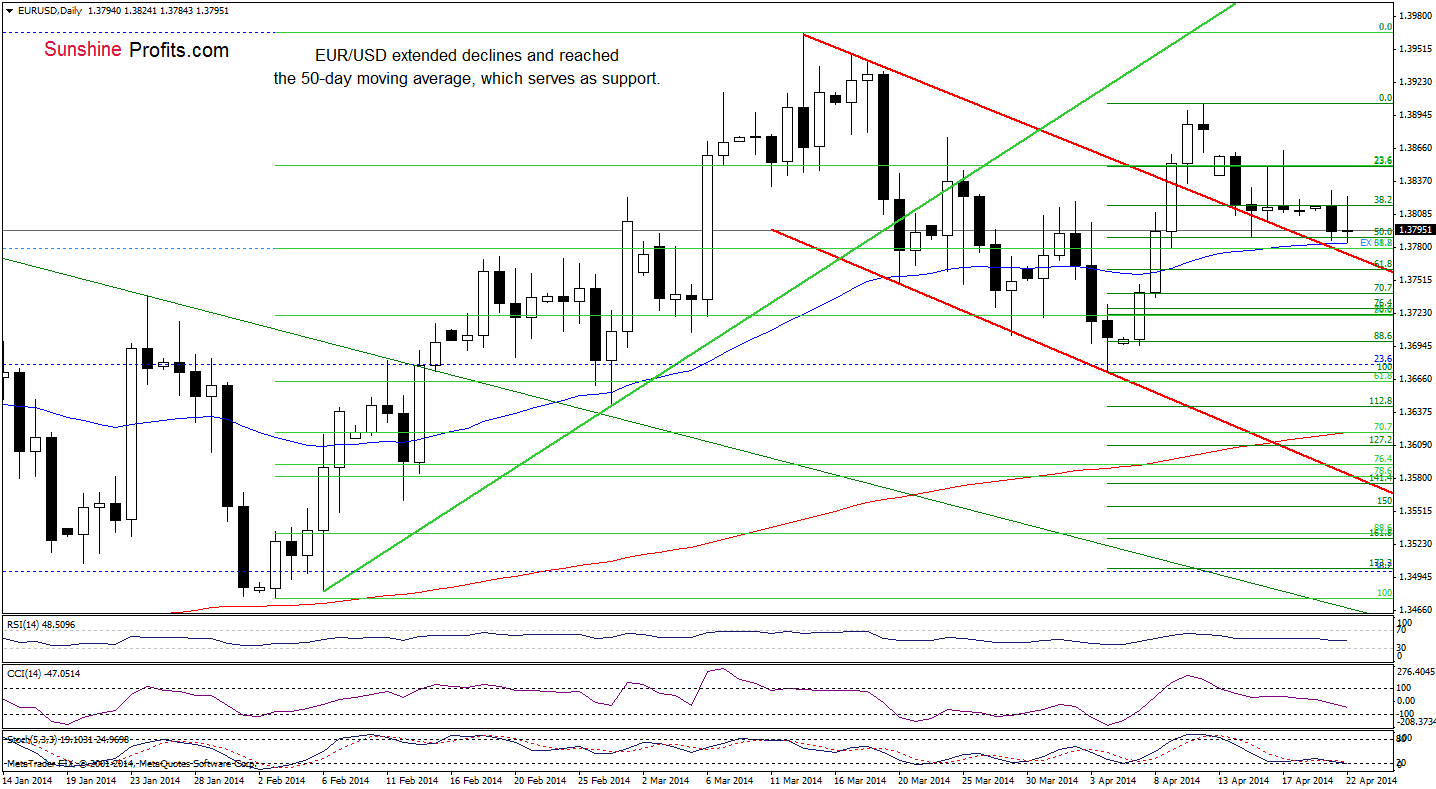
Looking at the above chart, we see that EUR/USD extended losses in the previous days and reached the 50-day moving average, which serves as support at the moment. If this line encourages buyers to act, we may see an increase to yesterday’s high of 1.3830 or even to the April 17 high (1.3864). However, if it is broken, we will likely see another attempt to break below the upper line of the declining trend channel (currently around 1.3778).
Very short-term outlook: mixed
Short-term outlook: mixed
MT outlook: bearish
LT outlook: bearish
Trading position: In our opinion no positions are justified from the risk/reward perspective. We will keep you informed should anything change, or should we see a confirmation/invalidation of the above.
GBP/USD
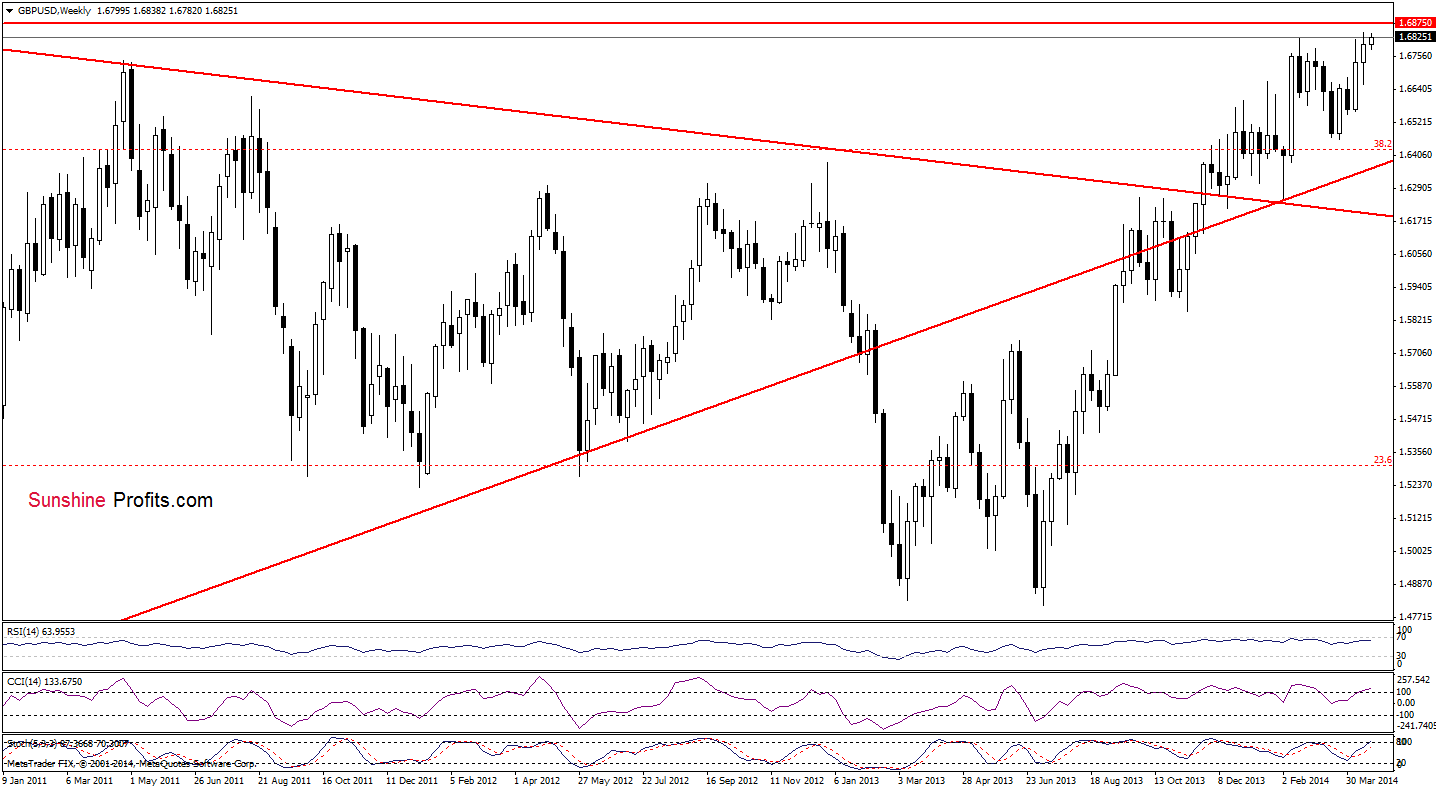
From the weekly perspective, we see that GBP/USD moved higher once again and approached the 2014 high. Despite this improvement, the exchange rate still remains below the strong resistance zone created by Aug. and Nov. 2009 highs, which may pause or even stop further improvement. Taking this fact into account, another attempt to move lower should not surprise us.
To have more complete picture of the current situation in GBP/USD, let’s take a look at the daily chart.
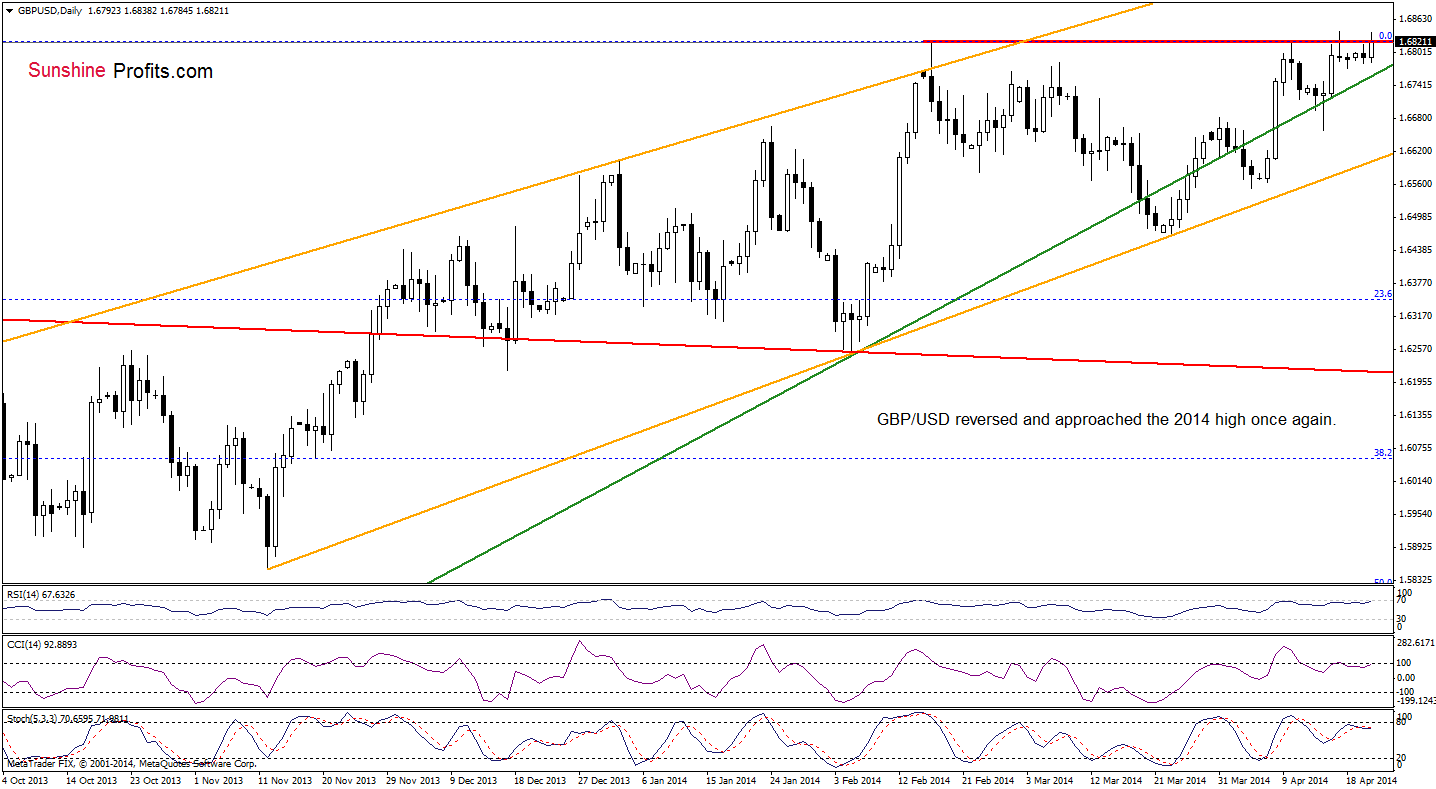
As you see on the above chart, GBP/USD reversed once again and almost touched the 2014 high earlier today. On one hand, if this resistance level encourages sellers to act, we will likely see another try to break below the green medium-term line (currently around 1.6755), which serves as major support at the moment. On the other hand, if the buyers do not give up and manage to push the pair higher, we may see an increase to the November 2009 high (at 1.6875).
Very short-term outlook: mixed with bearish bias
Short-term outlook: mixed with bearish bias
MT outlook: bearish
LT outlook: mixed
Trading position (short-term; our opinion): Short. Stop-loss order: 1.6855. Please note that if the pair moves above our stop-loss level, it seems that it will rally some more before heading south once again. If this is the case, we’ll consider re-opening short positions around the 2009 high. We will keep you informed should anything change, or should we see a confirmation/invalidation of the above.
USD/JPY
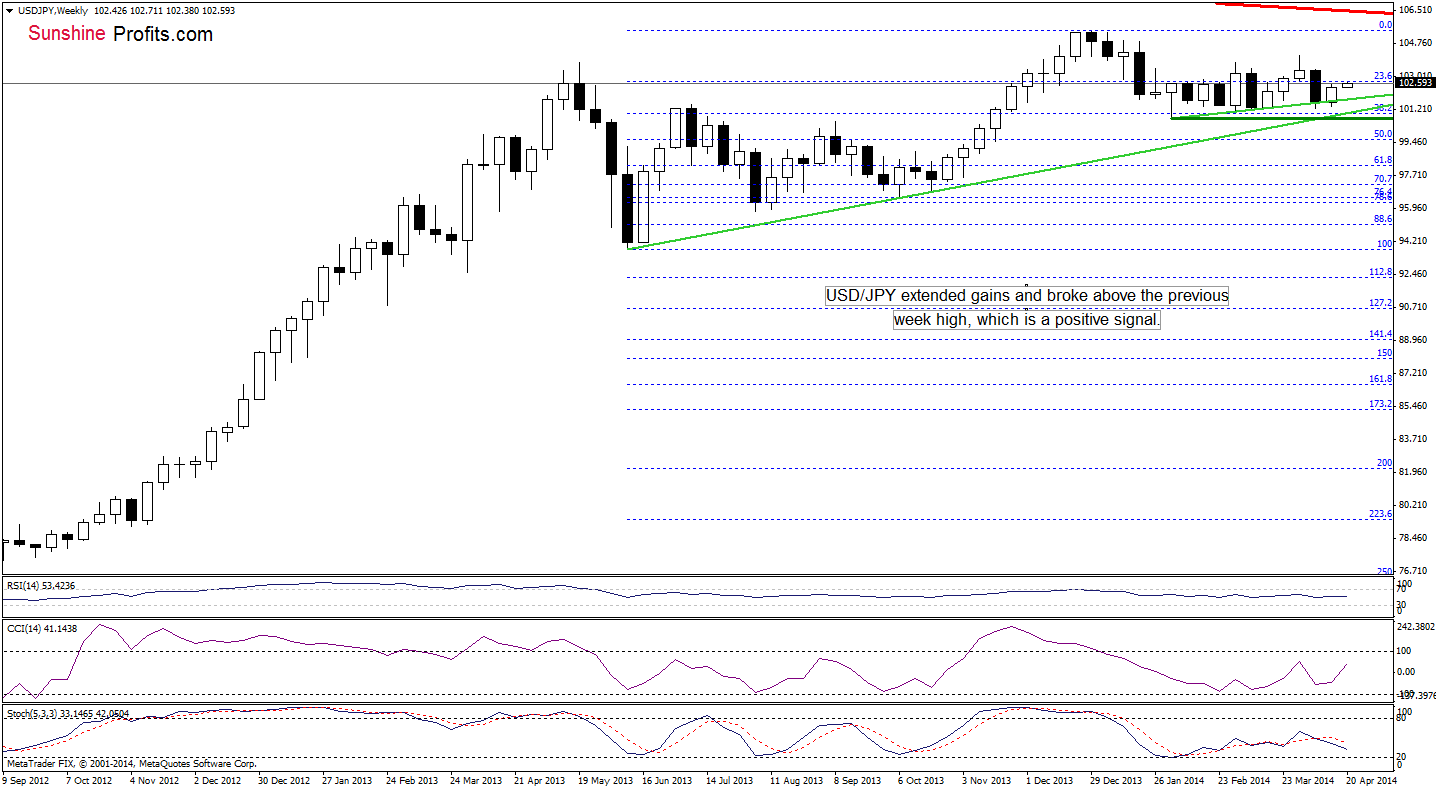
From the weekly perspective, we see that the situation hasn’t changed much and the medium-term outlook remains bullish.
Is the short-term outlook also bullish? Let’s take a look at the daily chart.
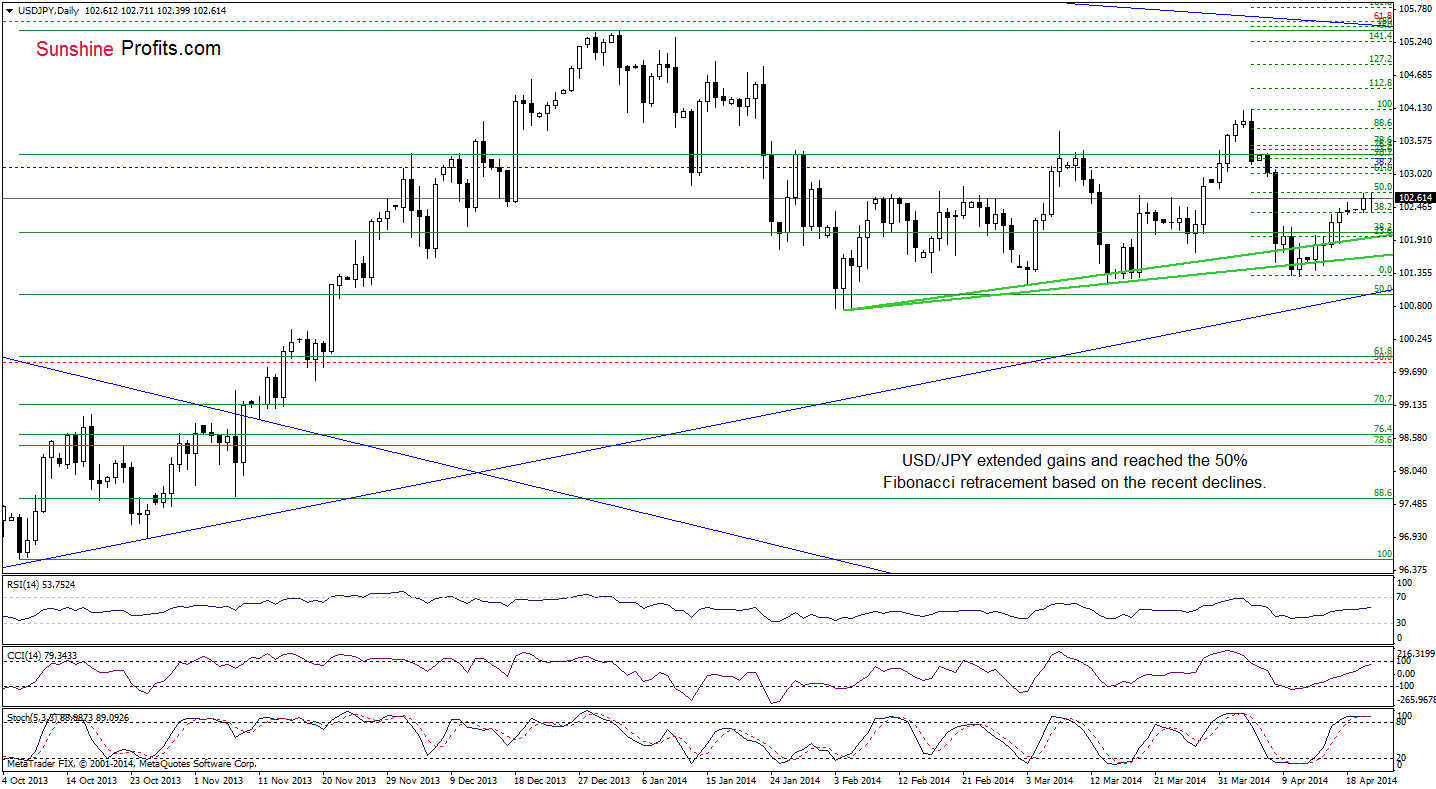
In our last Forex Trading Alert, we wrote the following:
(…) USD/JPY extended gains and still remains above the 38.2% Fibonacci retracement, which is a bullish signal. Taking this fact into account and combining with the position of the indicators (although the Stochastic Oscillator is overbought, the buy signal remains in place), it seems that further improvement should not surprise us. If this is the case, the initial upside target will be around 102.70, where the 50% Fibonacci retracement based on the recent decline is.
Looking at the above chart, we see that the buyers realized this pro growth scenario as the exchange rate reached the upside target earlier today. If this resistance level holds, we may see a pullback to the upper green support line (currently around 101.96). However, if it is broken, the next target for the buyers will be slightly below the April 8 high - around 103.03 (where the 61.8% retracement is).
Very short-term outlook: mixed with bullish bias
Short-term outlook: mixed with bullish bias
MT outlook: bullish
LT outlook: bearish
Trading position (short-term): In our opinion no positions are justified from the risk/reward perspective at the moment. We will keep you informed should anything change, or should we see a confirmation/invalidation of the above.
USD/CAD
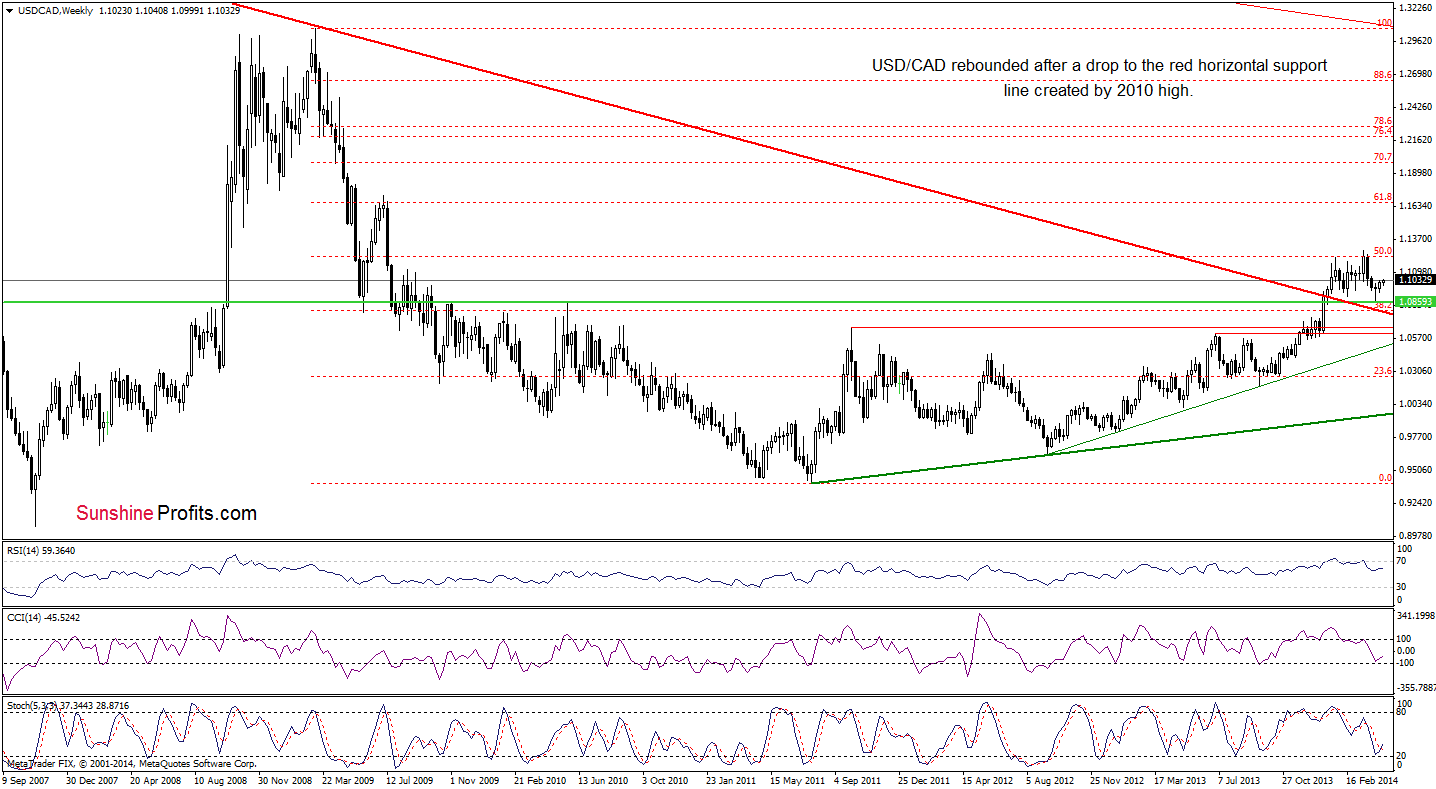
Looking at USD/CAD from the weekly perspective, we see that the situation hasn’t changed. So, what we wrote in our previous Forex Trading Alert is still valid.
(…) although the exchange rate declined in the previous weeks, it still remains above the previously-broken long term declining support/resistance line (marked with red). With this downward move, the pair declined to the horizontal green support line (created by the 2010 high) and rebounded. Nevertheless, the size of the corrective upswing is still quite small, which suggests that another attempt to move lower can’t be ruled out.
Before we summarize this currency pair, let’s move on to the daily chart.
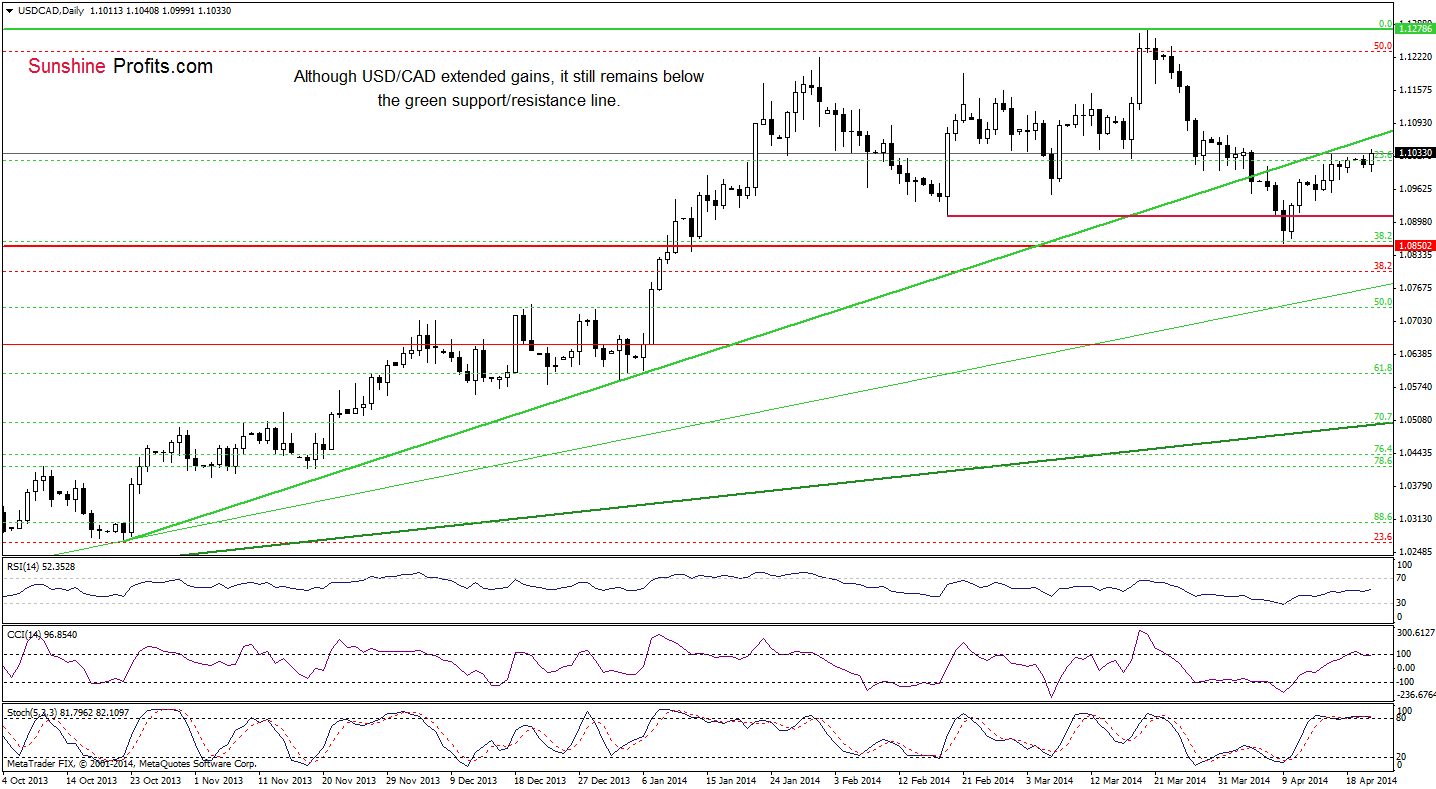
As you see on the above chart, although USD/CAD moved higher earlier today, the pair reversed and came back to a consolidation between Wednesday high and low. On one hand, if USD/CAD moves above 1.1032, we may see another attempt to break above the green resistance line. On the other hand, if the buyers fail, we will likely see a pullback to around 1.0982 (the April 17 low) or even to 1.0958, where the lower border of the consolidation is.
Very short-term outlook: mixed
Short-term outlook: mixed
MT outlook: bullish
LT outlook: bearish
Trading position (short-term): In our opinion no positions are justified from the risk/reward perspective. We will keep you informed should anything change, or should we see a confirmation/invalidation of the above.
USD/CHF
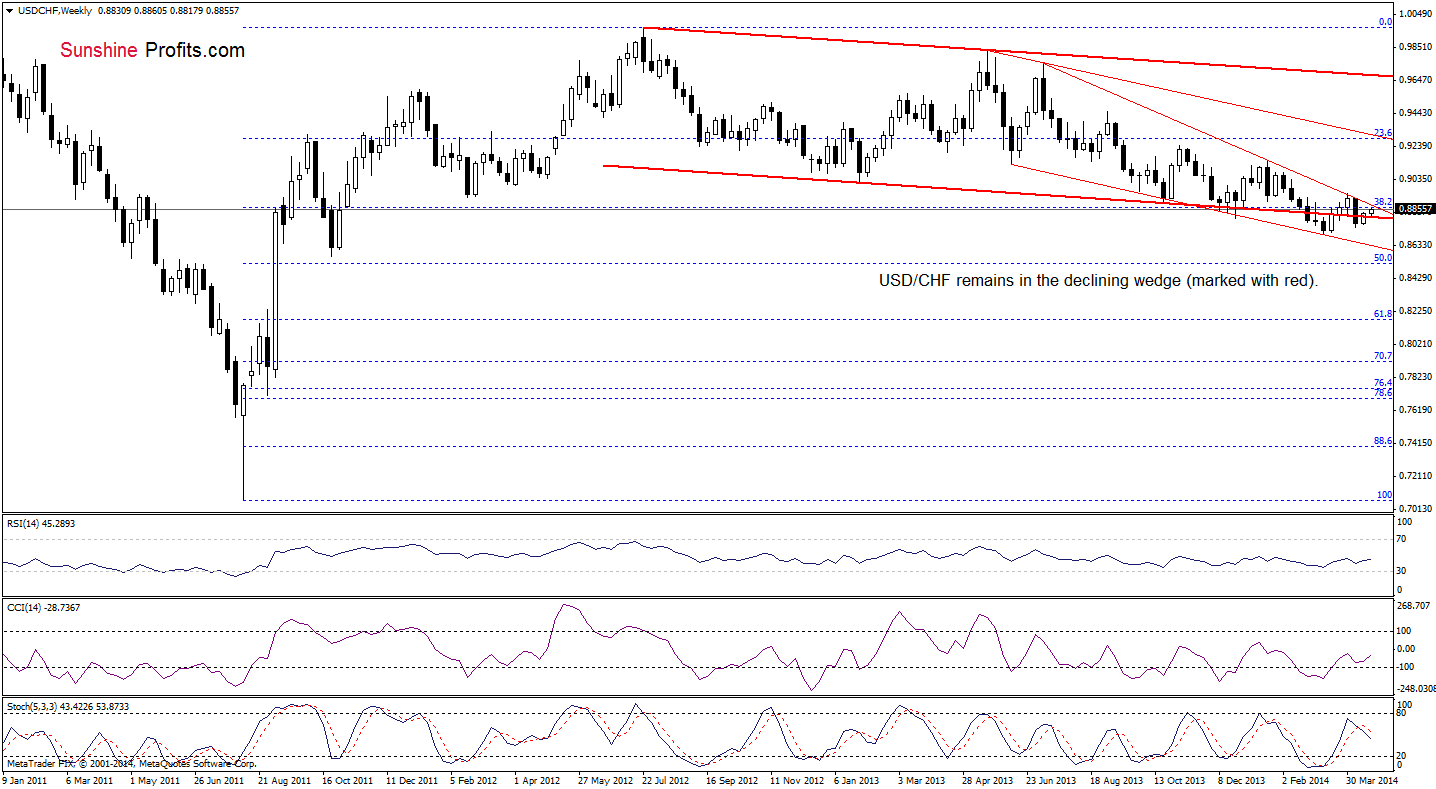
From this perspective, we see that the situation has improved as the exchange rate extended gains earlier this week. Despite this increase, we should keep in mind what we wrote in our previous Forex Trading Alert:
(…) USD/CHF has been trading in the declining wedge since July. (…) we should keep in mind that even if the exchange rate climbs higher, the space for further increases may be limited by the upper line of the declining wedge (currently around 0.8900).
Once we know the above, let’s take a closer look at the daily chart.
In our last Forex Trading Alert, we wrote the following:
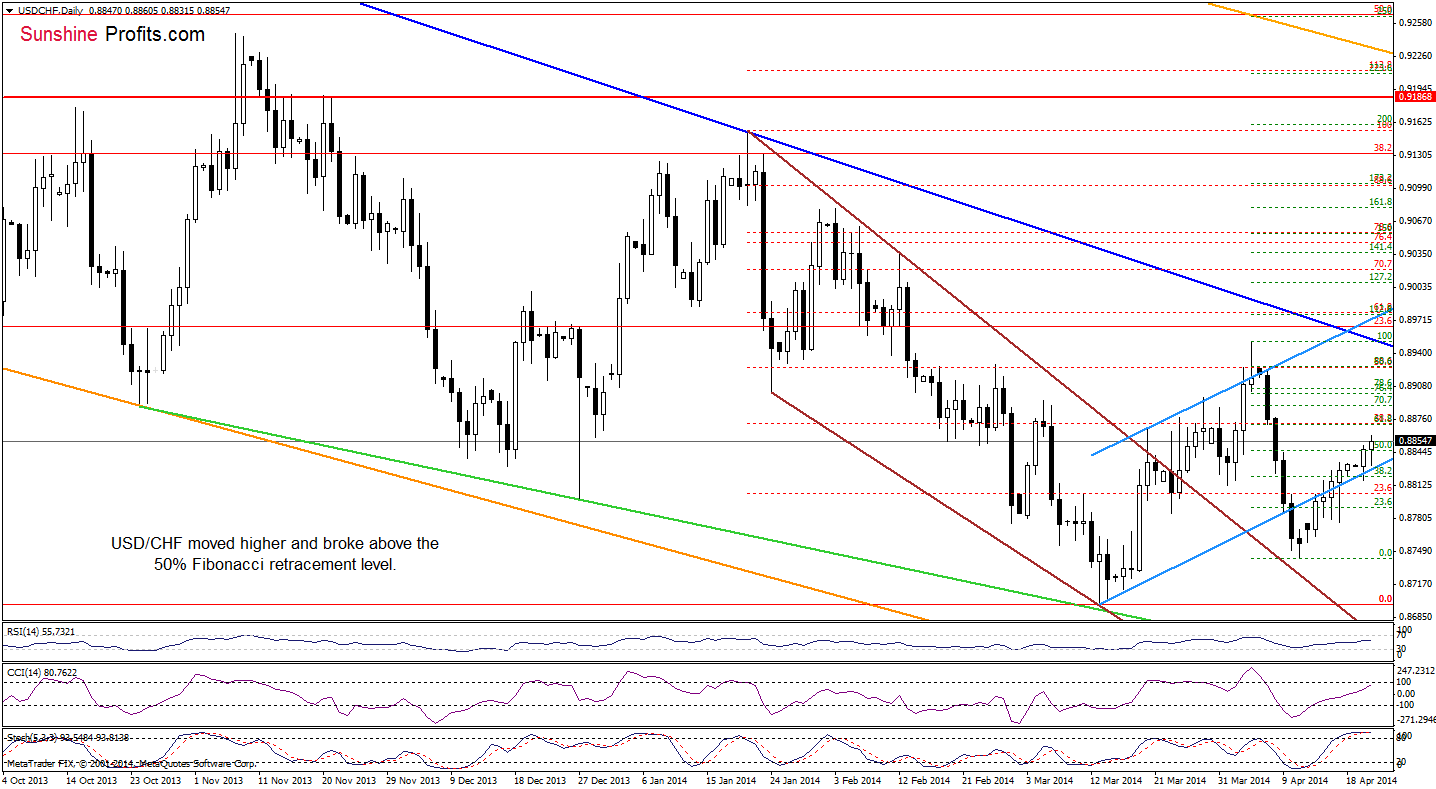
(…) the exchange rate (…) reached (…) the 38.2% Fibonacci retracement based on the recent decline. If it holds, we may see another attempt to move below the lower border of the trend channel. However, if it is broken, we will likely see further improvement and the first upside target will be around 0.8845, where the 50% Fibonacci retracement and the Apr.9 high are.
As you see on the above chart, the situation has improved as USD/CHF bounced off the lower border of the blue rising trend channel and climbed above the 50% Fibonacci retracement yesterday. Earlier today, the sellers tried to push the pair lower, but the major support encouraged buyers to act, which resulted in an upswing that took the exchange rate above yesterday’s high. If they do not give up, we may see further improvement and the next upside target will be slightly below the Apr.8 high, where the 61.8% Fibonacci retracement is (around 0.8872).
Very short-term outlook: bullish
Short-term outlook: mixed
MT outlook: bearish
LT outlook: bearish
Trading position (short-term): In our opinion no positions are justified from the risk/reward perspective. We will keep you informed should anything change, or should we see a confirmation/invalidation of the above.
AUD/USD
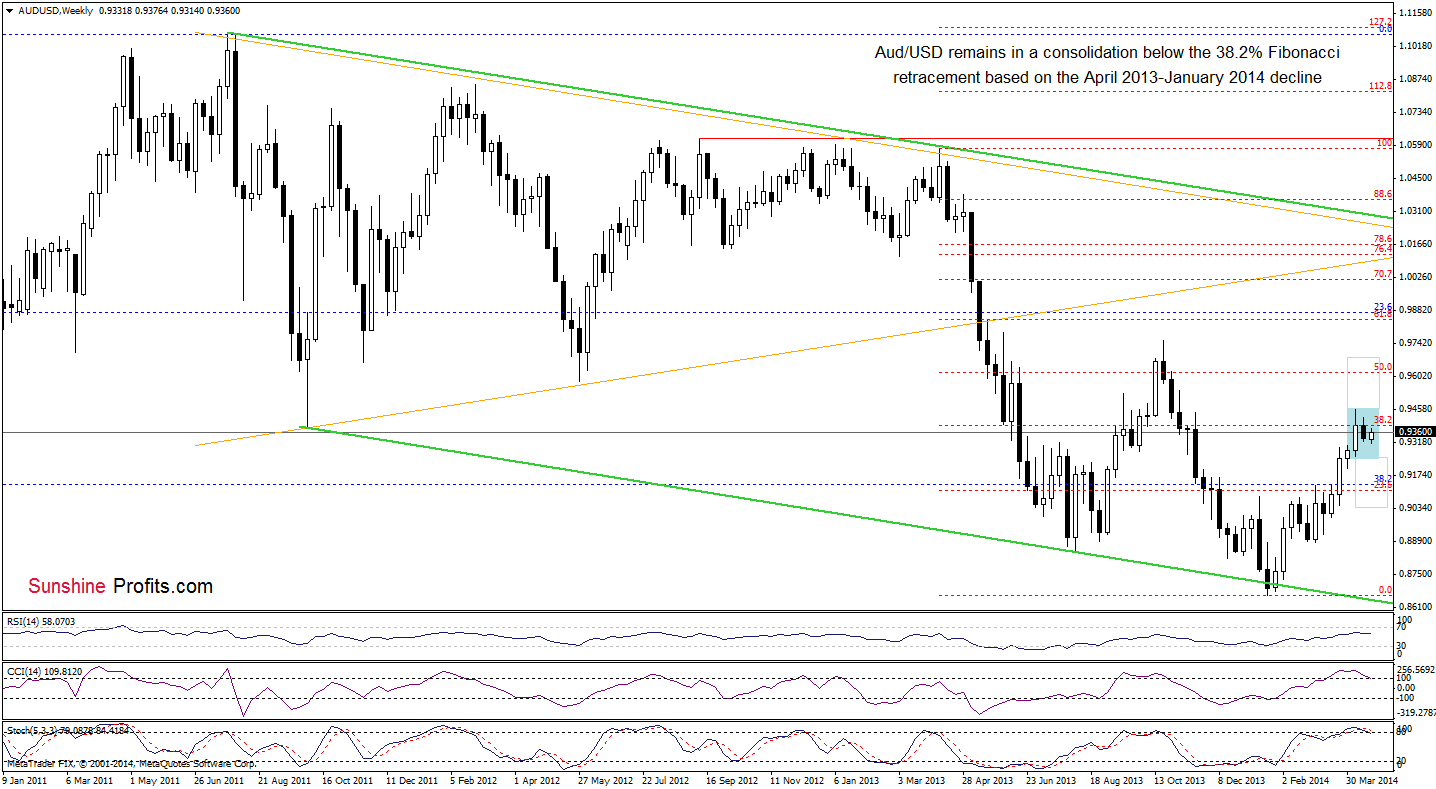
From the weekly perspective, we see that although AUD/USD rebouded earlier this week, it still remains in a consolidation (marked with light blue) around the 38.2% Fibonacci retracement based on the entire Apr.2013-Jan.2014 decline (0.9389). Taking this fact into account, if the buyers do not give up, we may see further improvement and an increase to the April high. However, if they fail and the pair extends declines, we may see a correction to around 0.9253, where the lower border of the consolidation is. Please note that the CCI and Stochastic Oscillator are overbought (and very close to generating sell signals), which suggests that another attempt to move lower should not surprise us.
Once we know the medium-term situation, let’s move on to the daily chart.
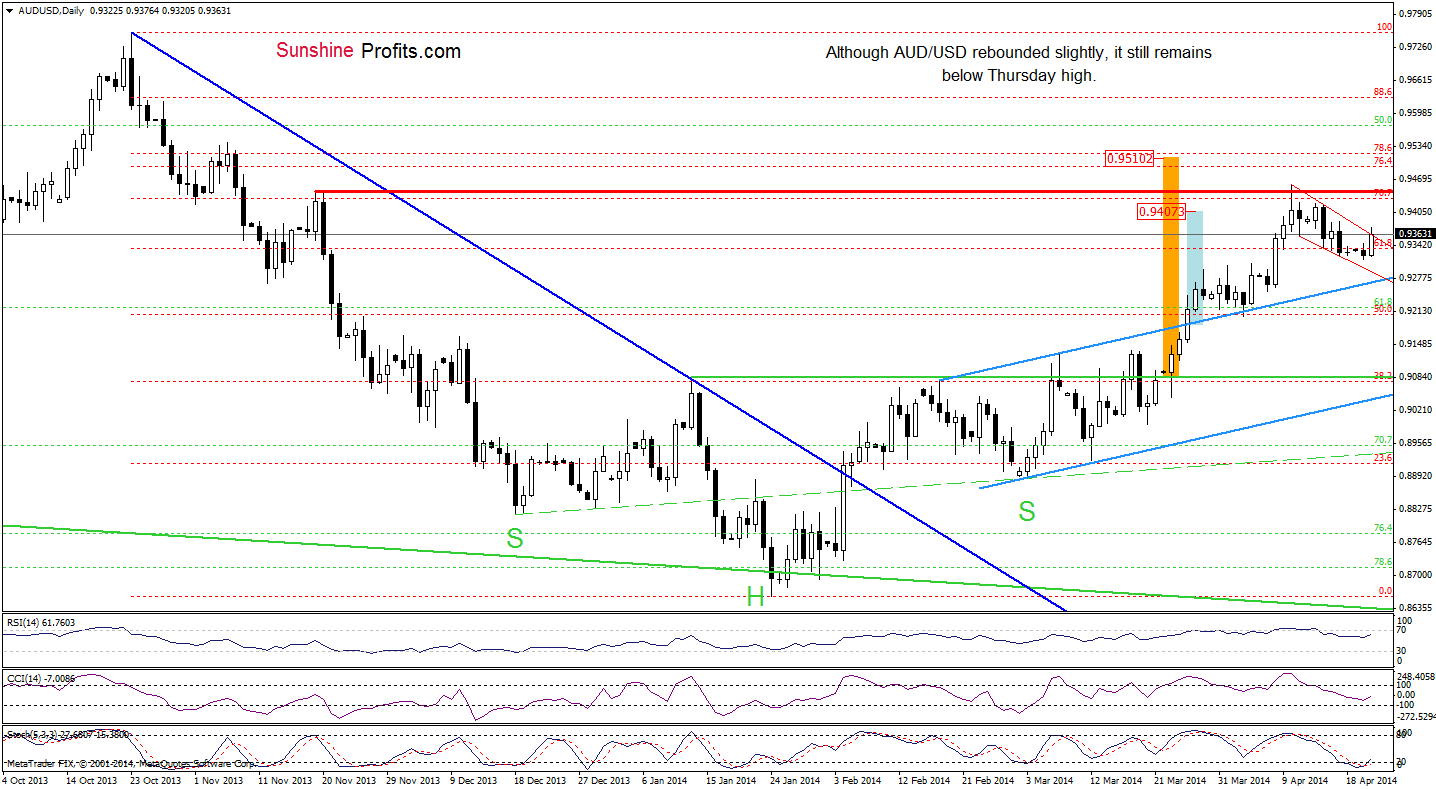
Looking at the daily chart, we see that AUD/USD rebounded and broke (very temporarily) above the upper line of the declining trend channel earlier today. If this resistance line holds, we will likely see a pullback to Monday low, or even to the lower border of this formation (currently around 0.9291). At this point, it’s worth noting that not far above this line is Thursday high, which serves as an additional resistance (0.9389). However, if the exchange rate closes the day above the declining red line, we may see further improvement and an increase to around 0.9433 (where the upside target after a breakout above the upper line of the trend channel is). Please note that in this area is also the 70.7% Fibonacci retracement based on the entire Oct.-Jan. decline, which serves as resistance.
Very short-term outlook: mixed
Short-term outlook: mixed with bearish bias
MT outlook: bearish
LT outlook: bearish
Trading position (short-term): In our opinion no positions are justified from the risk/reward perspective at the moment. We will keep you informed should anything change, or should we see a confirmation/invalidation of the above.
Thank you.
Nadia Simmons
Forex & Oil Trading Strategist
Przemyslaw Radomski, CFA
Founder, Editor-in-chief
Gold & Silver Trading Alerts
Forex Trading Alerts
Oil Investment Updates
Oil Trading Alerts

