
Yesterday, the British pound declined against the U.S. dollar and invalidated the breakout above the previous 2014 high. This was a bearish signal and we have seen its effects earlier today as GBP/USD extended losses. Does this mean that investor sentiment waned? Could we see a sizable downswing in the near future?
In our opinion the following forex trading positions are justified - summary:
- EUR/USD: none
- GBP/USD: short (stop-loss order: 1.6855)
- USD/JPY: none
- USD/CAD: none
- USD/CHF: none
- AUD/USD: none
EUR/USD
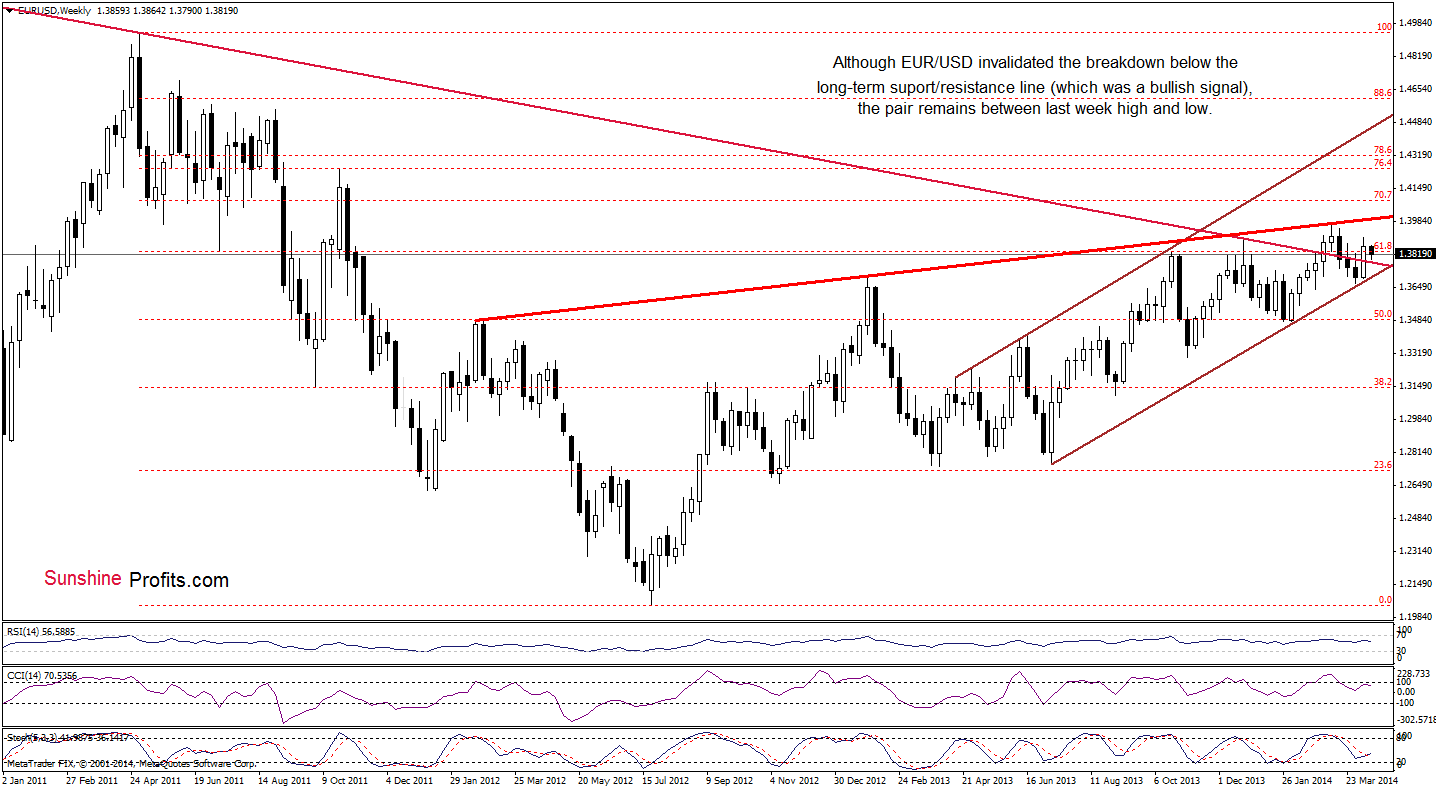
From the weekly perspective, we see that the situation hasn’t changed much. Therefore, what we wrote in our previous Forex Trading Alert is still up-to-date.
(…) EUR/USD still remains above the previously-broken long-term declining resistance line and the lower border of the rising trend channel (marked with brown). (…) These two important lines still serve as major support. As you see on the above chart, the exchnge rate remains below the 2014 high and the rising resistance line (marked with red), which succesfully stopped growth in the previous month. From this perspective, it seems that as long as these key lines are in play, a bigger upward or downward move is not likely to be seen.
Once we know the above, let’s take a look at the daily chart.
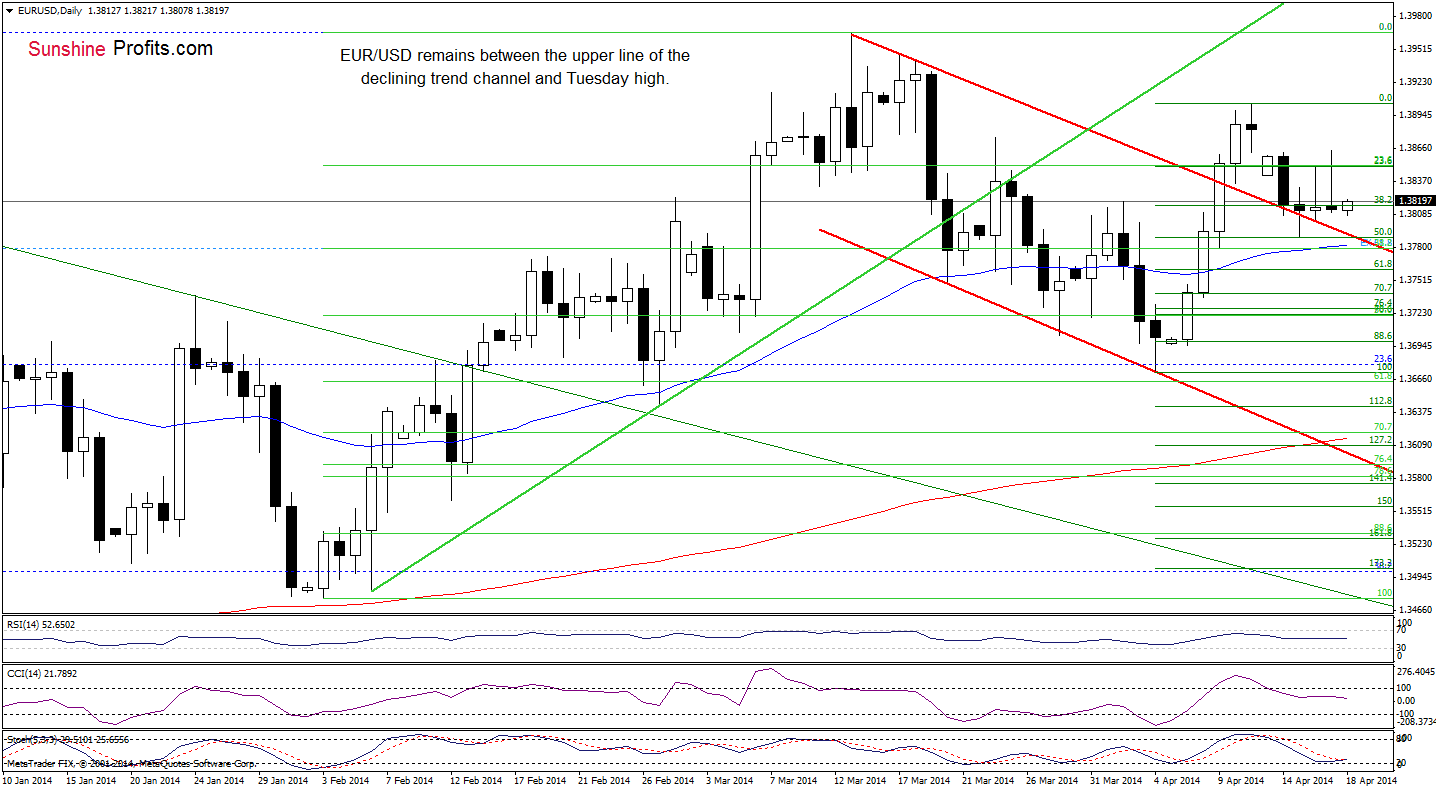
Looking at the above chart, we see that EUR/USD remains in a consolidation between Monday high and the upper line of the declining trend channel. On one hand, if the proximity to the strong support line encourage buyers to act, we may see an increase to the upper line of the consolidation (around 1.3862). However, if the pair drops below yesterday low and extends losses, we will likely see another attempt to break below the upper line of the declining trend channel.
Very short-term outlook: mixed
Short-term outlook: mixed
MT outlook: bearish
LT outlook: bearish
Trading position: In our opinion no positions are justified from the risk/reward perspective. We are not opening short positions just yet, because of the divergence on the long-term charts (we wrote more about this situation in our Forex Trading Alert posted on Thursday), however we will quite likely open it once we see some kind of confirmation. We will keep you informed should anything change, or should we see a confirmation/invalidation of the above.
GBP/USD
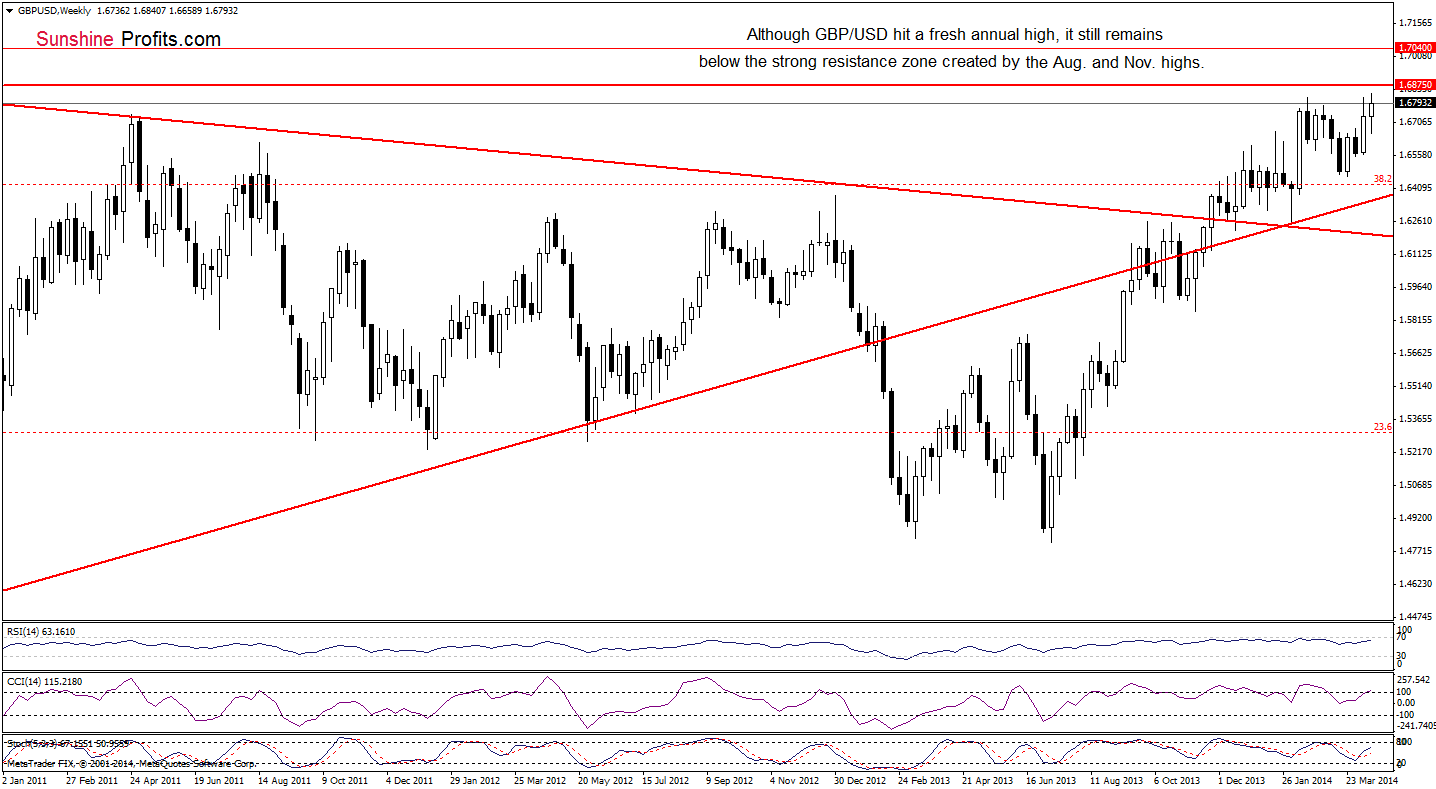
From the weekly perspective, we see that GBP/USD reversed after an increase to a fresh 2014 high and declined below the previous high. This is a bearish signal, which suggests that further deterioration should not surprise us. In fact, this, on its own, seems enough to justify having a speculative short position.
To have more complete picture of the current situation in GBP/USD, let’s take a look at the daily chart.
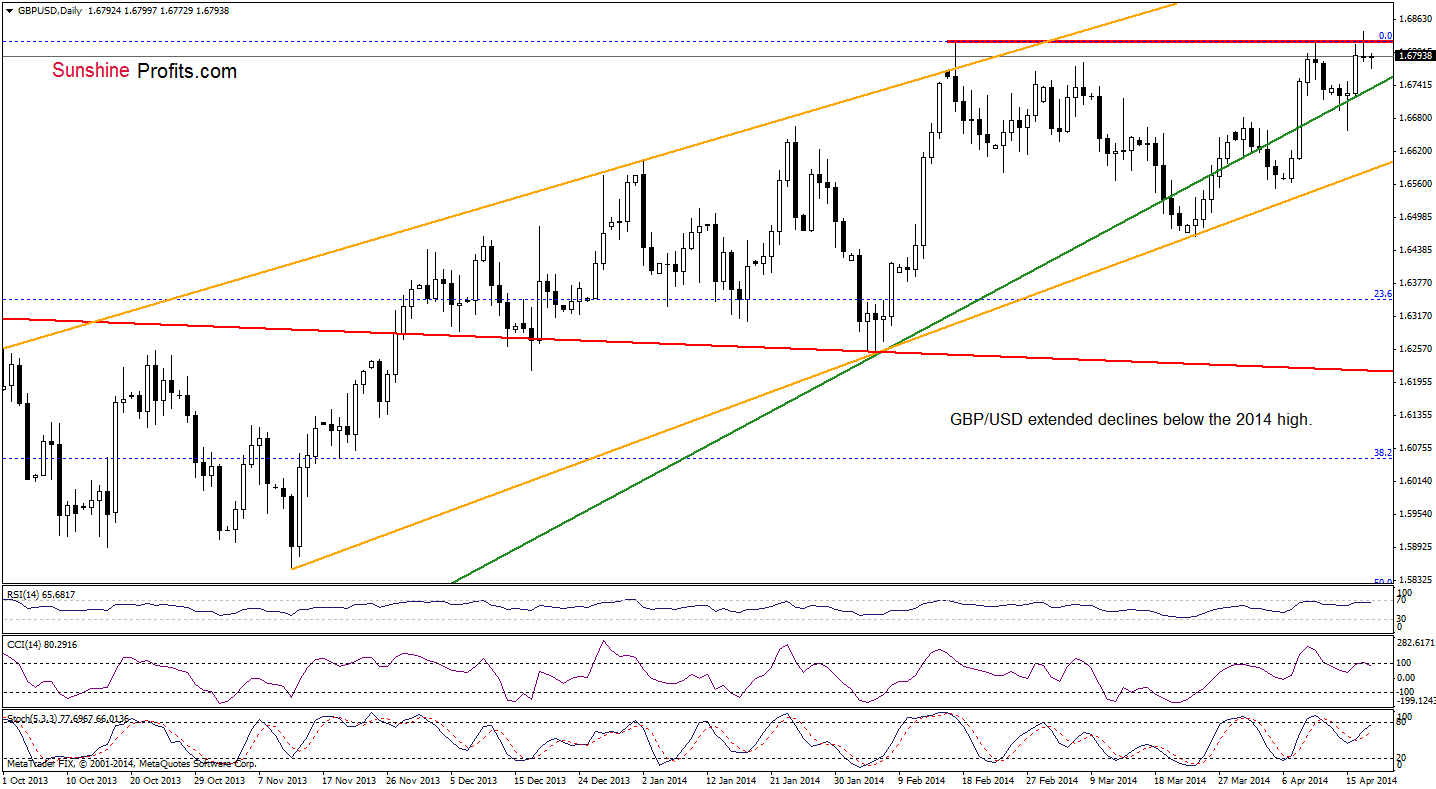
As you see on the above chart, GBP/USD extended declines earlier today. Therefore, what we wrote yesterday is still up-to-date.
(…) the pair reversed and slipped below the previous highs, invalidating earlier breakout. An invalidation of a breakout is a bearish signal, which might trigger a bigger decline. If this is the case, the initial downside target for the sellers will be the previously-broken green medium-term support line (currently around 1.6727).
Very short-term outlook: bearish
Short-term outlook: mixed with bearish bias
MT outlook: bearish
LT outlook: mixed
Trading position (short-term; our opinion): Short. Stop-loss order: 1.6855. Please note that if the pair moves above our stop-loss level, it seems that it will rally some more before heading south once again. If this is the case, we’ll consider re-opening short positions around the 2009 high. We will keep you informed should anything change, or should we see a confirmation/invalidation of the above.
USD/JPY
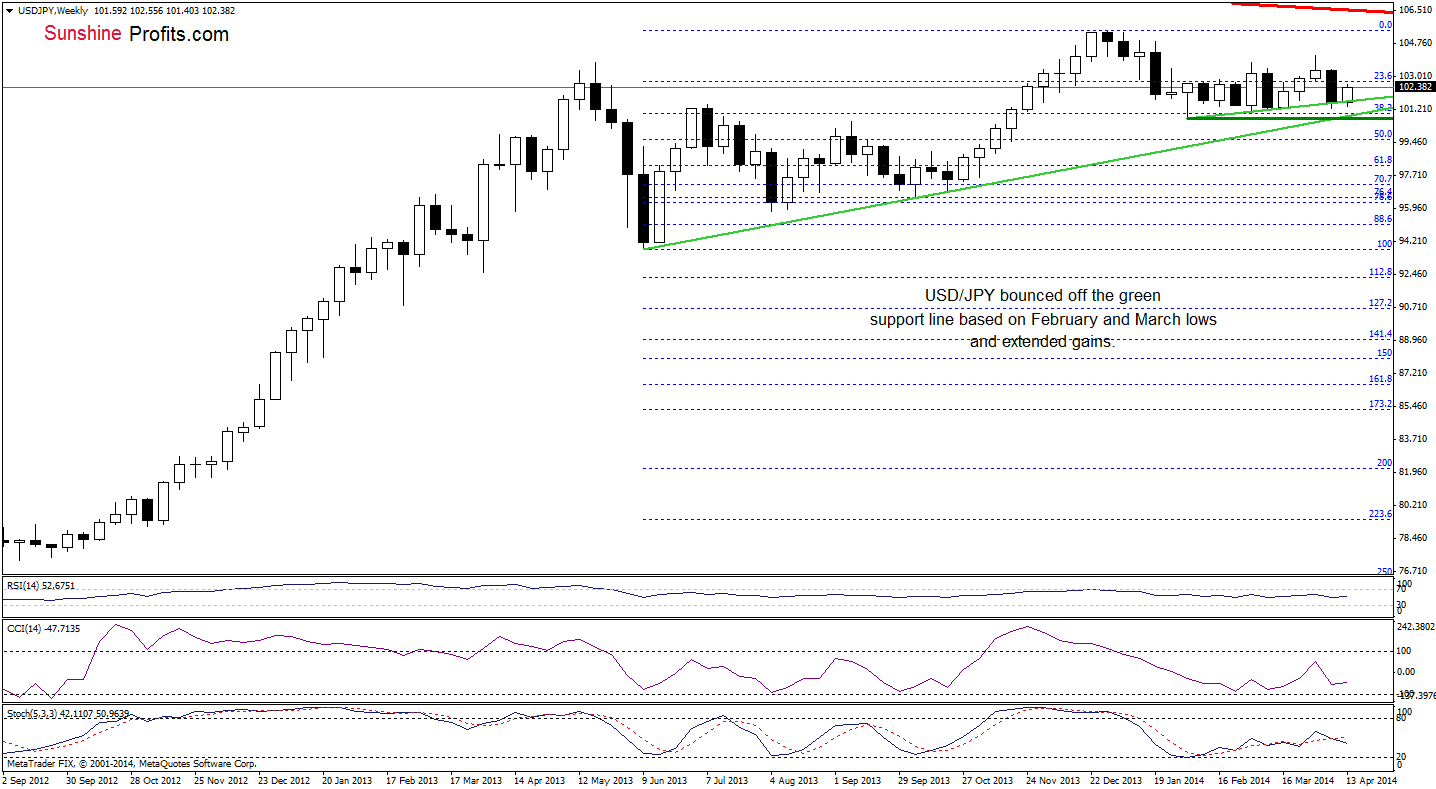
From the weekly perspective, we see that the situation hasn’t changed much and the medium-term outlook remains bullish.
Is the short-term outlook also bullish? Let’s take a look at the daily chart.
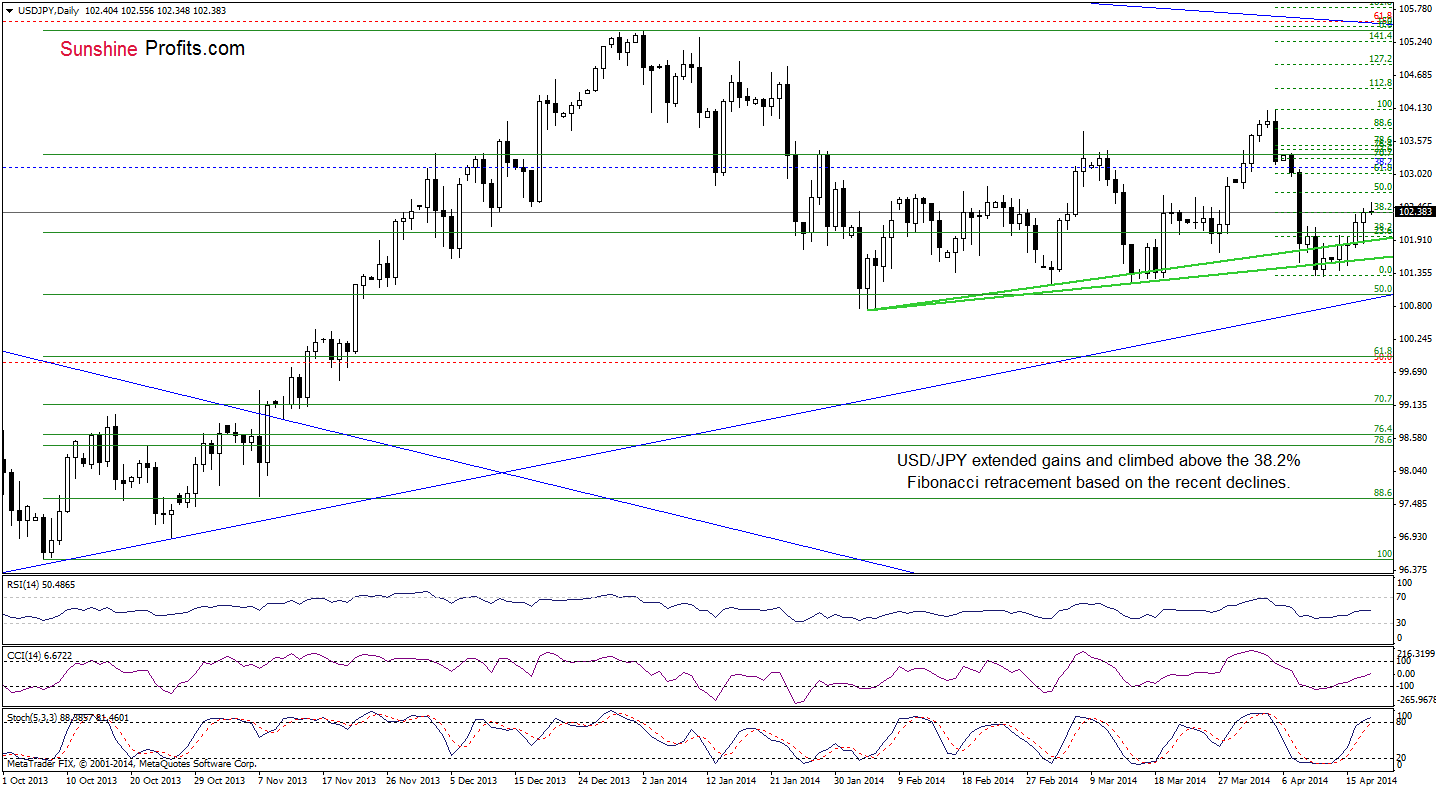
As you see on the above chart, USD/JPY extended gains and still remains above the 38.2% Fibonacci retracement, which is a bullish signal. Taking this fact into account and combining with the position of the indicators (although the Stochastic Oscillator is overbought, the buy signal remains in place), it seems that further improvement should not surprise us. If this is the case, the initial upside target will be around 102.70, where the 50% Fibonacci retracement based on the recent decline is. If it is broken, the next target for the buyers will be slightly below the April 8 high - around 103.03 (the 61.8% retracement).
Very short-term outlook: bullish
Short-term outlook: mixed with bullish bias
MT outlook: bullish
LT outlook: bearish
Trading position (short-term): In our opinion no positions are justified from the risk/reward perspective at the moment. We will keep you informed should anything change, or should we see a confirmation/invalidation of the above.
USD/CAD
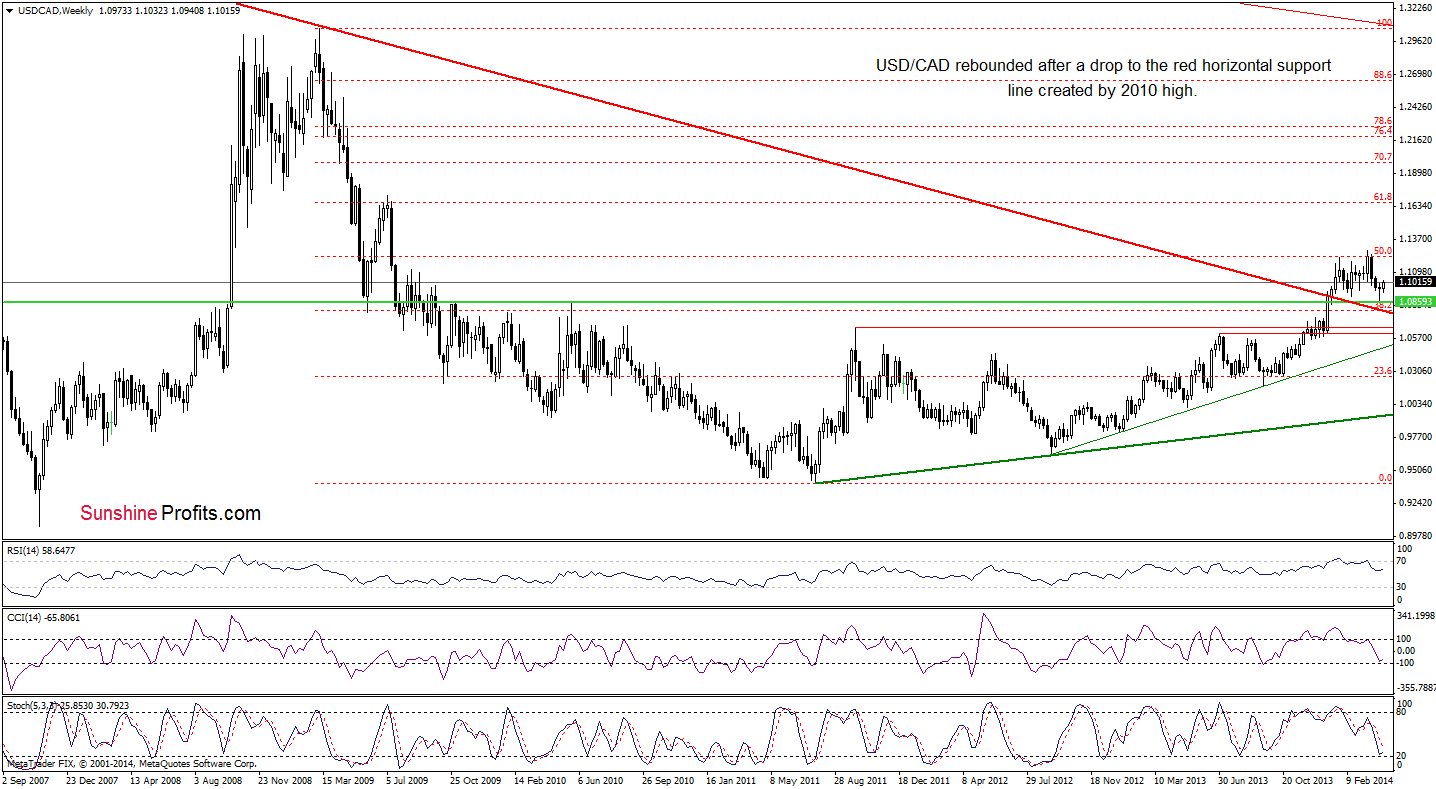
Looking at USD/CAD from the weekly perspective, we see that the situation hasn’t changed. So, what we wrote yesterday is still valid.
(…) although the exchange rate declined in the previous weeks, it still remains above the previously-broken long term declining support/resistance line (marked with red). With this downward move, the pair declined to the horizontal green support line (created by the 2010 high) and rebounded. Nevertheless, the size of the corrective upswing is still quite small, which suggests that another attempt to move lower can’t be ruled out.
Before we summarize this currency pair, let’s move on to the daily chart.
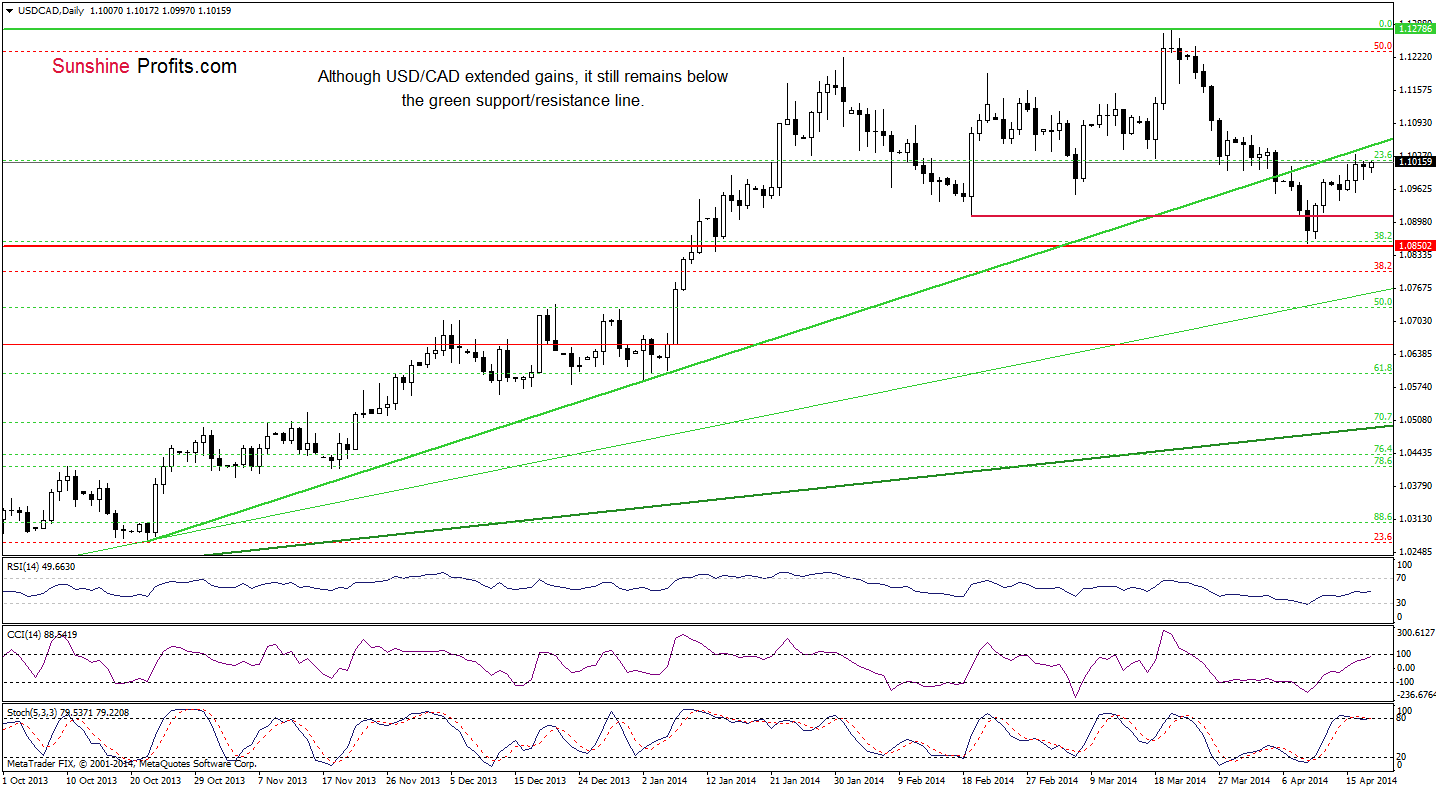
As you see on the above chart, USD/CAD still remains in a consolidation between Wednesday high and low. Therefore, what we wrote in our previous Forex Trading Alert is still up-to-date.
(…) On one hand, if USD/CAD moves above Wednesday high, we may see another attempt to break above the green resistance line. On the other hand, if the pair drops below yesterday’s low, we will likely see a pullback to around 1.0909 (where the Feb.19 low is) or even to the April low of 1.0857.
Very short-term outlook: mixed
Short-term outlook: mixed
MT outlook: bullish
LT outlook: bearish
Trading position (short-term): In our opinion no positions are justified from the risk/reward perspective. We will keep you informed should anything change, or should we see a confirmation/invalidation of the above.
USD/CHF
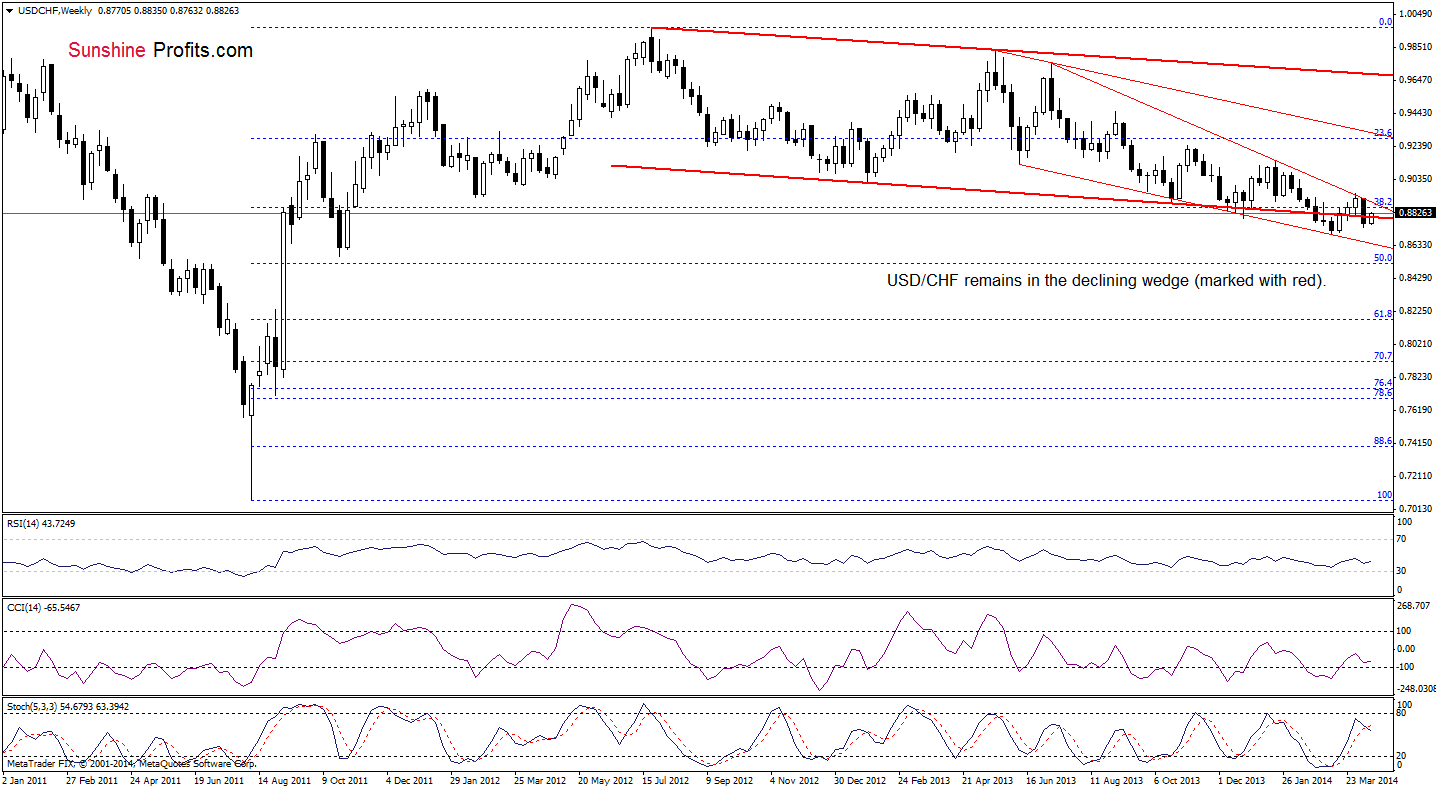
From the weekly perspective, we see that the situation remains unchanged. So, what we wrote yesterday is still valid.
(…) USD/CHF has been trading in the declining wedge since July. (…) USD/CHF increased this week. Nevertheless, we should keep in mind that even if the exchange rate climbs higher, the space for further increases may be limited by the upper line of the declining wedge (currently around 0.8900).
Once we know the above, let’s take a closer look at the daily chart.
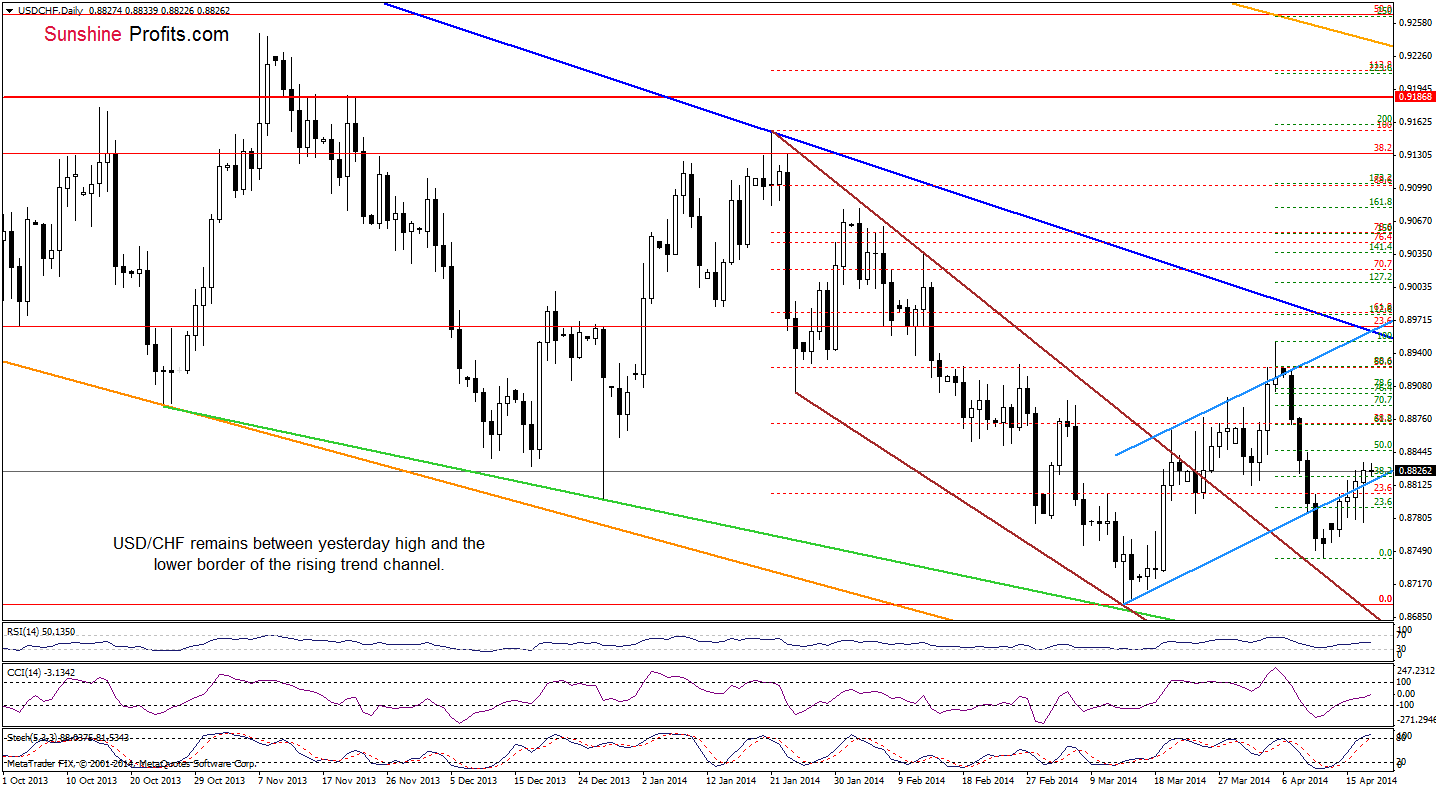
As you see on the above chart, the situation hasn’t changed much as USD/CHF is still trading between yesterday high and the previously-broken lower border of the blue rising trend channel, which means that what we wrote yesterday is still up-to-date.
(…) the exchange rate not only erased earlier losses, but also reached yesterday’s intraday high. (…) this area is reinforced by the 38.2% Fibonacci retracement based on the recent decline. If it holds, we may see another attempt to move below the lower border of the trend channel. However, if it is broken, we will likely see further improvement and the first upside target will be around 0.8845, where the 50% Fibonacci retracement and the Apr.9 high are. If this level is broken, the next upside target will be slightly below the Apr.8 high, where the 61.8% Fibonacci retracement is (around 0.8872).
Very short-term outlook: bullish
Short-term outlook: mixed
MT outlook: bearish
LT outlook: bearish
Trading position (short-term): In our opinion no positions are justified from the risk/reward perspective. We will keep you informed should anything change, or should we see a confirmation/invalidation of the above.
AUD/USD
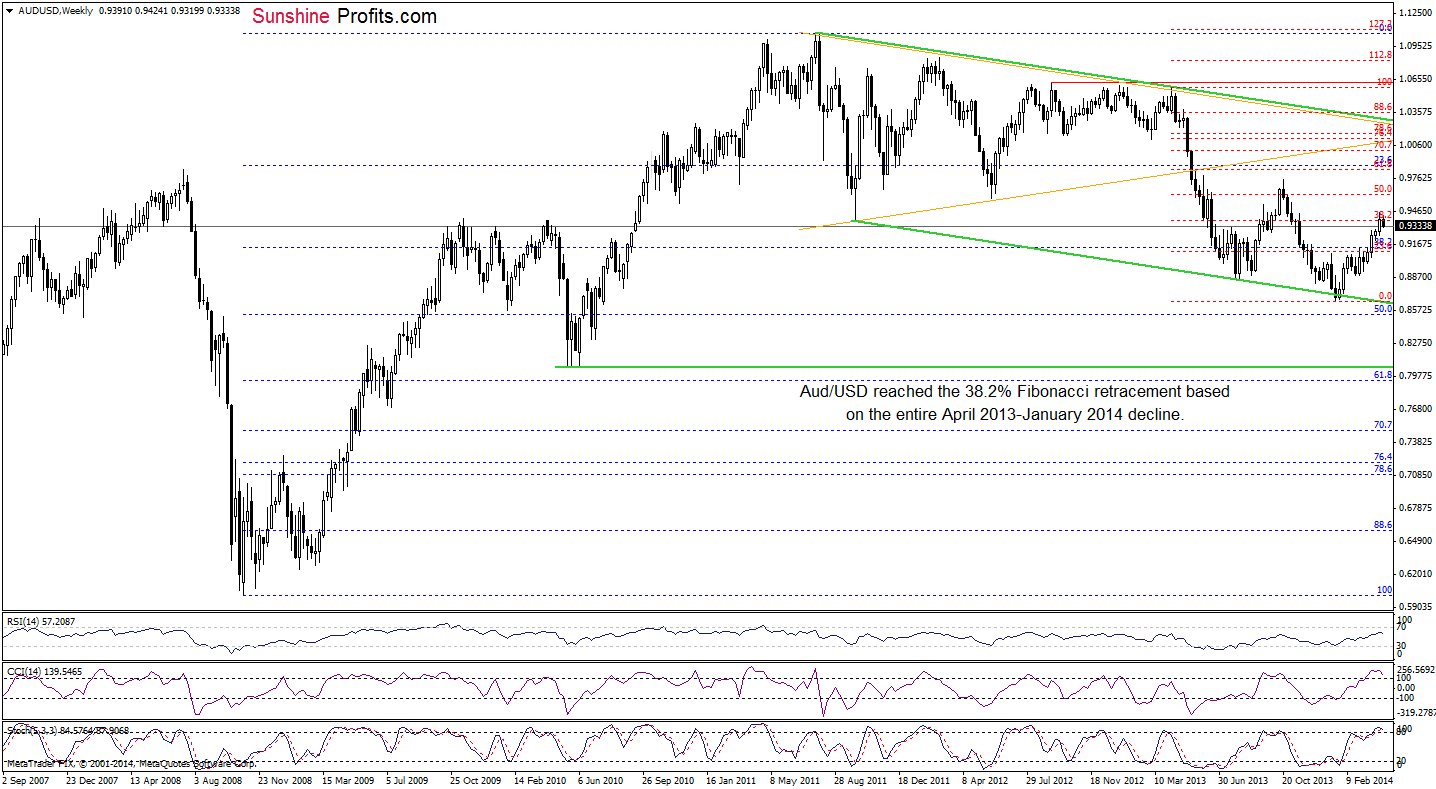
Looking at the weekly chart, we see that AUD/USD broke above the 38.2% Fibonacci retracement based on the entire Apr.2013-Jan.2014 decline (around 0.9389) in the previous week. However, as it turned out, this improvement was only temporarily and the exchange rate invalidated the breakout earlier this week. This is a bearish signal – especially when we factor in the current position of the indicators. Please note that the CCI and Stochastic Oscillator are overbought, which suggests that further deterioration is just around the corner.
Once we know the medium-term situation, let’s move on to the daily chart.
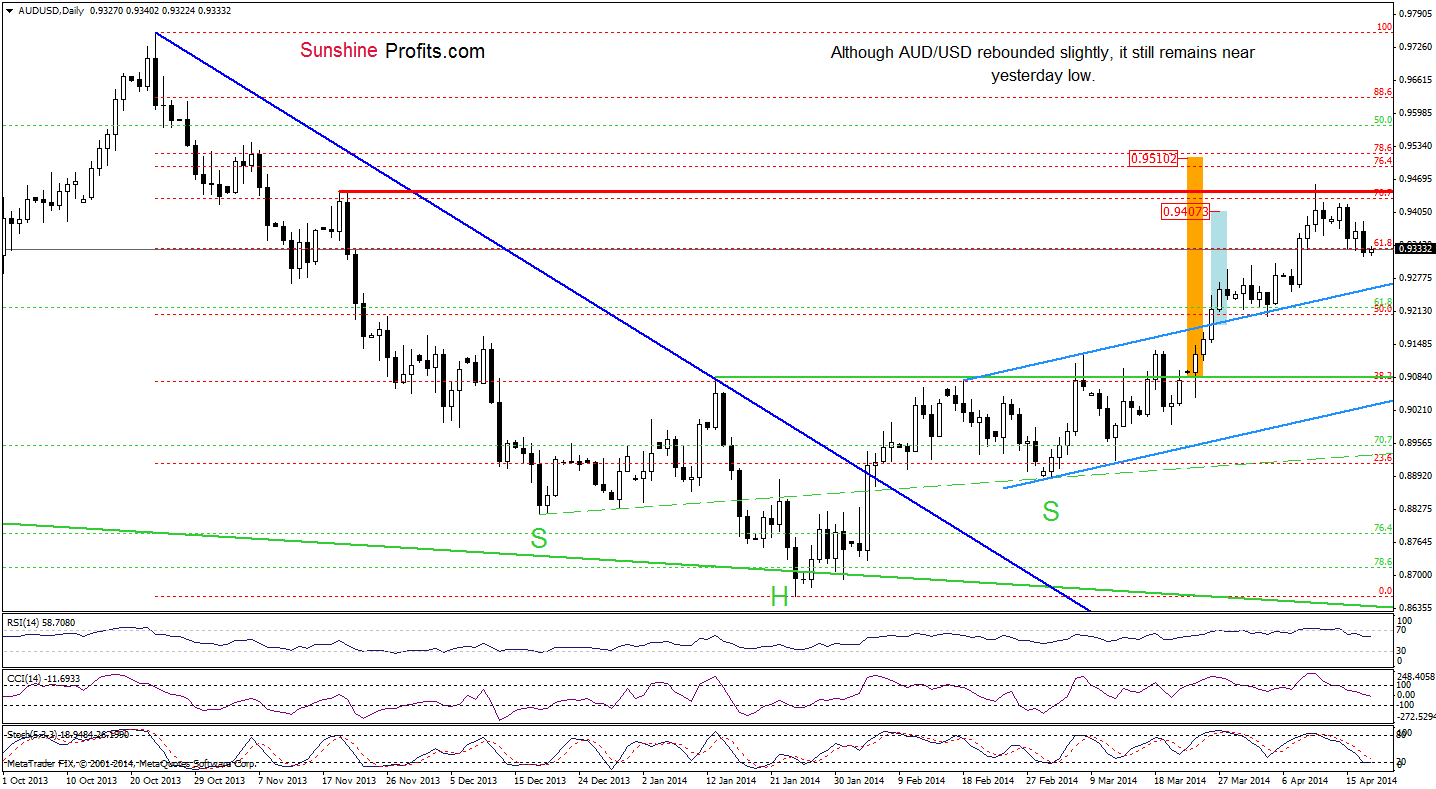
Looking at the above chart, we see that AUD/USD paused declines earlier today and moved little higher. However, the size of an upswing is too small to say that we won’t see another attempt to move lower (especially when we factor in sell signals generated by the indicators, which remain in place). If the sellers push the pair below yesterday low, we will likely see further deterioration and the downside target will be the previously-broken upper line of the trend channel (currently at 0.9256).
Very short-term outlook: bearish
Short-term outlook: mixed with bearish bias
MT outlook: bearish
LT outlook: bearish
Trading position (short-term): In our opinion no positions are justified from the risk/reward perspective at the moment. We will keep you informed should anything change, or should we see a confirmation/invalidation of the above.
Finishing today’s Forex Trading Alert, we would like to inform that we won’t publish our commentary on Forex on Monday due to the Holiday travel plans. We apologize for the inconvenience.
Thank you.
Nadia Simmons
Forex & Oil Trading Strategist
Przemyslaw Radomski, CFA
Founder, Editor-in-chief
Gold & Silver Trading Alerts
Forex Trading Alerts
Oil Investment Updates
Oil Trading Alerts

