
Earlier today, the common currency moved higher against the U.S. dollar boosted by Greece's successful return to the financial markets. Despite this positive fundamental factor, the EUR/USD pair remains below the resistance zone. What’s next?
In our opinion the following forex trading positions are justified - summary:
- EUR/USD: none
- GBP/USD: short (stop- loss order: 1.6855)
- USD/JPY: none
- USD/CAD: none
- USD/CHF: none
- AUD/USD: none
EUR/USD
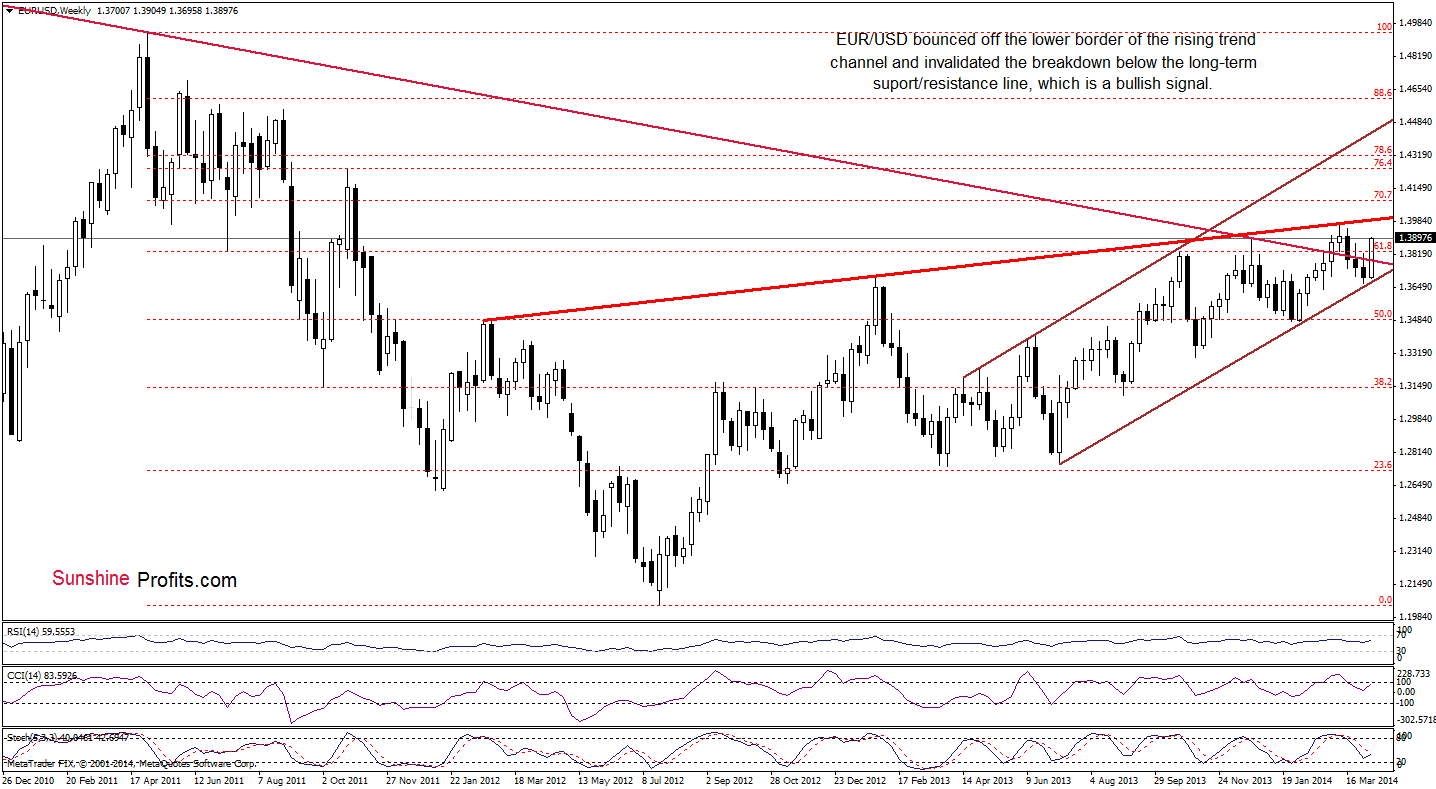
Looking at the EUR/USD pair from the weekly perspective, we see that the situation hasn’t changed. Therefore, what we wrote in our previous Forex Trading Alert remains up-to-date.
(…) EUR/USD bouced off the lower border of the rising trend channel (marked with brown) and came back above the long-term declining resistance line – at least for now. As a reminder, invalidation of the breakdown is a strong bullish signal that suggests further improvement. Despite these positive circumstances, the common currency remains below the 2014 high and the rising resistance line (marked with red), which succesfully stopped growth in the previous month.
Before we summarize this currency pair, let’s take a look at the daily chart.
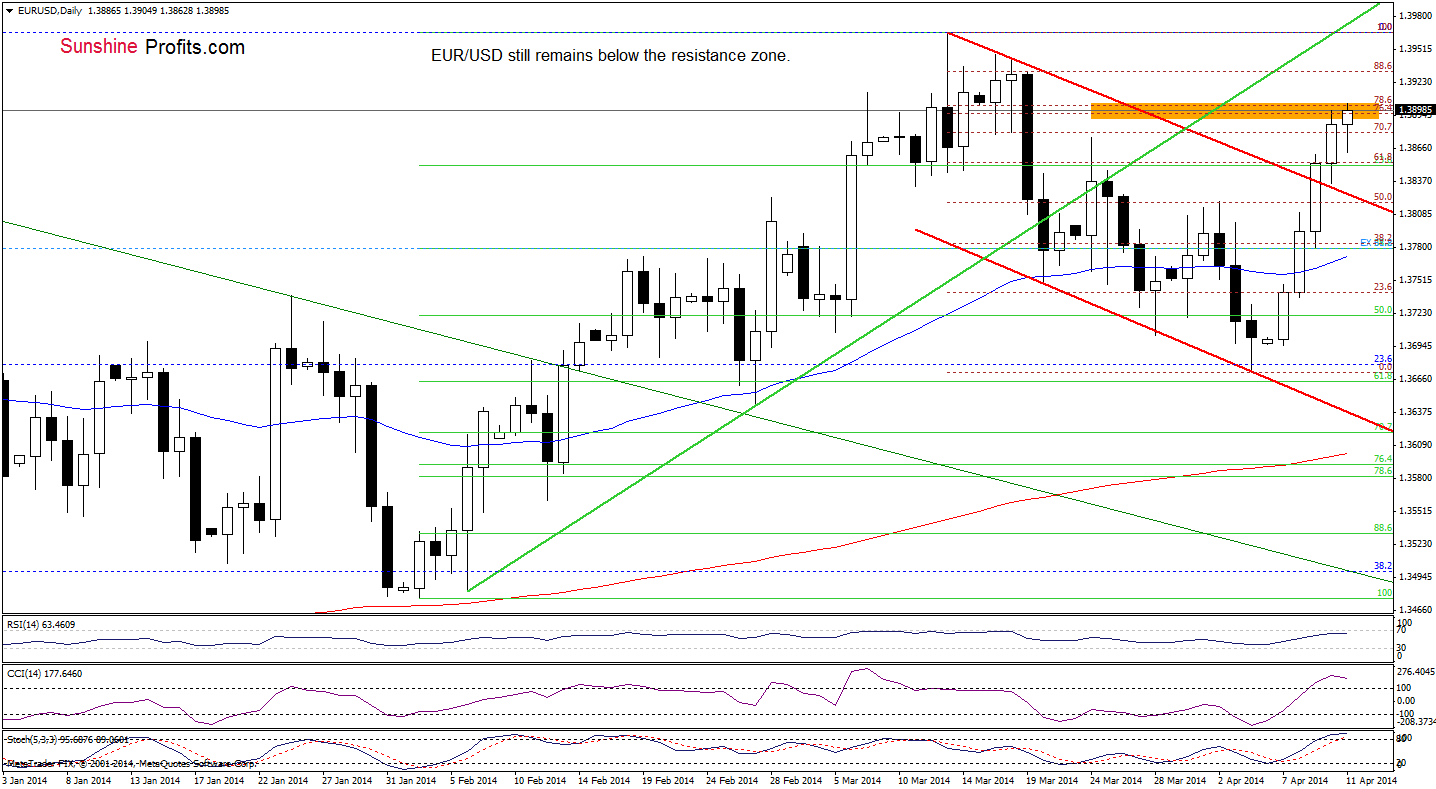
As you see on the above chart, although EUR/USD moved little higher, the pair still remains in the resistance zone created by the 76.4% and 78.6% Fibonacci retracements (around 1.3896-1.3900). So, what we wrote in our last Forex Trading Alert remains valid.
(…) If it is broken, we may see further improvement and an increase to the previously-broken green resistance line, which currently almost intersects the 2014 high. However, if this resistance area encourages sellers to act, we may see a pullback in the coming days and the first downside target will be the upper line of the declining trend channel (which serves as support at the moment).
Since there were only daily rallies in the past 5 days, it seems that a correction here is more likely. This correction can – and likely will – translate into a reversal on the long-term chart and quite possibly lead to greater declines.
Very short-term outlook: mixed
Short-term outlook: bearish
MT outlook: bearish
LT outlook: bearish
Trading position: In our opinion no positions are justified from the risk/reward perspective. We are not opening short positions just yet, because of the divergence on the long-term charts (we wrote more about this situation in our previous Forex Trading Alert), however we will quite likely open it once we see some kind of confirmation. We will keep you informed should anything change, or should we see a confirmation/invalidation of the above.
GBP/USD
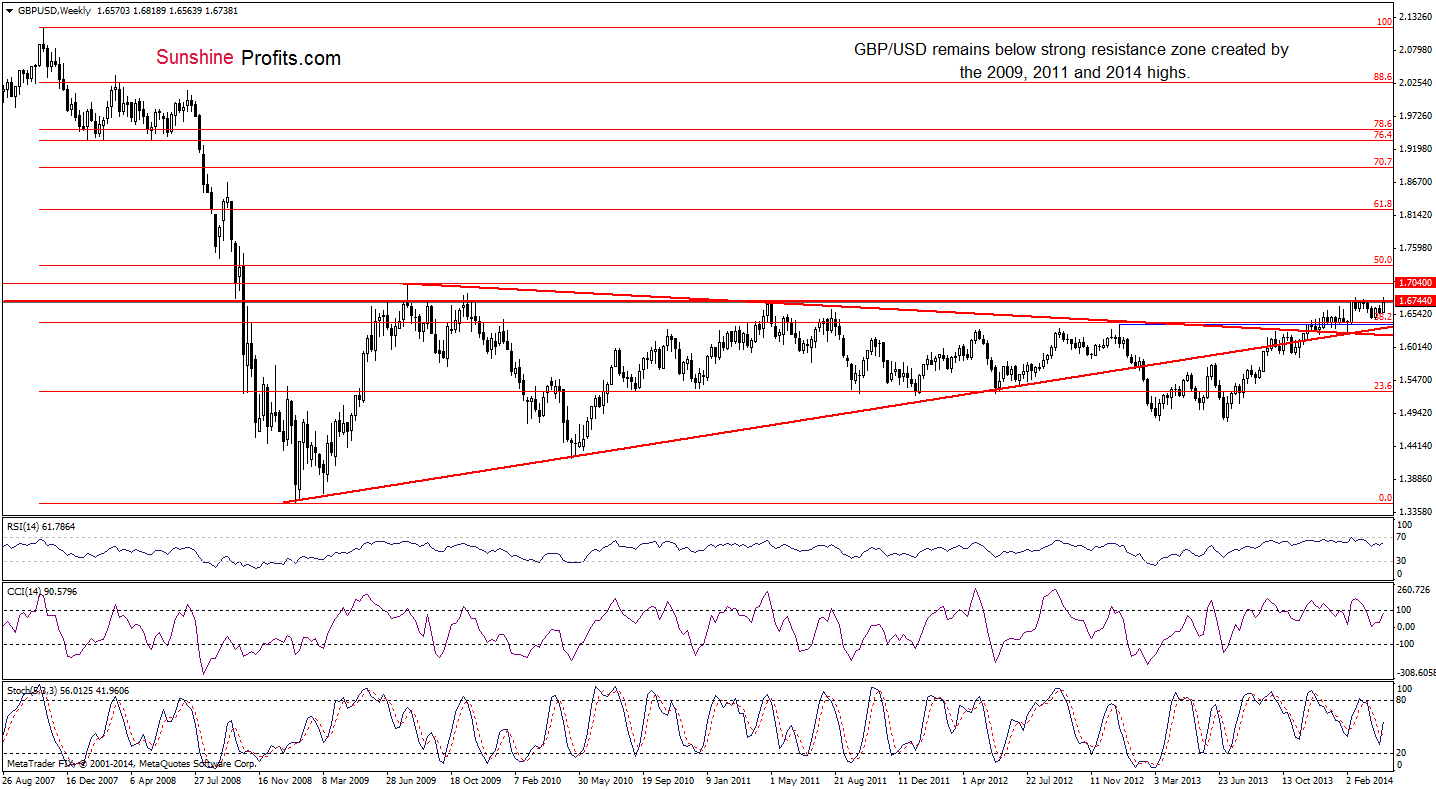
From the weekly perspective, we see that GBP/USD still remains below the strong resistance zone created by the 2009, 2011 and 2014 highs, which suggests that further deterioration should not surprise us. In fact, its likely enough to justify having a speculative short position open (the one that was opened yesterday is already profitable).
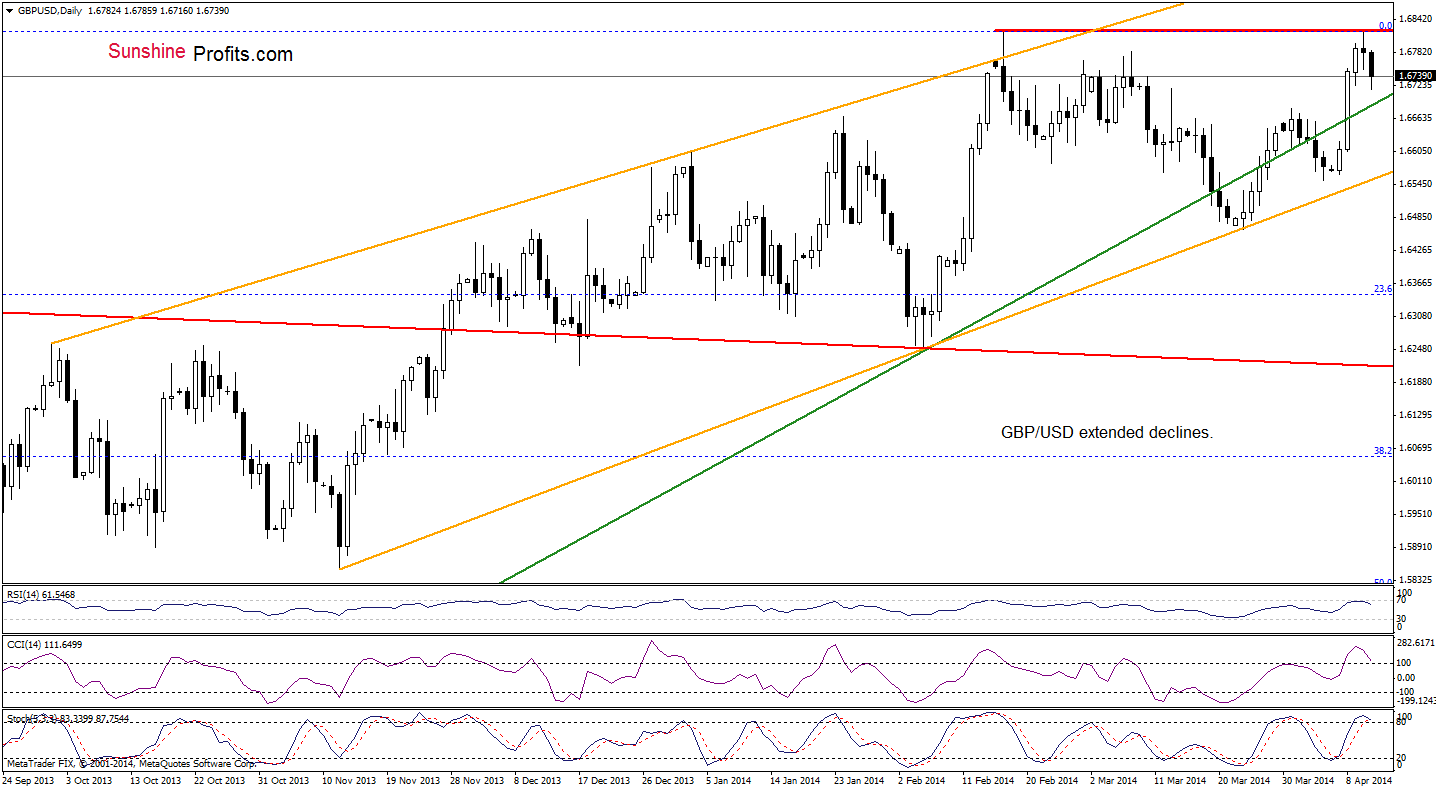
To have more complete picture of the current situation in GBP/USD, let’s take a look at the daily chart.
Quoting our last Forex Trading Alert:
(…) GBP/USD (…) reached the 2014 high earlier today. If this strong resistance level holds, we will likely see a bearish double top pattern. In this case, the initial downside target will be the medium-term rising green line (currently around 1.6676). If it is broken, we may see a drop to the lower border of the orange rising trend channel (around 1.6550), which corresponds to the April low. (…) Please note that the current position of the indicators suggests that correction is just around the corner (the RSI declined from the level of 70, while the CCI and Stochastic Oscillator are overbought).
As you see on the above chart, GBP/USD extended declines and moved away from the 2014 high earlier today. This drop in combination with the current position of the indicators (they are all overbought and very close to generating sell signals) suggests that the bearish scenario is likely to be seen in the following days. Therefore, all the above-mentioned downside targets are still in play.
Very short-term outlook: mixed
Short-term outlook: bearish
MT outlook: bearish
LT outlook: mixed
Trading position (short-term; our opinion): Short. Stop-loss order: 1.6855. Please note that even if GBP/USD breaks above the 2014 high (and stop-loss order works), we’ll consider opening short positions around the 2009 high. For now, the position is already profitable. We will keep you informed should anything change, or should we see a confirmation/invalidation of the above.
USD/JPY
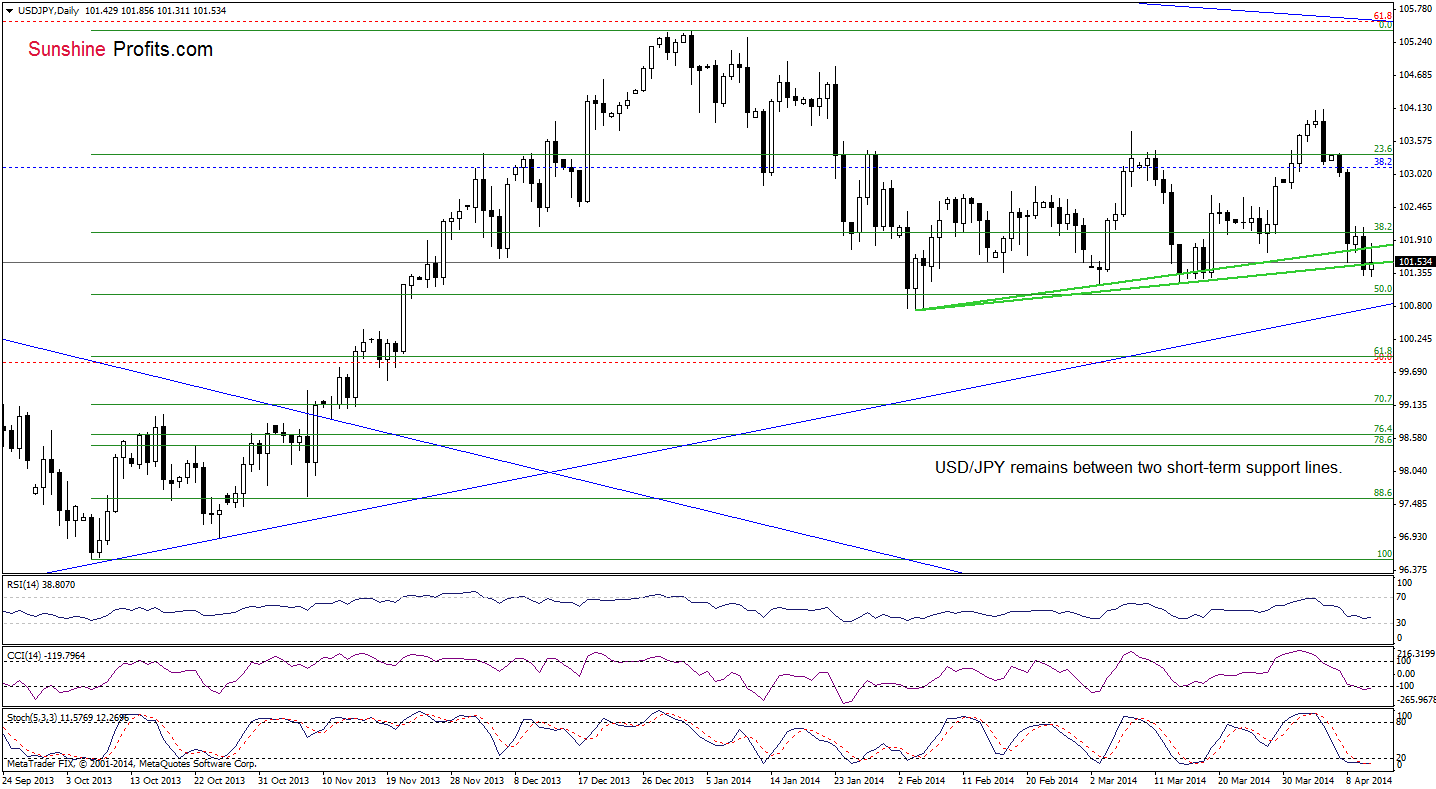
On the daily chart, we see that the buyers didn’t manage to push USD/JPY above the upper green line, which triggered another (very temporarily ) decline below the lower green support line earlier today. Taking these facts into account, what we wrote in our previous Forex Trading Alert is still up-to-date.
(…) if this support is broken, we will likely see a drop to the March 14 low or even to the February low. Please note that sell signals remain in place, supporting sellers.
Nevertheless, we should keep in mind that the CCI and Stochastic Oscillator declined and are oversold, which suggests that a pause or a corrective upswing in the coming days should not surprise us (especially if the indicators generate buy signals).
Very short-term outlook: mixed
Short-term outlook: mixed
MT outlook: bullish
LT outlook: bearish
Trading position (short-term): In our opinion no positions are justified from the risk/reward perspective at the moment. We will keep you informed should anything change, or should we see a confirmation/invalidation of the above.
USD/CAD
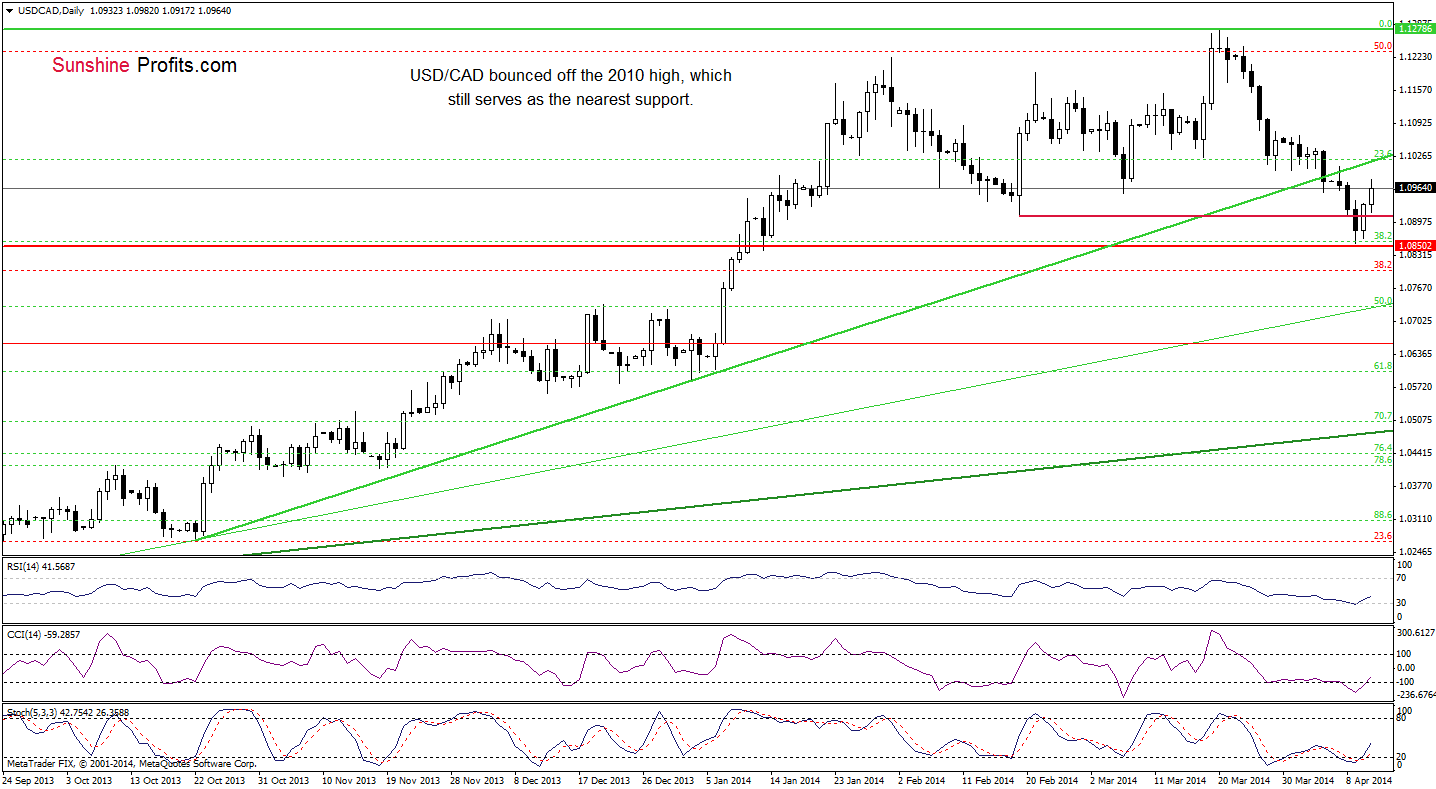
Quoting our last Forex Trading Alert:
(…) USD/CAD declined to the red support line yesterday. If this strong support holds and encourages buyers to act, we may see a corrective upswing to the previously-broken green support line (around 1.1009). Please note that this scenario is reinforced by the current position of the indicators (the RSI bounced off the level of 30, while the CCI and Stochastic Oscillator are close to generating buy signals).
As you see on the above chart, the exchange rate extended gains and climbed above Tuesday’s high. Additionally, all indicators generated buy signals, which suggests that yesterday’s pro growth scenario is likely to be seen in the near future. If the buyers do not give up and successfully break above the nearest resistance line, we may see further improvement in the coming week.
Very short-term outlook: bullish
Short-term outlook: mixed
MT outlook: bullish
LT outlook: bearish
Trading position (short-term): In our opinion no positions are justified from the risk/reward perspective. We will keep you informed should anything change, or should we see a confirmation/invalidation of the above.
USD/CHF
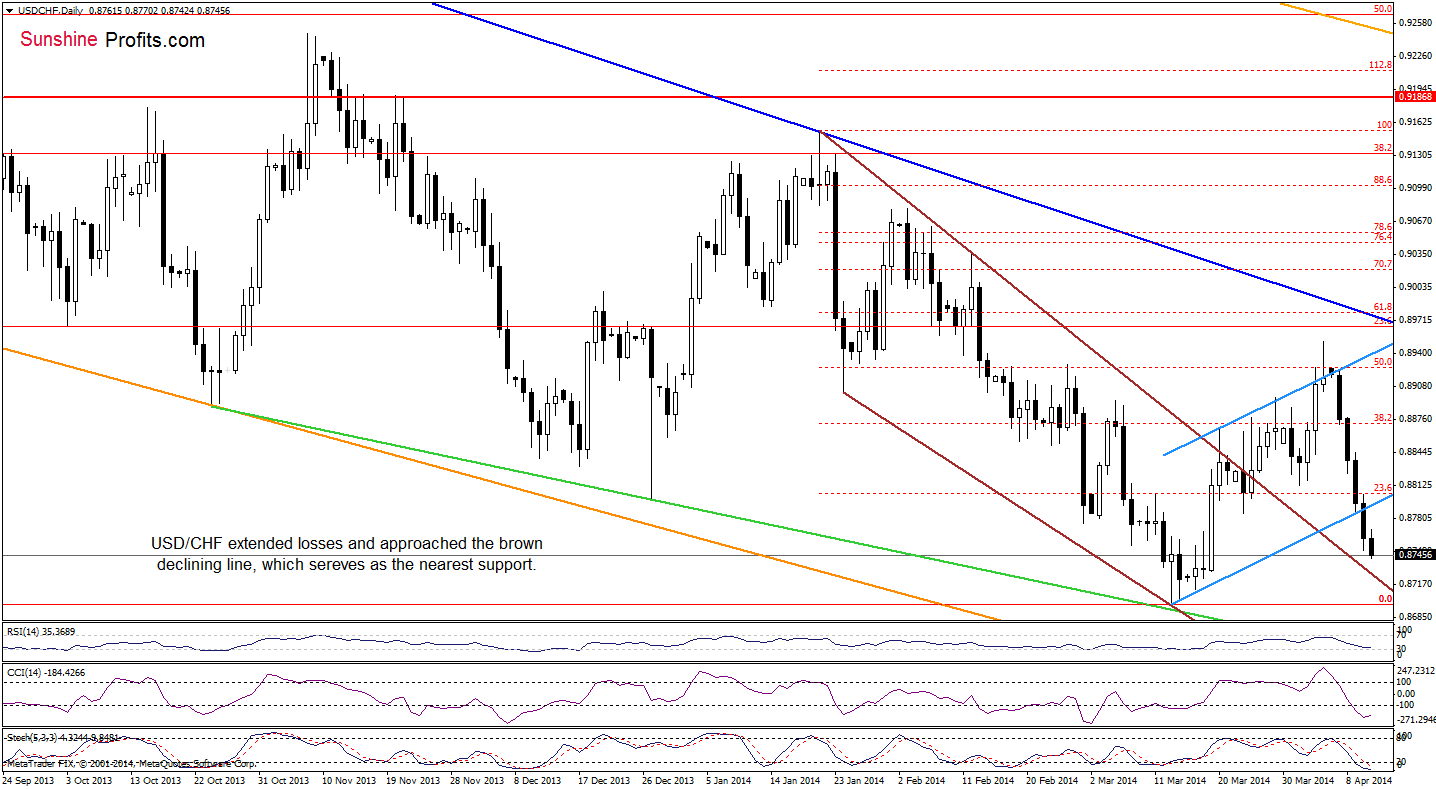
As you see on the above chart, USD/CHF extended declines below the lower border of the blue rising trend channel, which is a bearish signal that suggests further deterioration. Therefore, what we wrote yesterday is still up-to-date.
(…) In this case, the nearest support is the declining brown line (which is also the upper line of the declining trend channel). Taking into account the current position of the indicators (the RSI approached the level of 30, while the CCI and Stochastic Oscillator are oversold), it seems that this line may pause declines in the near future). However, if it is broken, we will see a test of the strength of the March low.
Very short-term outlook: bearish
Short-term outlook: bearish
MT outlook: bearish
LT outlook: bearish
Trading position (short-term): In our opinion no positions are justified from the risk/reward perspective. We will keep you informed should anything change, or should we see a confirmation/invalidation of the above.
AUD/USD
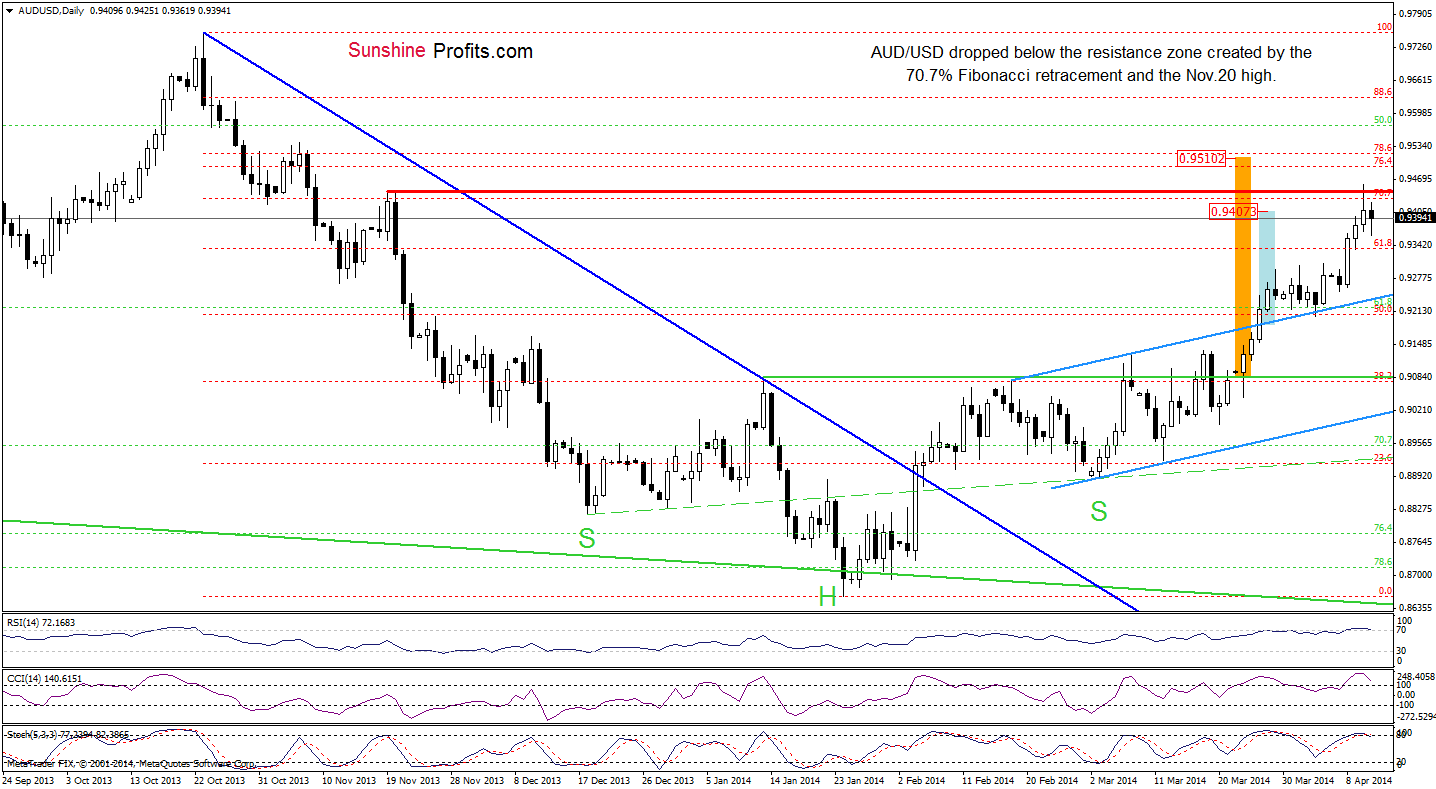
Quoting our last Forex Trading Alert:
(…) the buyers (…) pushed AUD/USD to the resistance zone created by the 70.7% Fibonacci retracement (based on the entire Oct.-Jan. decline). (…) if this resistance area holds, we may see a pullback in the coming days. In this case, the downside target for the sellers will be the previously-broken upper line of the trend channel.
Looking at the daily chart, we see that the exchange rate gave up the gains and declined below yesterday’s low. Taking into account the current position of the indicators (they are all overbought and very close to generating sell signals), it seems that we will see further deterioration and realization of the bearish scenario in the coming week.
Very short-term outlook: mixed with bearish bias
Short-term outlook: mixed with bearish bias
MT outlook: bearish
LT outlook: bearish
Trading position (short-term): In our opinion no positions are justified from the risk/reward perspective at the moment. We will keep you informed should anything change, or should we see a confirmation/invalidation of the above.
Thank you.
Nadia Simmons
Forex & Oil Trading Strategist
Przemyslaw Radomski, CFA
Founder, Editor-in-chief
Gold & Silver Trading Alerts
Forex Trading Alerts
Oil Investment Updates
Oil Trading Alerts

