
The U.S. currency moved higher after data showed that U.S. personal spending rose 0.3% in February (in line with expectations), while the core PCE price index remained unchanged at 0.1% last month (also in line with expectations). Despite these positive numbers, the greenback gave up some gains after the University of Michigan reported that its consumer sentiment index moved to 80.0 in March, while analysts had expected an increase to 80.5 this month. What impact did it have on major currency pairs? What is their current outlook? If you want to know our take on this question, we invite you to read our today's Forex Trading Alert.
In our opinion the following forex trading positions are justified - summary:
EUR/USD
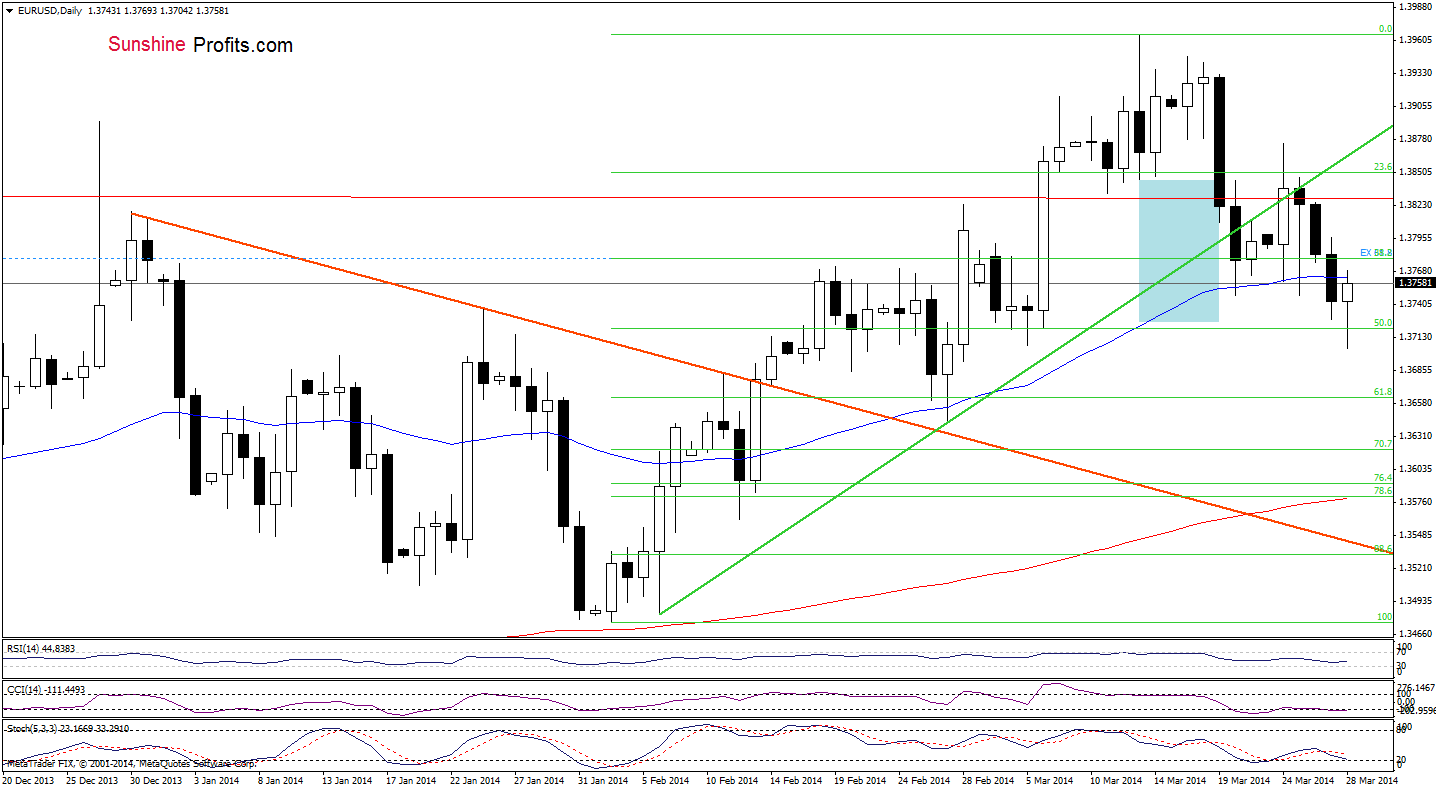
Although EUR/USD extended losses, broke below the 50% Fibonacci retracement and hit a fresh weekly low, the pair reversed and climbed to the previously broken 50-day moving average earlier today. If it holds, we will likely see a pullback to the 50% Fibonacci retracement. However, if this resistance is broken, we will likely see further improvement. Where the exchange rate could climb in the following hours? Let’s take a look at the 4-hour chart below.
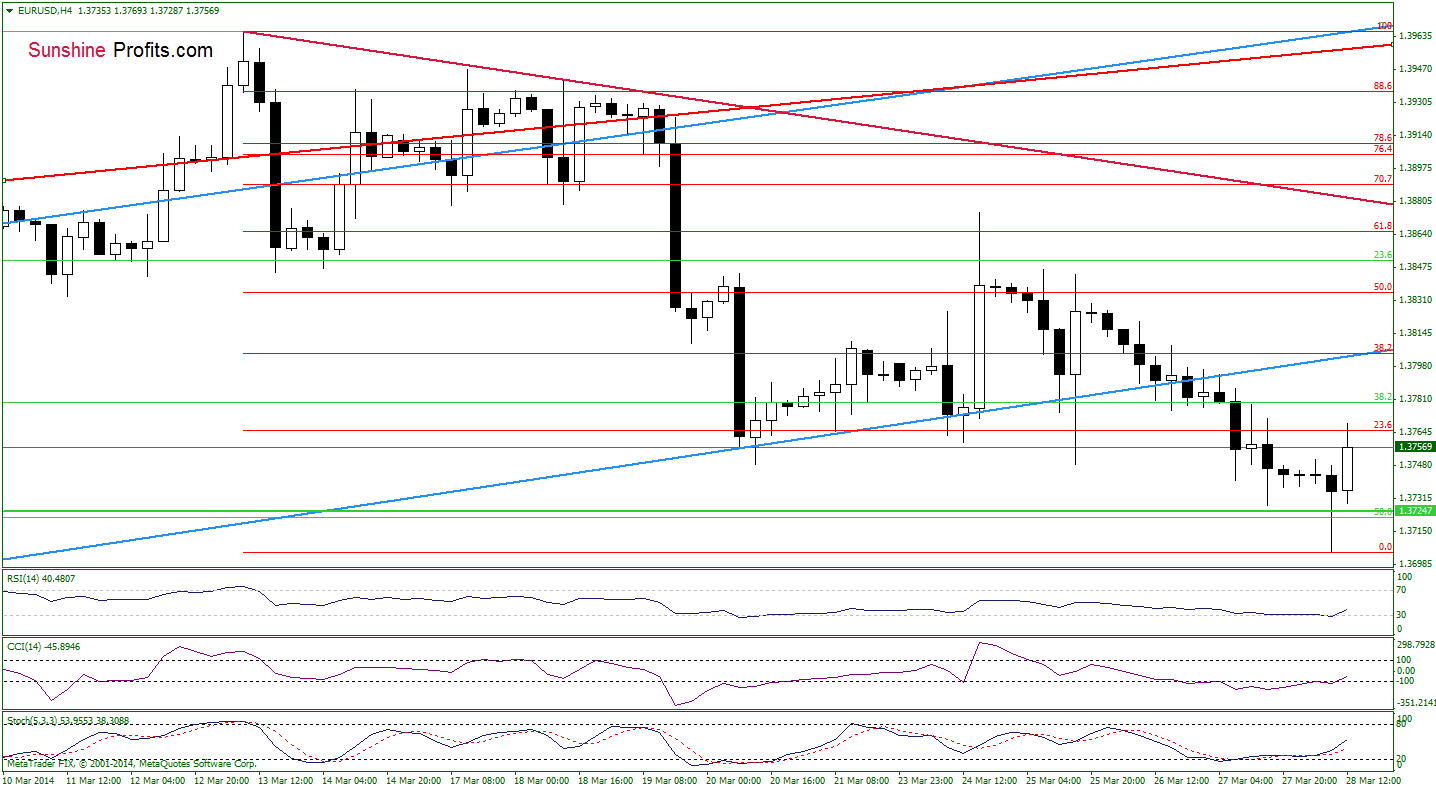
From this perspective, we see that the pair reached the 23.6% Fibonacci retracement based on the entire decline. If this resistance is broken, we will likely see an increase to the 38.2% Fibonacci retracement, which corresponds with the previously-broken lower border of the blue rising trend channel. Please note that all indicators generated buy signals, which suggests that further improvement is likely to be seen in the following hours.
Very short-term outlook: mixed
Short-term outlook: bearish
MT outlook: mixed
LT outlook: bearish
Trading position: In our opinion no positions are justified from the risk/reward perspective as the space for further increases/declines seems to be limited. We will keep you informed should anything change, or should we see a confirmation/invalidation of the above.
GBP/USD
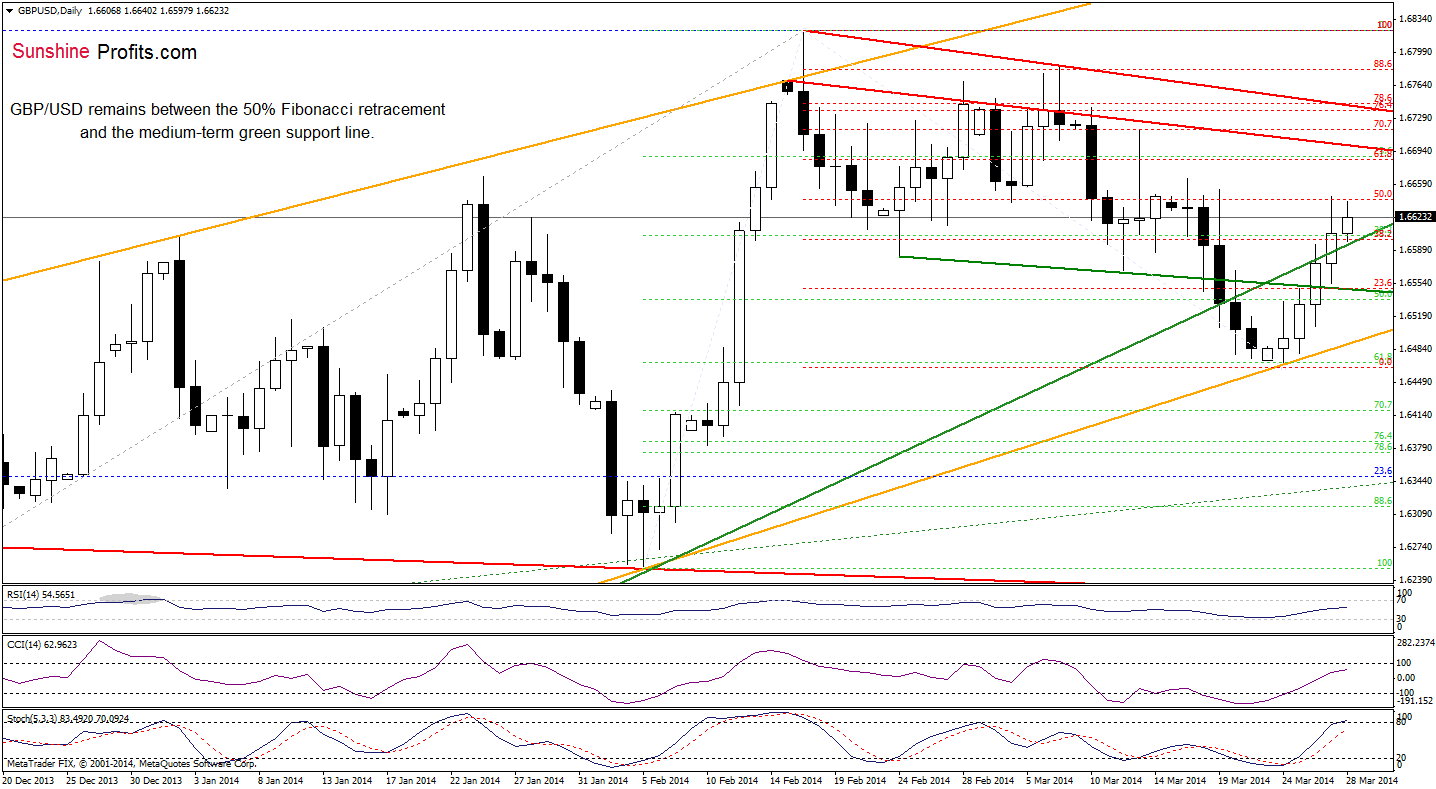
On the daily chart, we see that the situation hasn’t changed much as GBP/USD remains between the 50% Fibonacci retracement and the previously-broken medium-term green support line. From this perspective, it seems that as long as the exchange rate is trading below the resistance level we won’t see further improvement. Nevertheless, we should keep in mind that the current position of the indicators suggests that another upward move is likely to be seen as buy signals remain in place. Additionally, a bullish candlestick pattern (a three white soldiers) still supports buyers.
Very short-term outlook: mixed with bullish bias
Short-term outlook: mixed with bullish bias
MT outlook: mixed
LT outlook: mixed
Trading position (short-term): In our opinion no positions are justified from the risk/reward perspective at the moment. We will keep you informed should anything change, or should we see a confirmation/invalidation of the above.
USD/JPY
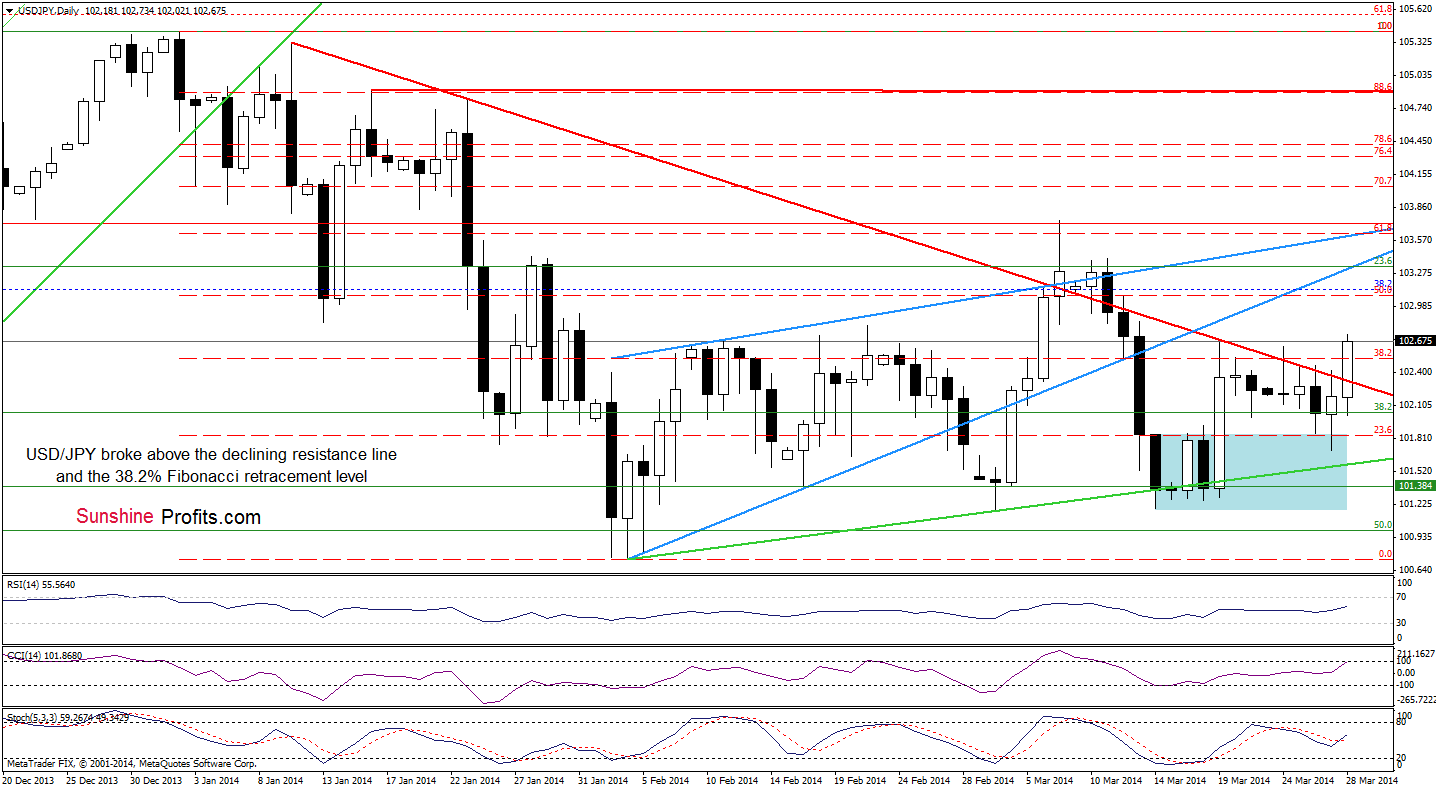
On the above chart, we see that USD/JPY broke above the red declining line earlier today. This positive event triggered further improvement and the exchange rate climbed above the 38.2% Fibonacci retracement, which is a bullish signal. Taking this fact into account and combining it with the current position of the indicators (they still have some space for further growth), it seems that we may see an increase to the next Fibonacci retracement level (around 103.07) in the near future. Please note that if this resistance is broken, the next upside target for the buyers will be a strong resistance zone created by the 61.8% Fibonacci retracement, the upper line of the blue rising wedge and the March 7 high.
Very short-term outlook: mixed with bullish bias
Short-term outlook: mixed
MT outlook: bullish
LT outlook: bearish
Trading position (short-term): In our opinion no positions are justified from the risk/reward perspective at the moment. We will keep you informed should anything change, or should we see a confirmation/invalidation of the above.
USD/CAD
Quoting our last Forex Trading Alert:
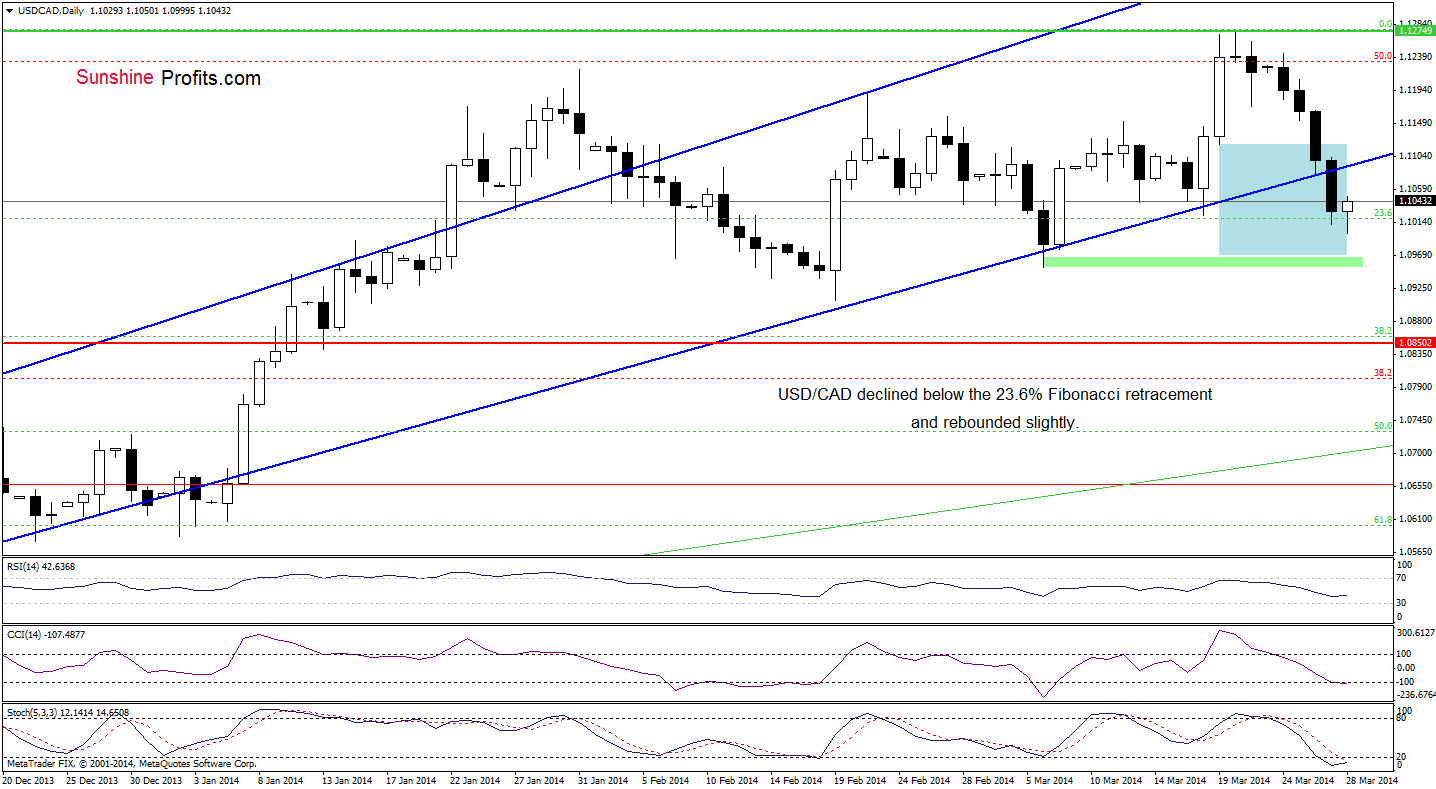
(…) the exchange rate almost touched the lower border of the rising trend channel. (…) if it is broken, we will likely see further deterioration and the first downside target will be the 23.6% Fibonacci retracement (around 1.1146), which corresponds to the March 18 low.
As you see on the above chart, the exchange rate declined and reached the 23.6% Fibonacci retracement yesterday. Although USD/CAD extended losses, the pair reversed and came back above this level earlier today. Looking at the current position of the indicators, we see that the CCI and Stochastic Oscillator are oversold and close to generating buy signals. If we see such action, the exchange rate will likely extend gains and the first upside target will be the previously-broken lower border of the rising trend channel (currently around 1.1091).
Before we summarize this currency pair, let’s take a look at the 4-hour chart.
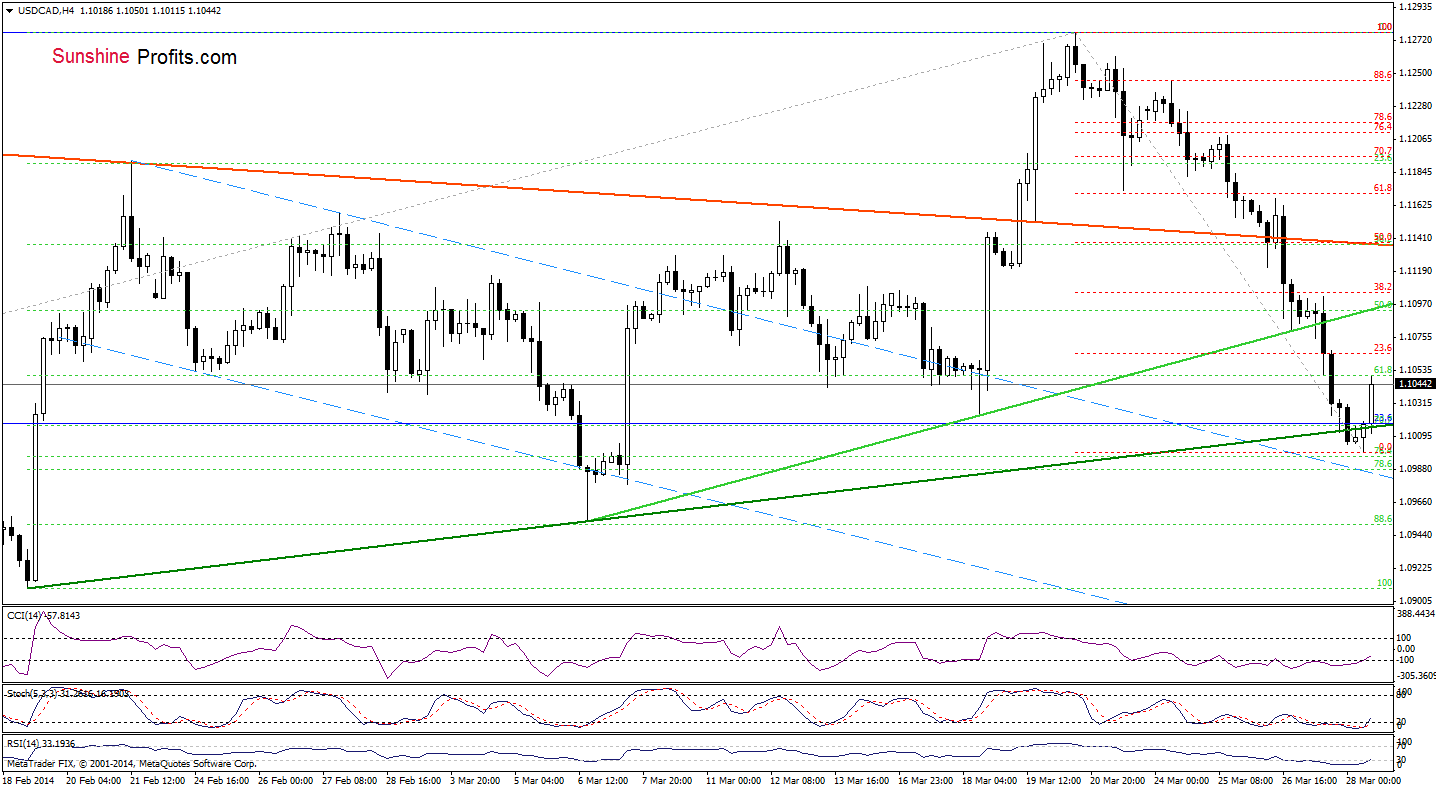
From this perspective, we see that USD/CAD reached the short-term rising support line based on the February 19 and March 6 lows, which reinforces the 23.6% Fibonacci retracement at the moment. As you see on the above chart, this strong support encouraged buyers to act and the pair rebounded. Please note that all indicators generated buy signals, which suggests further improvement in the following hours. If this is the case, the initial upside target will be the previously-broken rising line (marked with light green), which corresponds to the lower border of the trend channel marked on the daily chart.
Very short-term outlook: mixed with bullish bias
Short-term outlook: mixed
MT outlook: bullish
LT outlook: bearish
Trading position (short-term): In our opinion no positions are justified from the risk/reward perspective. We will keep you informed should anything change, or should we see a confirmation/invalidation of the above.
USD/CHF
In our last Forex Trading Alert, we wrote the following:
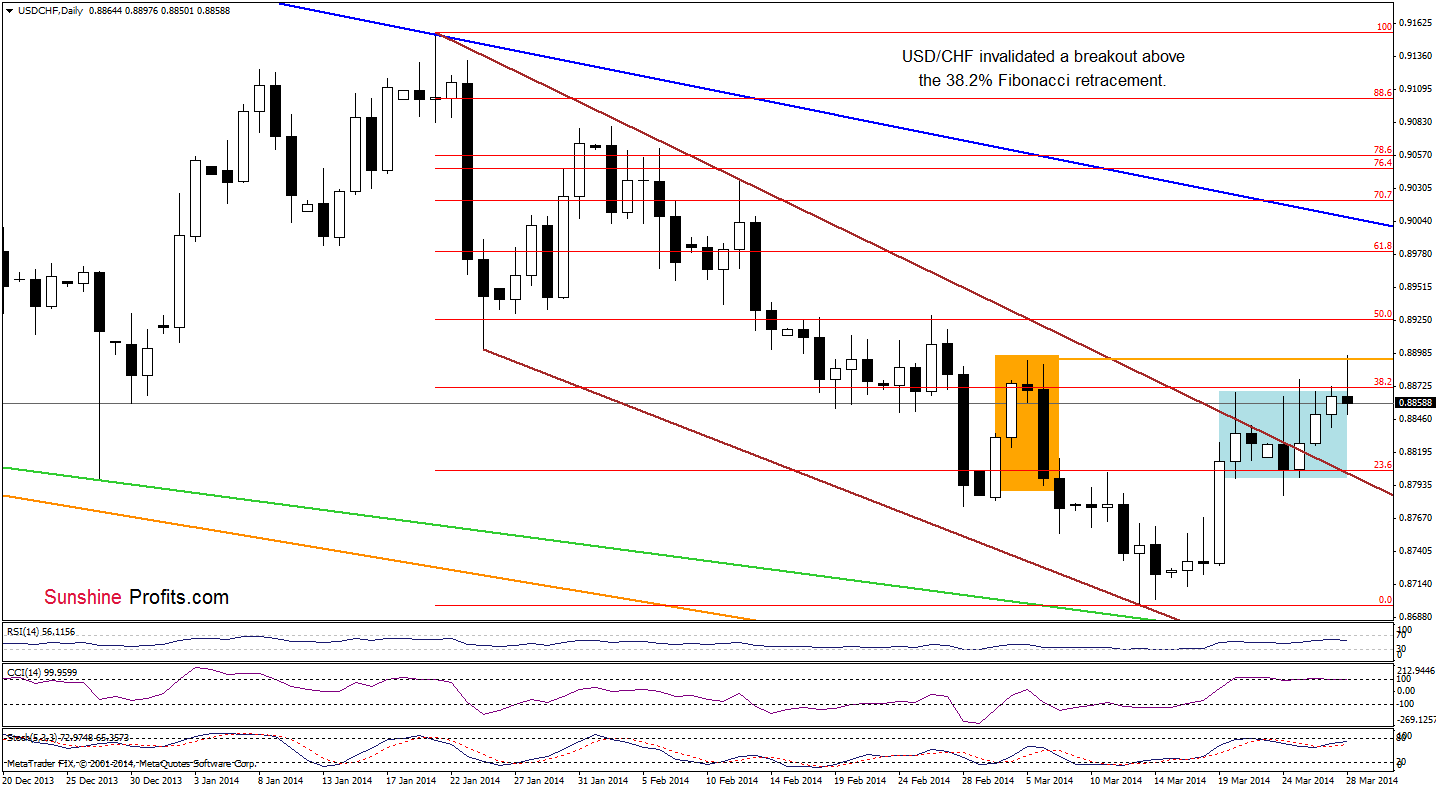
(…) if the buyers do not give up and break above the 38.2% Fibonacci retracement, we may see an increase to around 0.8890 (where the top of a bearish candlesticks pattern is).
Earlier today, we noticed such price action as USD/CHF extended gains. However, this improvement was only temporarily and the pair invalidated a breakout above the resistance level, which is a bearish signal. Therefore, if the buyers do not invalidate the bearish evening star 9marked with an orange rectangle), it will likely have a negative impact on the exchange rate in the near future. Is it possible that the 4-hour chart give us any interesting clues about future moves?
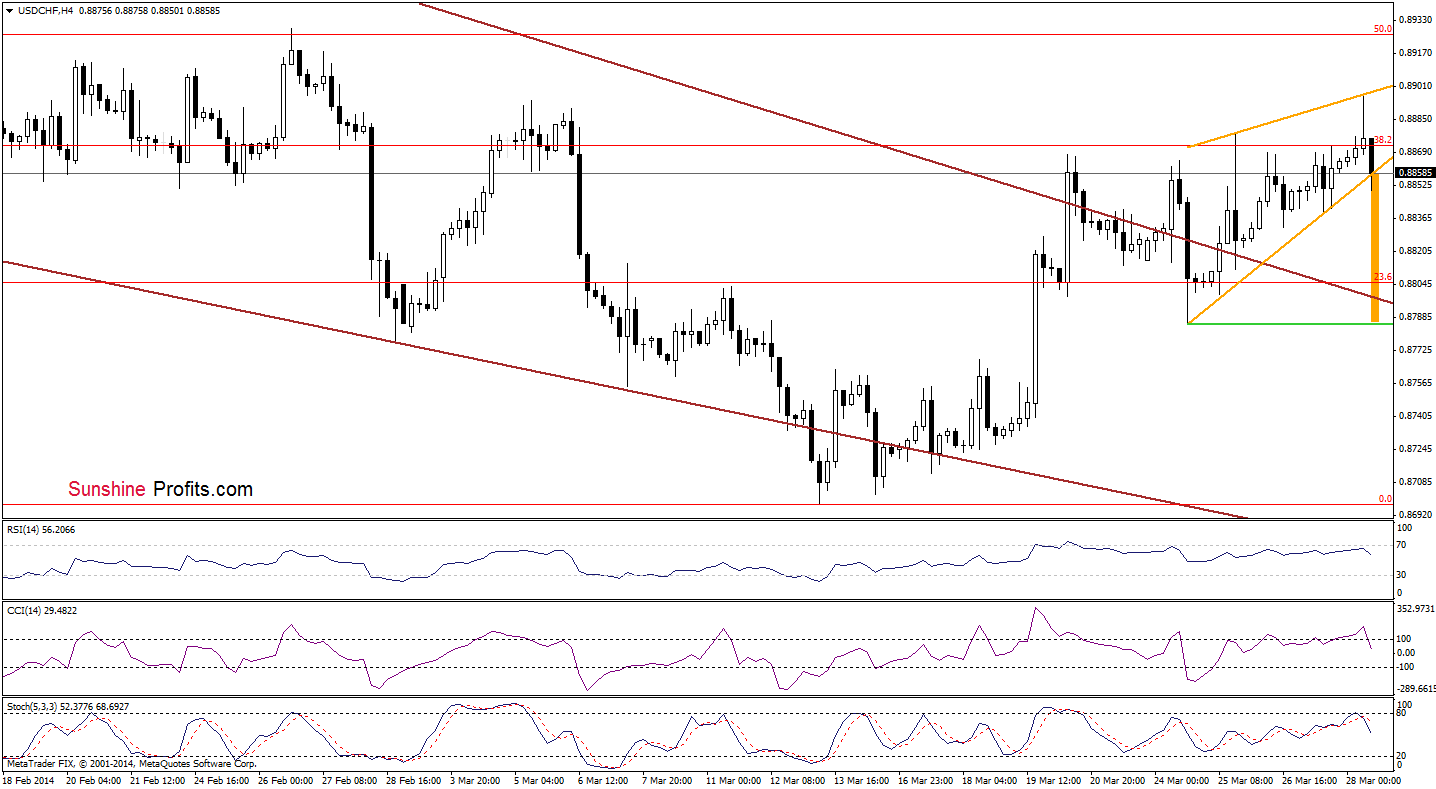
From this perspective, we see that the exchange rate has been trading in the rising wedge (marked with orange) recently. Earlier today, we saw the first attempt to break below the lower border of this formation, but the sellers failed. Despite this fact, it seems that we may see another try to move lower as the current position of the indicators (they all generated sell signals) favors a bearish scenario. Please note that if the orange support line is broken, we will likely see a correction and (according to theory) the downside target will be around the short-term brown declining line, which is currently slightly above the March 24 low.
Very short-term outlook: mixed with bearish bias
Short-term outlook: bearish
MT outlook: bearish
LT outlook: bearish
Trading position (short-term): In our opinion no positions are justified from the risk/reward perspective. We will keep you informed should anything change, or should we see a confirmation/invalidation of the above.
AUD/USD
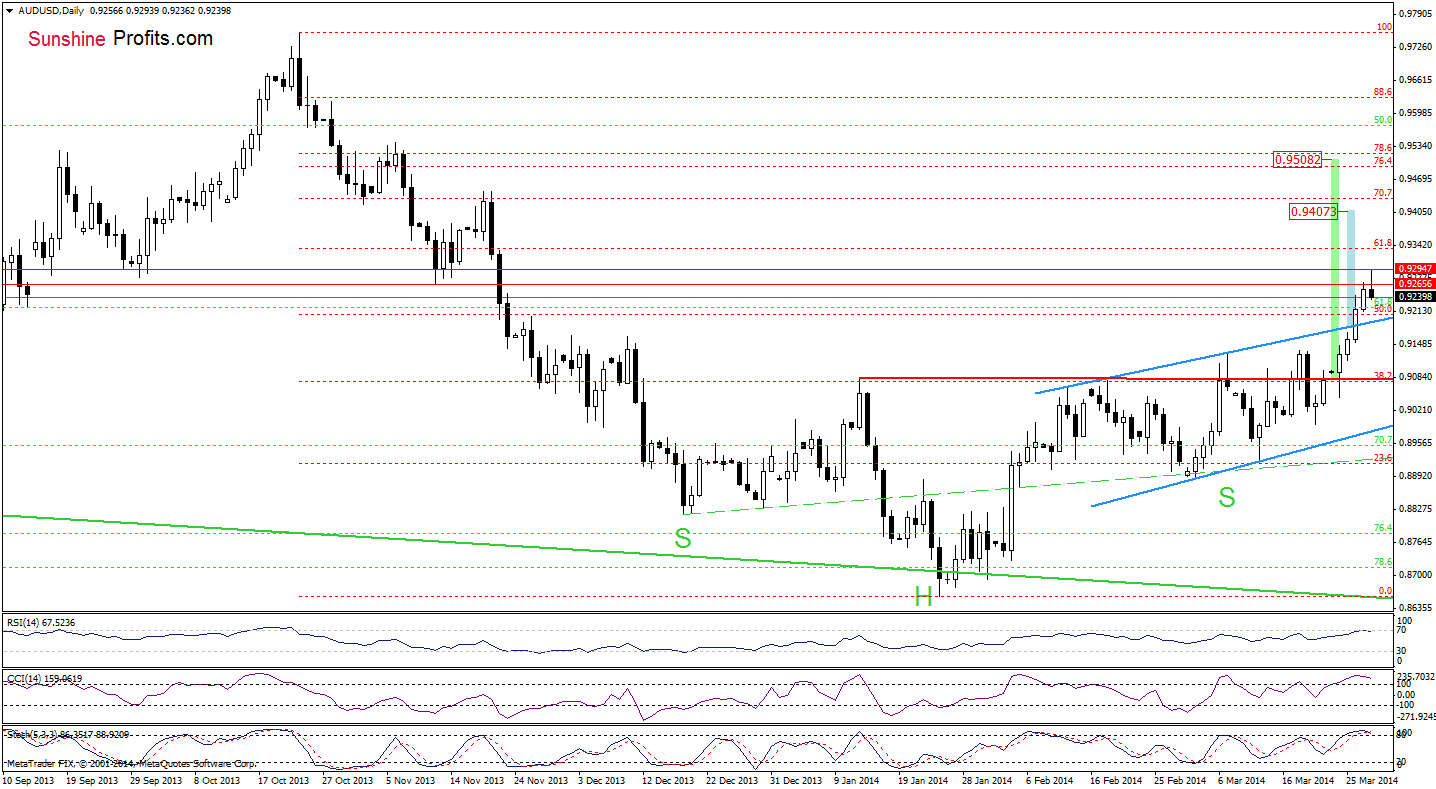
Looking at the above chart, we see that AUD/USD extended gains and hit a fresh 2014 high. With this upward move, the buyers pushed the exchange rate to a resistance zone created by lows from mid-November. If it holds, we may see a pullback in the coming day (or days) and the first downside target would be the previously-broken upper line of the trend channel. However, if it is broken, the next upside target will be the 61.8% Fibonacci retracement based on the entire decline. Please keep in mind that the indicators are overbought, which suggests that a pause should not surprise us.
Very short-term outlook: bullish
Short-term outlook: bullish
MT outlook: bearish
LT outlook: bearish
Trading position (short-term; our opinion): In our opinion no positions are justified from the risk/reward perspective at the moment. We will keep you informed should anything change, or should we see a confirmation/invalidation of the above.
Thank you.
Nadia Simmons
Forex & Oil Trading Strategist
Forex Trading Alerts
Oil Investment Updates
Oil Trading Alerts

