
Earlier today, the U.S. currency moved higher after the Conference Board showed that its index of consumer confidence climbed to 82.3 in March (the highest level since January 2008). Despite this positive data, the greenback reversed after the Commerce Department reported that new home sales fell by 3.3% in February to the weakest level since last September, suggesting continued weakness in the housing sector. What impact did it have on major currency pairs? What is their current outlook? If you want to know our take on this question, we invite you to read our today's Forex Trading Alert.
In our opinion the following forex trading positions are justified - summary:
- EUR/USD: none
- GBP/USD: none
- USD/JPY: none
- USD/CAD: none
- USD/CHF: none
- AUD/USD: short (stop-loss order: 0.9166 and the price target: 0.8955)
EUR/USD
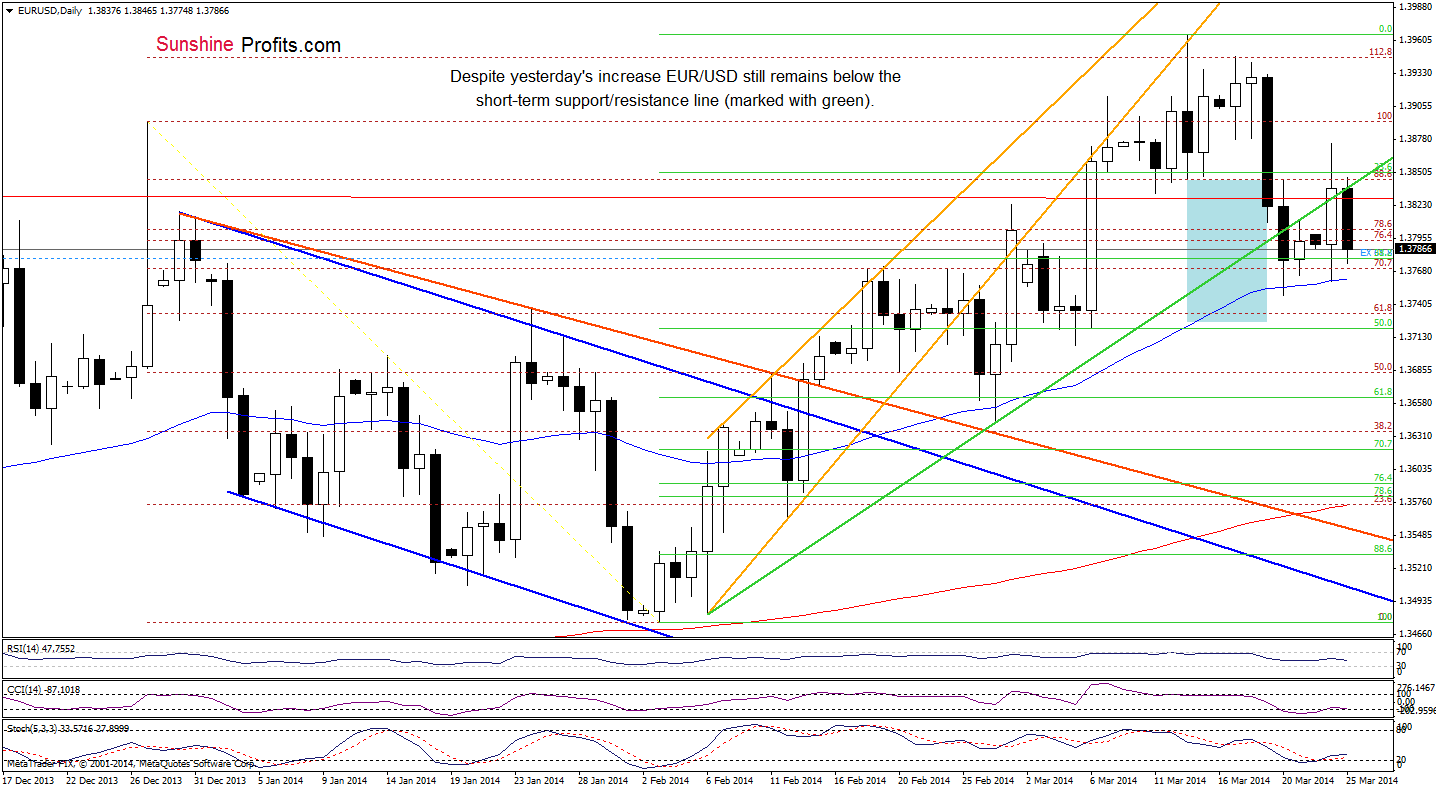
Yesterday, after a drop to the 50-day moving average EUR/USD rebounded sharply and climbed above the previously-broken short-term green rising line. Despite this increase, the exchange rate gave up the gains in the following hours and slipped to slightly above the rising support line. Earlier today, the buyers didn't manage to hold the pair above this line, which resulted in a decline and the exchange rate approached the 50-day moving average once again. If history repeats itself once again, we may see a corrective upswing in the following hours. However, if EUR/USD extends losses and broke below this support, we will likely see a drop to the 50% Fibonacci retracement.
Before we summarize this currency pair, let’s take a look at the 4-hour chart.
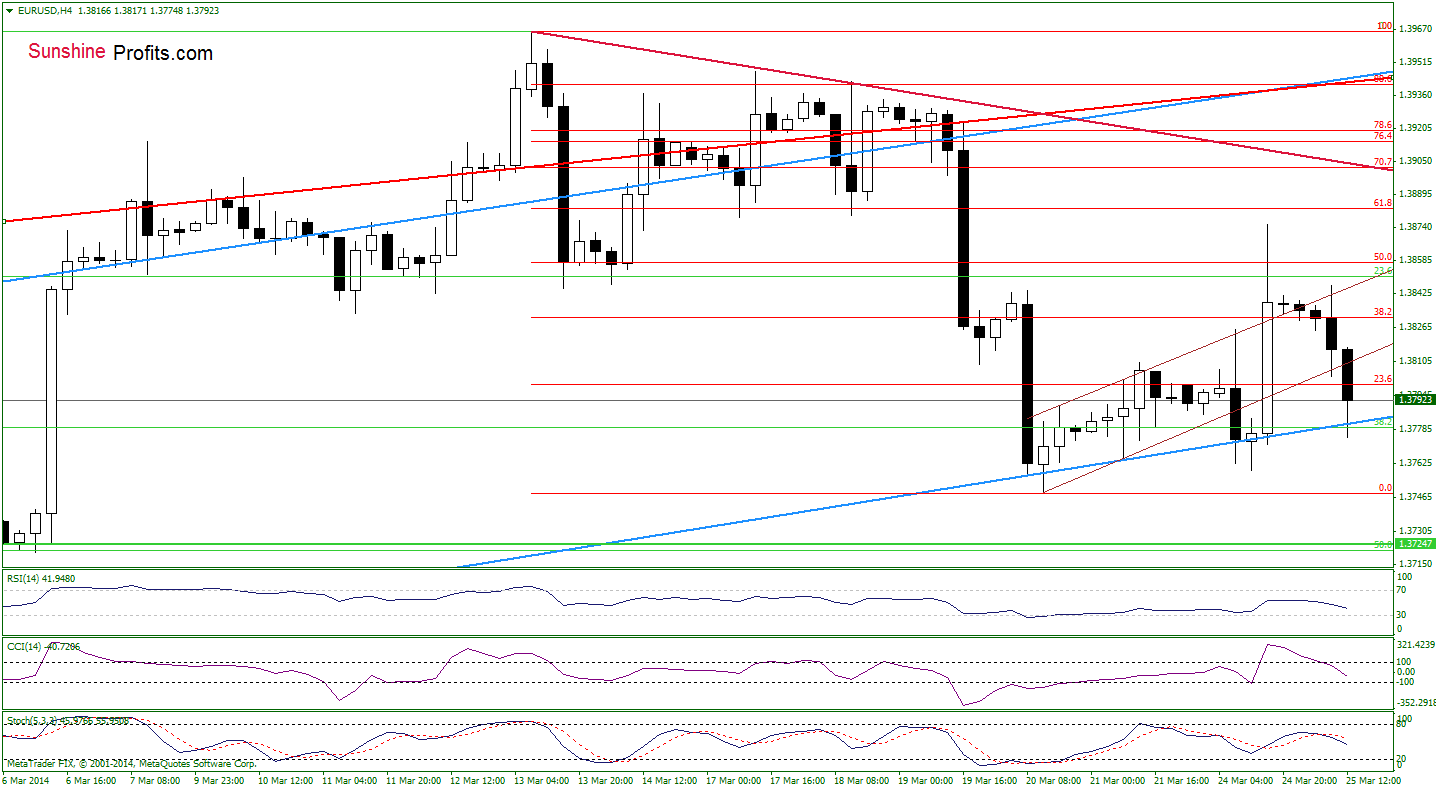
Earlier today, the pair declined below the lower border of the rising trend channel (marked with brown) once again. Despite this drop, the lower border of the blue rising trend channel stopped further deterioration (at least at the moment when these words are written). On one hand, if this support encourages buyers to act (just like yesterday), we may see an increase to the previously-broken lower line of the brown trend channel. If it is broken, we will likely see further improvement and the next upside target will be the upper line of this formation (which corresponds to the 38.2% Fibonacci retracement at the moment). On the other hand, if the pair extends losses, we may see a drop to the Thursday’s low or even to the 50% Fibonacci retracement.
Very short-term outlook: mixed with bearish bias
Short-term outlook: bearish
MT outlook: mixed
LT outlook: bearish
Trading position (our opinion): If the exchange rate declines below the Thursday’s low (1.3748), we will consider to re-enter short position. We will keep you informed should anything change, or should we see a confirmation/invalidation of the above.
GBP/USD
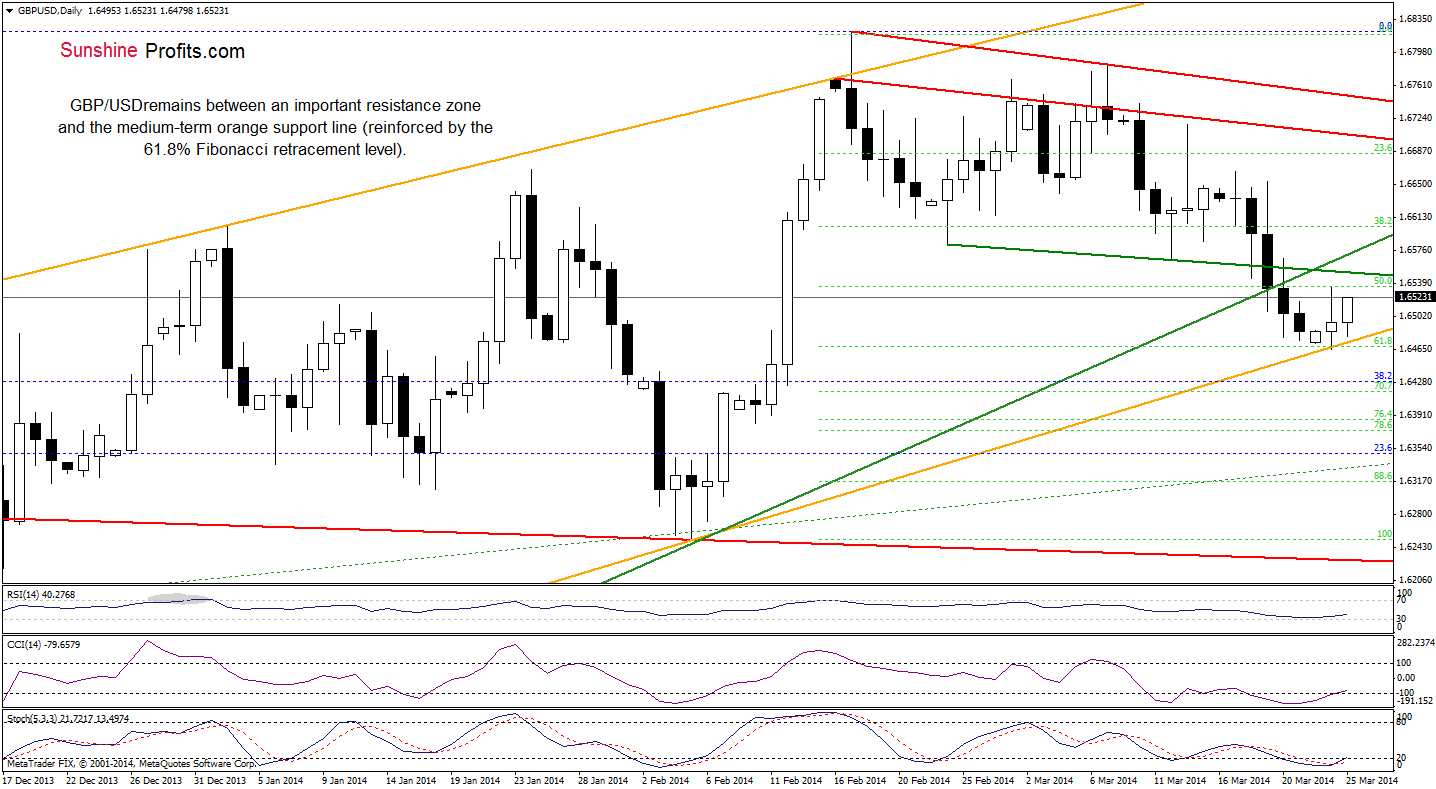
Looking at the daily chart, we see that the situation hasn’t changed much as GBP/USD still remains between an important support zone (created by the 61.8% Fibonacci retracement based on the recent rally and the lower border of the orange rising trend channel) and an important resistance zone (created by the green support line based on recent lows and the medium-term rising support line based on the July and February lows). However, the current position of the indicators suggests that further improvement is just around the corner (the CCI and Stochastic Oscillator generated buy signals).
Very short-term outlook: mixed
Short-term outlook: mixed
MT outlook: mixed
LT outlook: mixed
Trading position (short-term): In our opinion no positions are justified from the risk/reward perspective at the moment. However, if the pair drops below the lower border of the rising trend channel, we consider opening short positions. On the other hand, if the exchange rate climbs above the resistance zone, we consider opening long positions. We will keep you informed should anything change, or should we see a confirmation/invalidation of the above.
USD/JPY
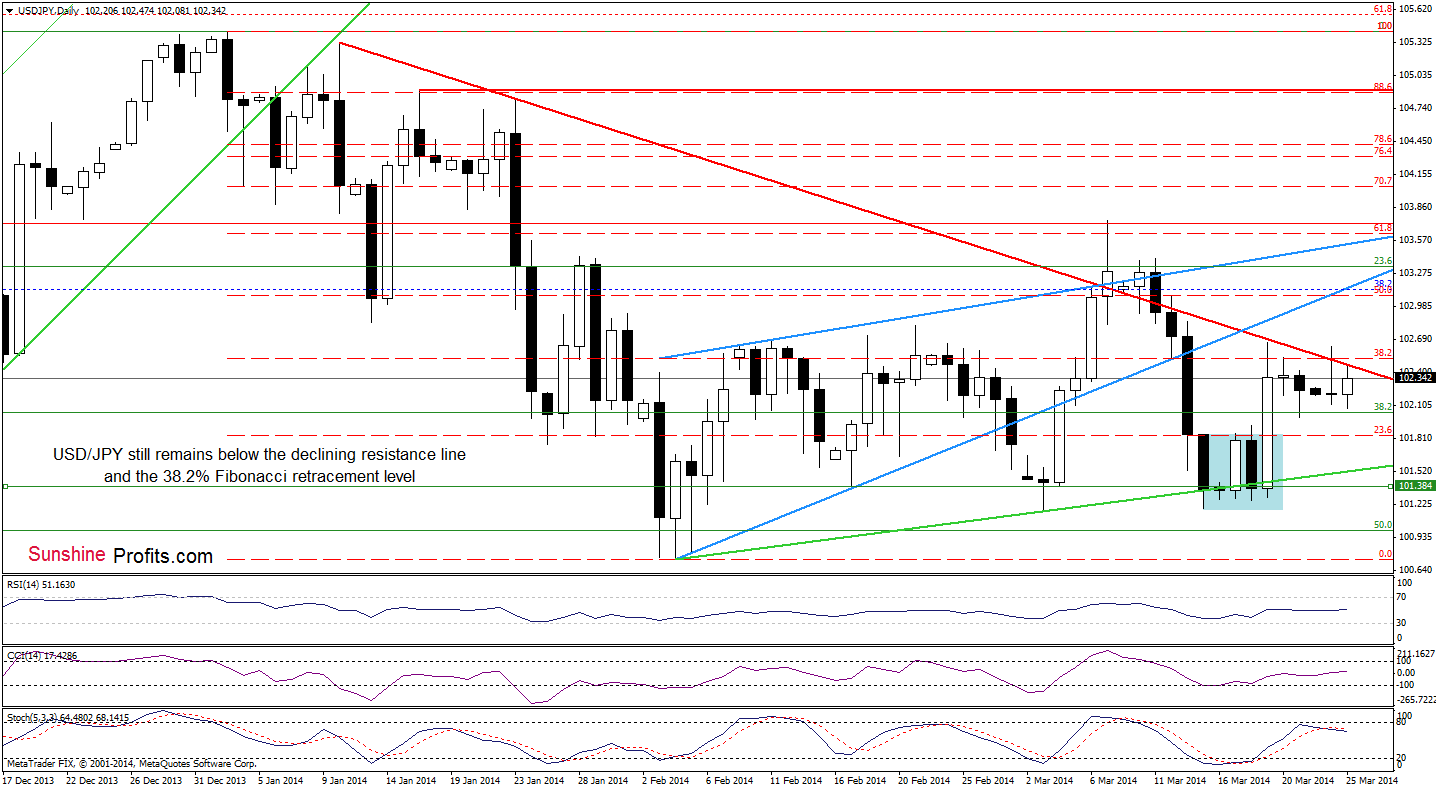
On the above chart, we see that the situation hasn’t changed much as USD/JPY still remains in a consolidation between a strong resistance zone (created by the 38.2% Fibonacci retracement and the red declining resistance line) and the March 21 low. Similarly to what we saw in the recent days, the resistance zone stopped further improvement earlier today. If it encourages sellers to act, we may see a drop to the Friday low. If the pair drops below this support level, we will likely see a decline to around 101.85 (where the previously-broken upper line of the consolidation is). Please keep in mind that as long as the exchange rate remains below the resistance zone, a bigger upswing is not likely to be seen.
Very short-term outlook: mixed
Short-term outlook: mixed
MT outlook: bullish
LT outlook: bearish
Trading position (short-term): In our opinion no positions are justified from the risk/reward perspective at the moment. However, if the pair successfully breaks above the resistance zone, we will consider opening long positions. We will keep you informed should anything change, or should we see a confirmation/invalidation of the above.
USD/CAD
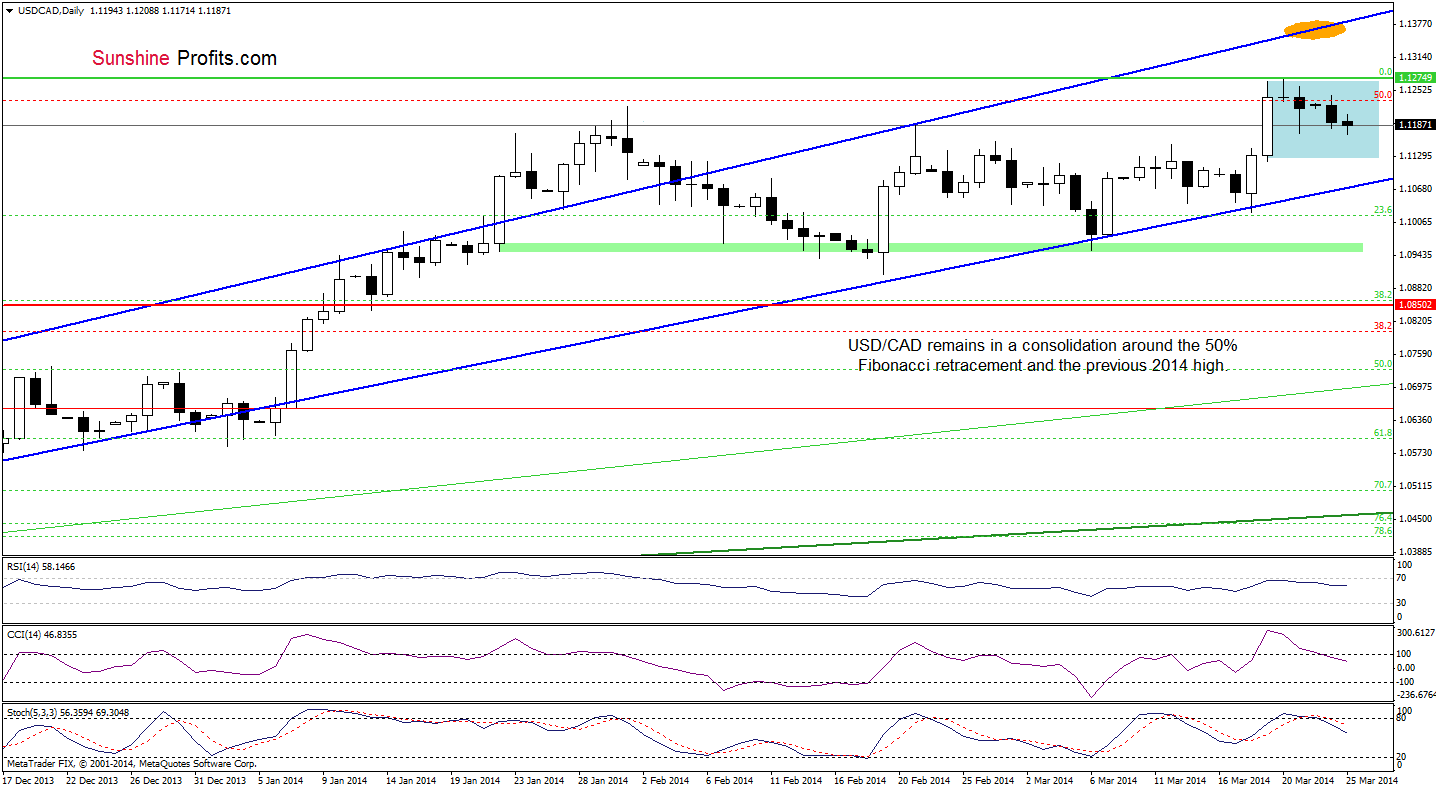
On the above chart, we see that USD/CAD extended losses and dropped to the Friday low earlier today. If this support level encourages buyers to act, we may see a corrective upswing in the near future. However, looking at the current position of the indicators (they all generated sell signals), it seems that a bearish scenario is more likely to be seen. Please note that if the exchange rate drops below the March 19 low, we will likely see a pullback to the lower border of the rising trend channel in the coming day (or days).
Very short-term outlook: mixed with bearish bias
Short-term outlook: bullish
MT outlook: bullish
LT outlook: bearish
Trading position (short-term): In our opinion, the situation is not bearish enough to go short, so opening positions at the moment is not a good idea from the risk/reward perspective. We will keep you informed should anything change, or should we see a confirmation/invalidation of the above.
USD/CHF
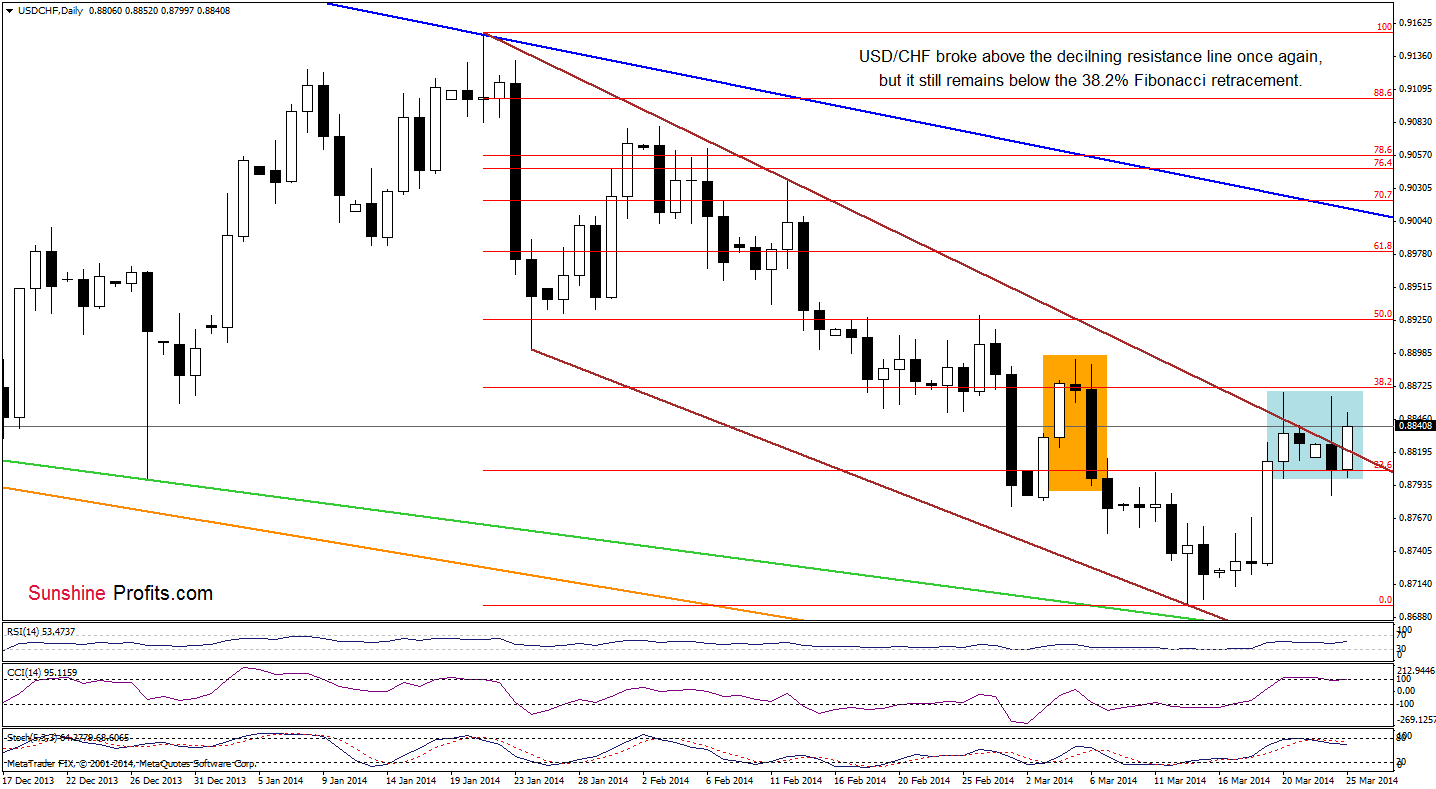
Looking at the above chart, we see that the situation has improved as USD/CHF broke above the upper line of the declining wedge/trend channel (marked with brown) once again. Despite this bullish signal, the exchange rate still remains below the 38.2% Fibonacci retracement level (based on the recent decline), which successfully stopped further improvement on Thursday (and also yesterday). Therefore, if history repeats itself once again, we may see an invalidation of a breakout in the following hours. Please note that this bearish scenario is currently reinforced by the position of the indicators (the CCI and Stochastic Oscillator generated sell signals), which suggests that a pullback is just around the corner. Nevertheless, if the buyers do not give up and break above the 38.2% Fibonacci retracement, we may see an increase to around 0.8890 (where the top of a bearish candlesticks pattern is).
Very short-term outlook: mixed
Short-term outlook: bearish
MT outlook: bearish
LT outlook: bearish
Trading position (short-term): In our opinion, the situation is not enough bullish to go long at the moment. We will keep you informed should anything change, or should we see a confirmation/invalidation of the above.
AUD/USD
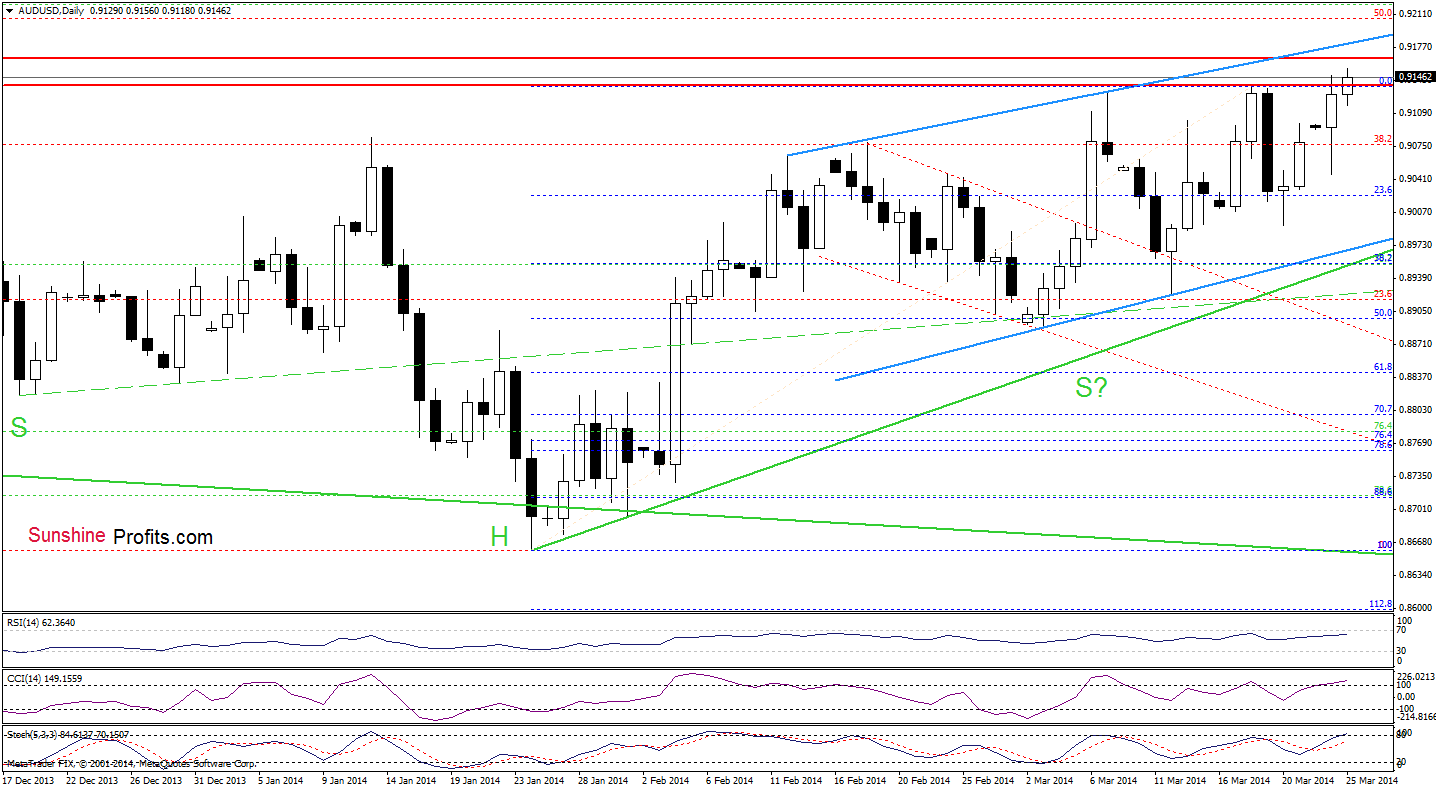
Looking at the above chart, we see that AUD/USD extended gains and hit a fresh 2014 high. Despite this increase, the buyers didn’t manage to push the exchange rate above a resistance zone (between 0.9151 and 0.9165), which successfully stopped further improvement earlier this month. From this perspective, it seems that as long as the pair remains below this resistance (and also below the upper line of the blue rising trend channel, another attempt to move lower can’t be ruled out.
Very short-term outlook: mixed
Short-term outlook: bullish
MT outlook: bearish
LT outlook: bearish
Trading position (short-term; our opinion): Short. Stop-loss order: 0.9166 and the initial price target: 0.8955. We will keep you informed should anything change, or should we see a confirmation/invalidation of the above.
Thank you.
Nadia Simmons
Forex & Oil Trading Strategist
Forex Trading Alerts
Oil Investment Updates
Oil Trading Alerts

