
Earlier today, the greenback moved higher against the euro after data showed that the preliminary reading of Germany’s manufacturing PMI dropped to a four-month low of 53.8 in March (below forecasts of 54.6). What happened with other currency pairs? What is their current outlook? If you want to know our take on this question, we invite you to read our today's Forex Trading Alert.
In our opinion the following forex trading positions are justified - summary:
- EUR/USD: none
- GBP/USD: none
- USD/JPY: none
- USD/CAD: none
- USD/CHF: none
- AUD/USD: short (stop-loss order: 0.9166 and the initial price target: 0.8955
EUR/USD
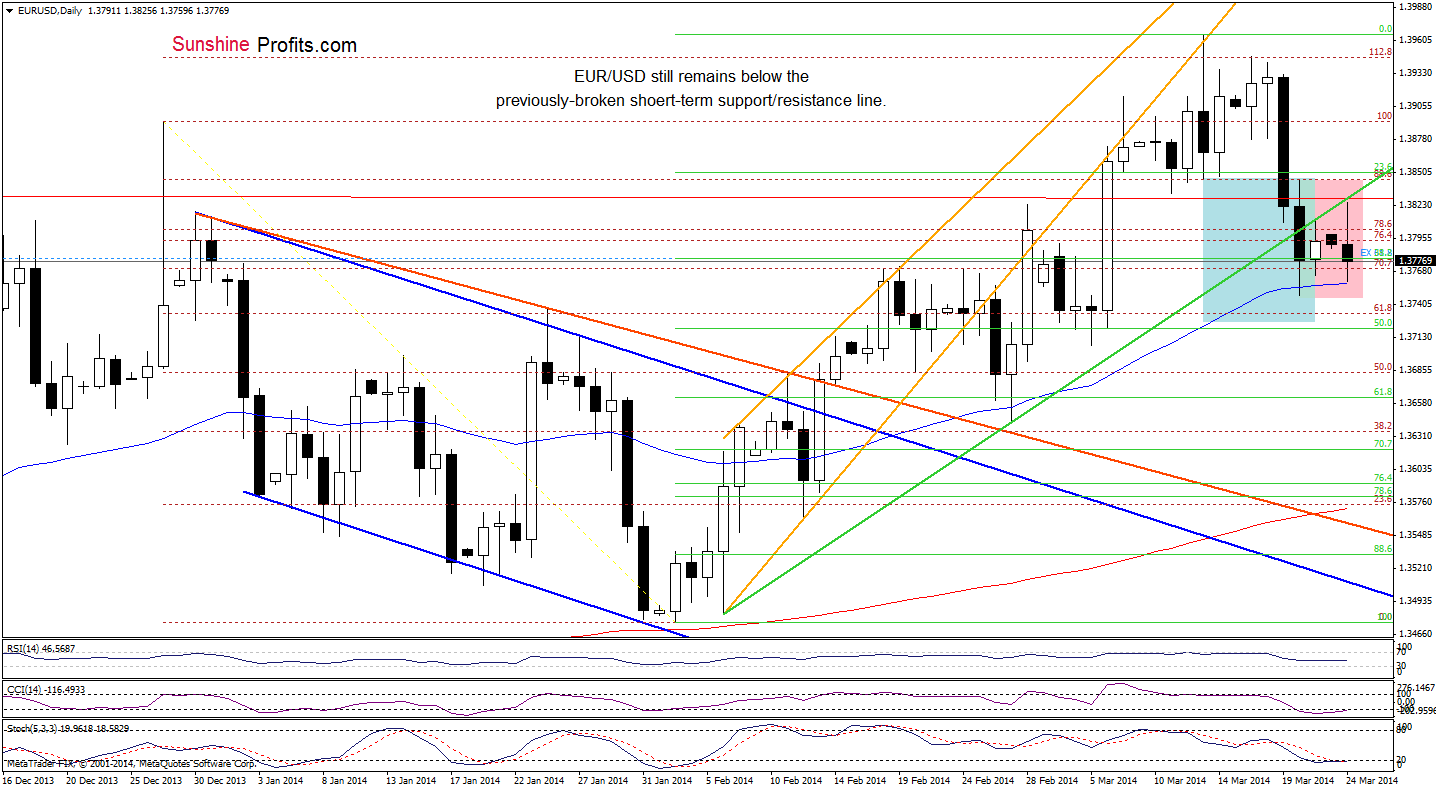
Looking at the daily chart, we see that EUR/USD remains in a consolidation between Thursday’s high and low. Earlier today, the exchange rate extended gains, but the previously-broken short-term green support line (which serves as resistance at the moment) stopped further improvement and the pair reversed. From this perspective, it seems that this upswing was nothing more than a verification of the breakdown (especially when we take into account the decline that we saw in the following hours). As you see on the above chart, with today’s downswing, EUR/USD declined to the 50-day moving average. Similarly to what we saw on Thursday, this support encouraged buyers to act and resulted in a small corrective upswing. Despite this move, it seems that as long as the exchange rate remains below the short-term green resistance line, another attempt to move lower can’t be ruled out. Please note that if the pair declines below the Thursday low, the first downside for the sellers will be around 1.3725 (slightly above the 50% Fibonacci retracement level).
Before we summarize this currency pair, let’s take a look at the 4-hour chart.
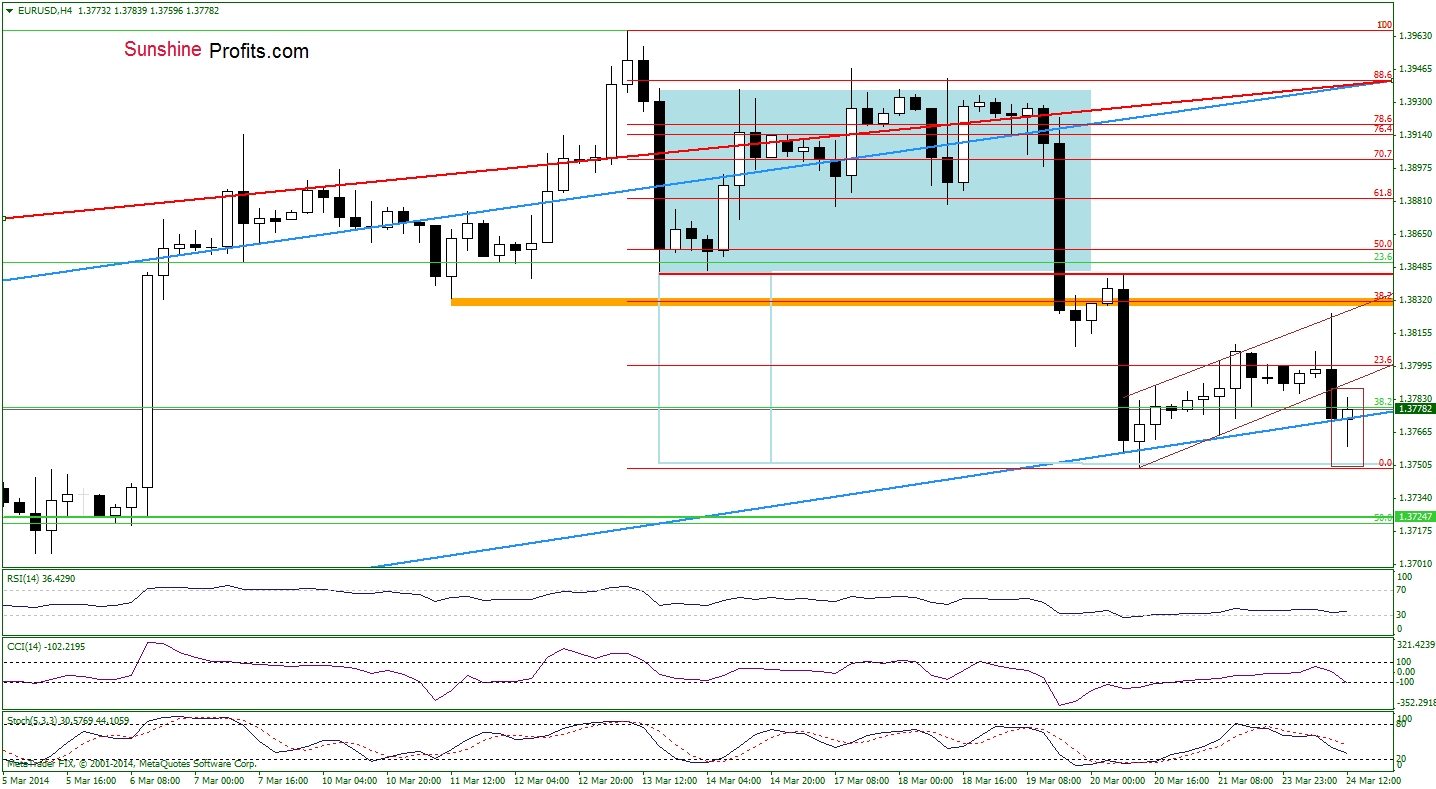
From this perspective, we see that the pair declined below the lower border of the rising trend channel (marked with brown), which is a bearish signal. Despite this drop, the lower border of the blue rising trend channel stopped further deterioration. On one hand, if this support encourages buyers to act, we may see an increase to the previously-broken lower line of the brown trend channel. If it is broken, we will likely see further improvement and the next upside target will be the upper line of this formation (and the 38.2% Fibonacci retracement). On the other hand, if the pair extends losses, we may see a drop to the Thursday’s low or even to the 50% Fibonacci retracement.
Very short-term outlook: mixed
Short-term outlook: bearish
MT outlook: mixed
LT outlook: bearish
Trading position (our opinion): If the exchange rate declines below the Thursday’s low (1.3748), we will consider to re-enter short position. We will keep you informed should anything change, or should we see a confirmation/invalidation of the above.
GBP/USD
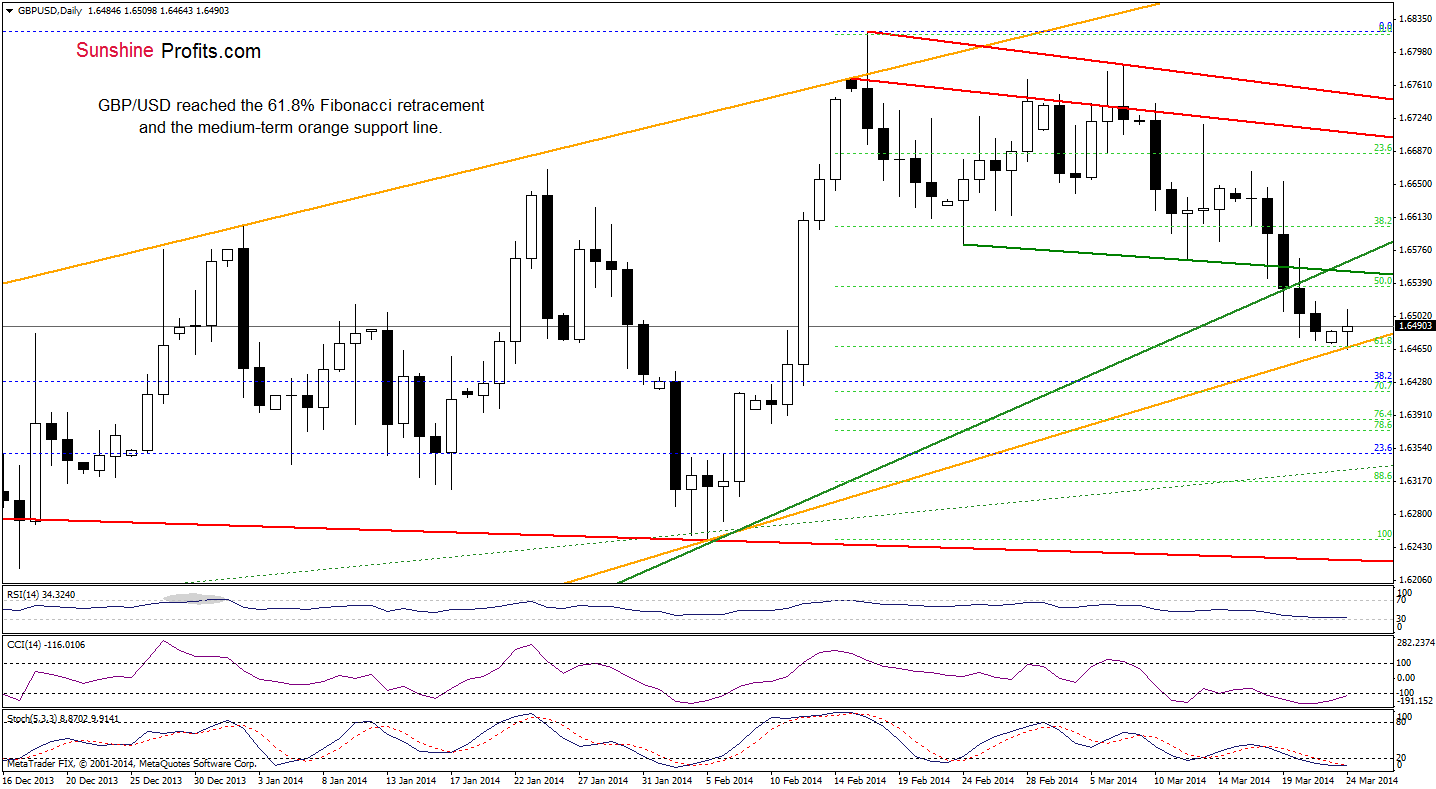
Looking at the daily chart, we see that GBP/USD extended losses and dropped to an important support zone created by the 61.8% Fibonacci retracement (based on the recent rally) and the lower border of the orange rising trend channel. On one hand, if this strong support encourages buyers to act, we will likely see a corrective upswing in the coming day (or days). If this is the case, the first upside target will be an important resistance zone created by the green support line based on recent lows and the medium-term rising support line based on the July and February lows. On the other hand, if this area is broken, we may see further deterioration to the next Fibonacci retracement. However, taking into account the current position of the indicators, it seems that a pro growth scenario is more likely.
Very short-term outlook: mixed
Short-term outlook: mixed
MT outlook: mixed
LT outlook: mixed
Trading position (short-term): In our opinion no positions are justified from the risk/reward perspective at the moment. However, if the pair drops below the lower border of the rising trend channel, we consider opening short positions. We will keep you informed should anything change, or should we see a confirmation/invalidation of the above.
USD/JPY
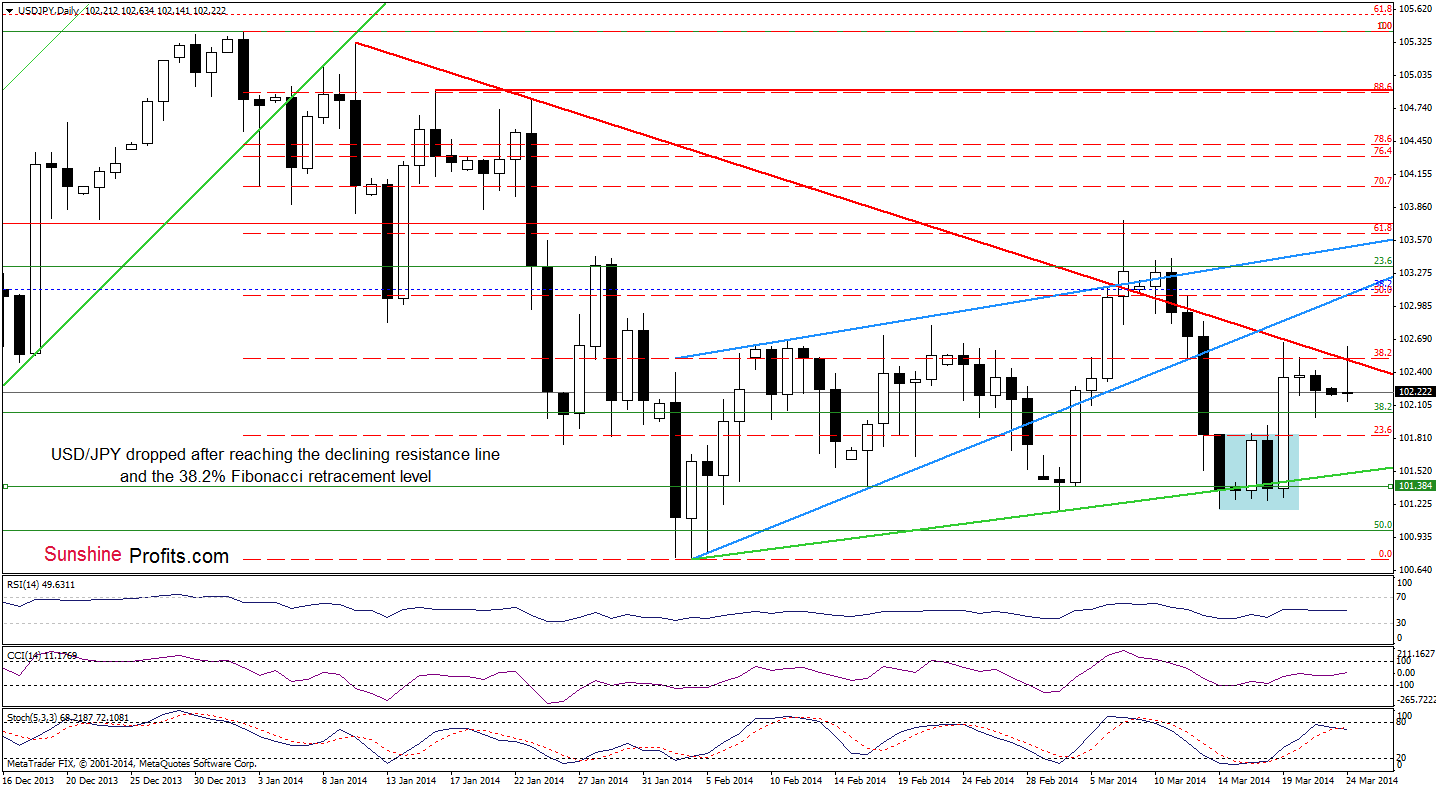
On the above chart, we see that although the buyers tried to push USD/JPY higher earlier today, a strong resistance zone created by the 38.2% Fibonacci retracement and the red declining resistance line stopped further improvement and encouraged sellers to act. As you see on the daily chart, the first downside target is the Friday low. If the pair drops below this level, we will likely see a decline to around 101.85 (where the previously-broken upper line of the consolidation is). Please keep in mind that from this perspective, it seems that as long as the exchange rate remains below the resistance zone, a bigger upswing is not likely to be seen.
Very short-term outlook: mixed
Short-term outlook: mixed
MT outlook: bullish
LT outlook: bearish
Trading position (short-term): In our opinion no positions are justified from the risk/reward perspective at the moment. However, if the pair successfully breaks above the resistance zone, we will consider opening long positions. We will keep you informed should anything change, or should we see a confirmation/invalidation of the above.
USD/CAD
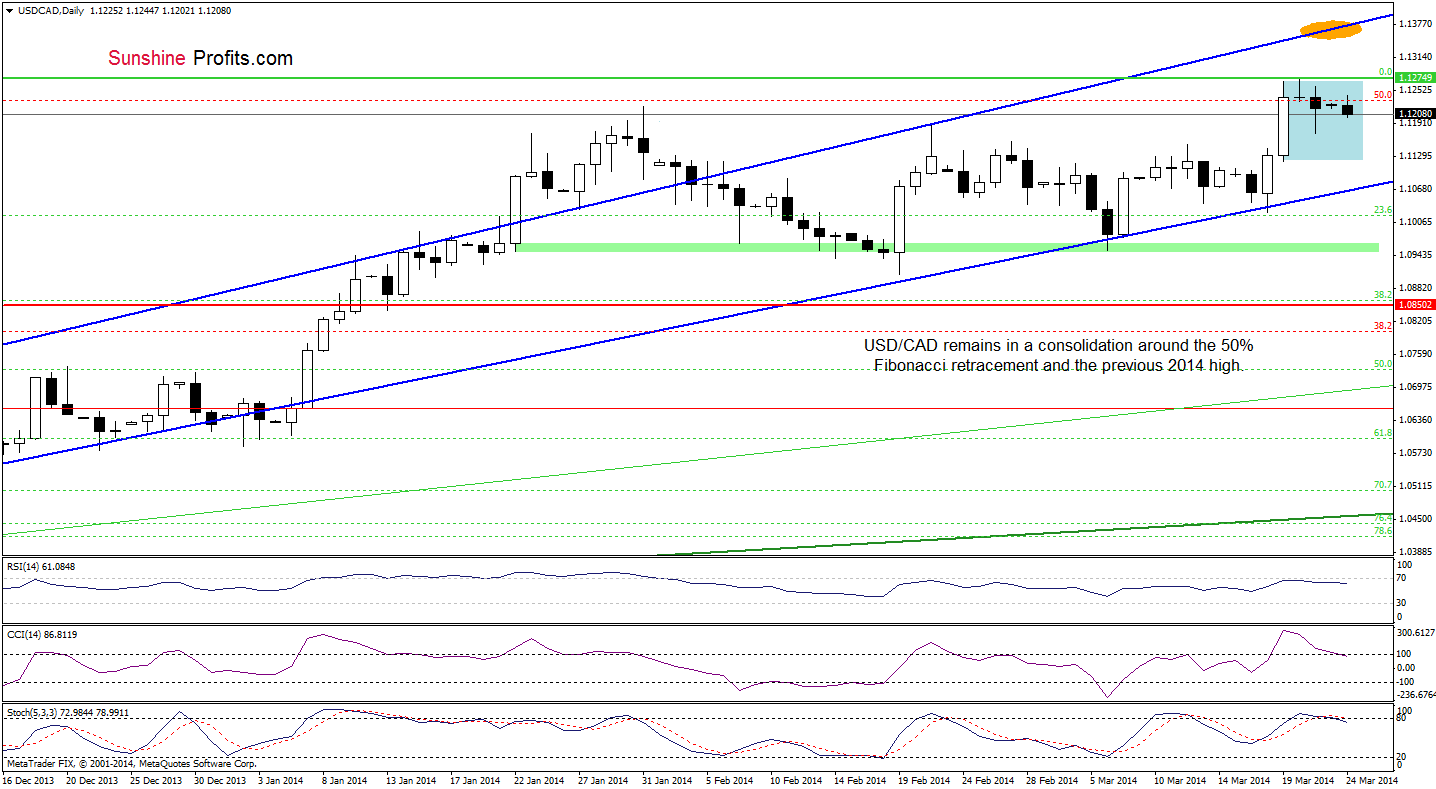
Looking at the above chart, we see that the situation hasn’t changed much as USD/CAD still remains in a consolidation around the previous 2014 high and the 50% Fibonacci retracement level. Taking this fact into account, what we wrote in our last Forex Trading Alert is still up-to date.
(…) we should consider two scenarios. If the exchange rate climbs above yesterday’s high, we may see an increase to the next upside target - the upper line of the rising trend channel. On the other hand, if USD/CAD declines below Wednesday low, we may a drop to the lower border of the rising trend channel.
Please note that the CCI and Stochastic Oscillator generated sell signals, which suggests that we may see a pullback (and the bearish scenario) in the coming day (or days).
Very short-term outlook: mixed
Short-term outlook: bullish
MT outlook: bullish
LT outlook: bearish
Trading position (short-term): In our opinion, the situation is not bearish enough to go short, so opening positions at the moment is not a good idea from the risk/reward perspective. We will keep you informed should anything change, or should we see a confirmation/invalidation of the above.
USD/CHF
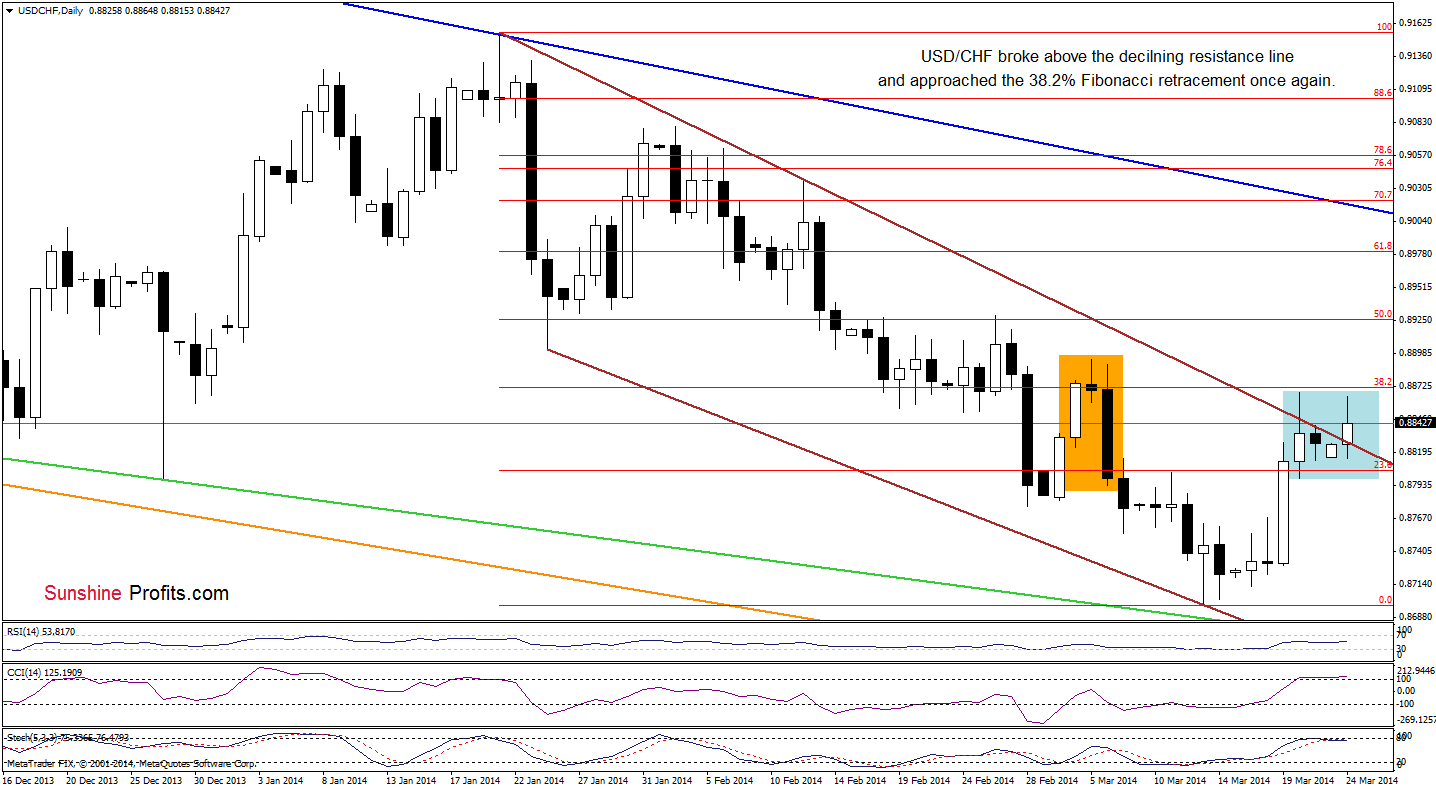
Looking at the above chart, we see that the situation has improved as USD/CHF broke above the upper line of the declining wedge/trend channel (marked with brown). Although this is a bullish signal, we should keep in mind that the exchange rate still remains below the 38.2% Fibonacci retracement level (based on the recent decline), which successfully stopped further improvement on Thursday. This area is also reinforced by a bearish candlestick pattern (an evening star). Additionally, the CCI and Stochastic Oscillator are overbought, which suggests that a pause or a pullback should not surprise us. Please note that, if the pair invalidates a breakout above the upper line of the declining wedge/trend channel, we will likely see a drop to the Thursday’s low in the near future. At this point, it’s worth noting that this support level is also a lower border of the consolidation range. Therefore, if it is broken, we may see further deterioration (even to the previously-broken upper line of the consolidation (around 0.8764).
Very short-term outlook: mixed
Short-term outlook: bearish
MT outlook: bearish
LT outlook: bearish
Trading position (short-term): In our opinion, the situation is not enough bullish to go long at the moment. We will keep you informed should anything change, or should we see a confirmation/invalidation of the above.
AUD/USD
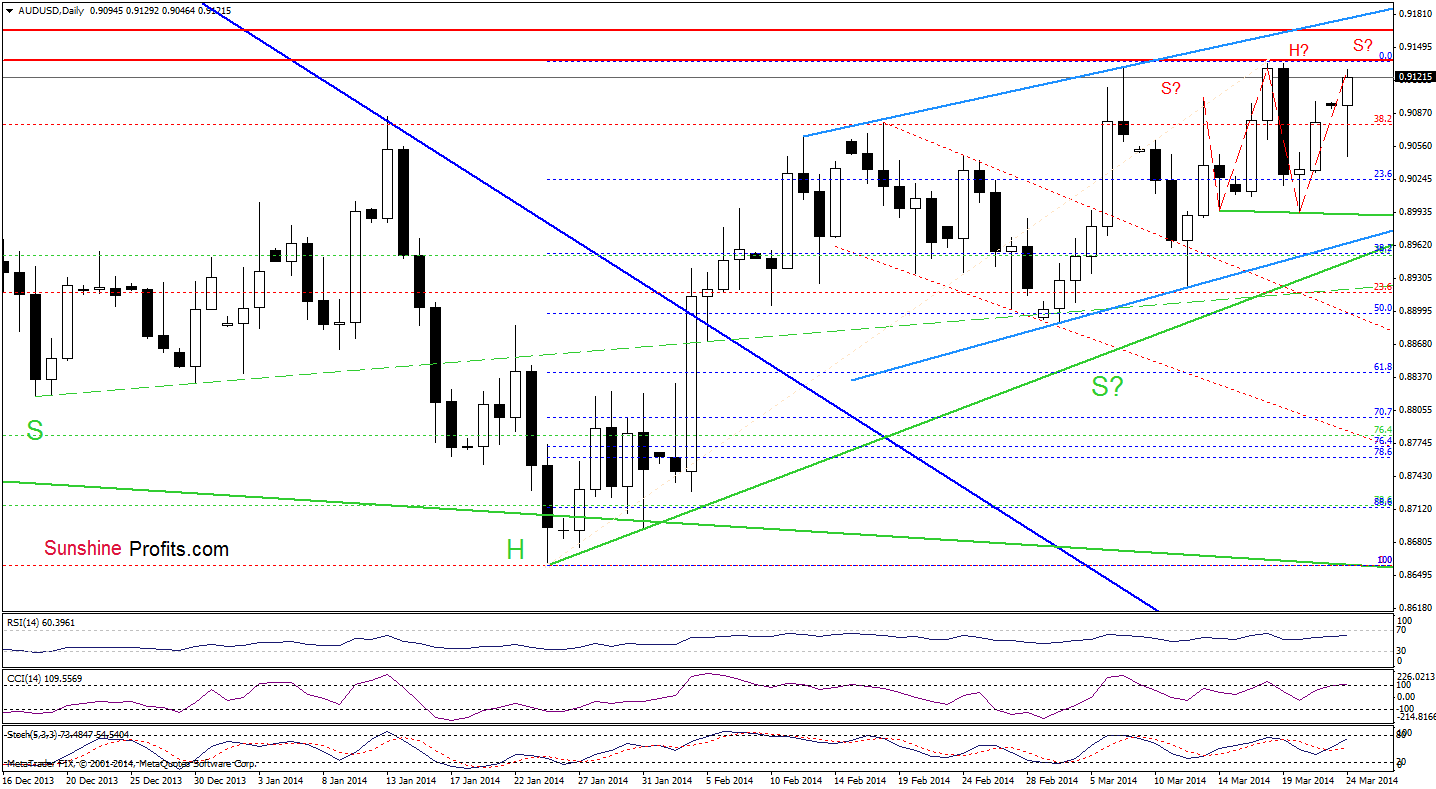
Looking at the above chart, we see that AUD/USD extended gains and approached the March high. If this resistance level encourages sellers to act, we may see a pullback in the near future. However, if it is broken, the buyers will likely try to push the exchange rate above a resistance zone (between 0.9151 and 0.9165) once again.
Very short-term outlook: mixed
Short-term outlook: bullish
MT outlook: bearish
LT outlook: bearish
Trading position (short-term; our opinion): Short. Stop-loss order: 0.9166 and the initial price target: 0.8955. We will keep you informed should anything change, or should we see a confirmation/invalidation of the above.
Thank you.
Nadia Simmons
Forex & Oil Trading Strategist
Forex Trading Alerts
Oil Investment Updates
Oil Trading Alerts

