
Earlier today, the greenback moved lower against the Canadian dollar after the release of better-than-expected Canadian inflation and retail sales data. What happened with other currency pairs? What is their current outlook? If you want to know our take on this question, we invite you to read our today's Forex Trading Alert.
In our opinion the following forex trading positions are justified - summary:
- EUR/USD: none; however in our opinion it's a good idea to automatically re-open the short position (i.e. by placing a pending limit order at this time), if the pair drops below 1.3748 (with the following stop-loss order: 1.3845)
- GBP/USD: none
- USD/JPY: none
- USD/CAD: none
- USD/CHF: none
- AUD/USD: short (stop-loss order: 0.9166 and the initial price target: 0.8955)
EUR/USD
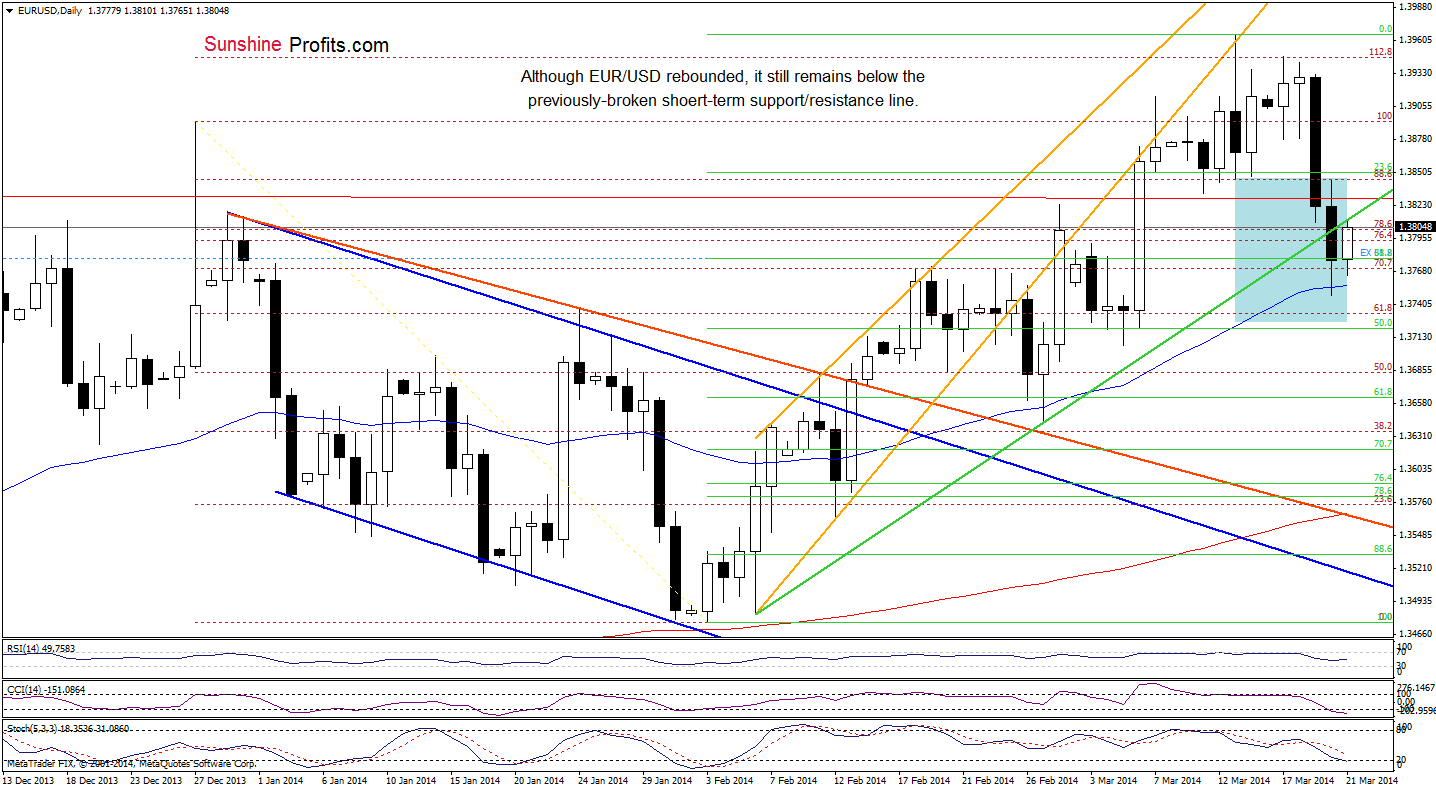
Looking at the above chart, we see that EUR/USD rebounded and came back above the 38.2% Fibonacci retracement (based on the recent rally) earlier today. As you see on the daily chart, with this upswing, the exchange rate reached the previously-broken short-term green support line (which serves as resistance at the moment). Taking this fact into account (and combining it with the size of the current decline and the position of the indicators), it seems that this resistance line will encourage sellers to act and trigger further deterioration in the coming day (or days).
Before we summarize this currency pair, let’s take a look at the 4-hour chart.
Quoting our last Forex Trading Alert:
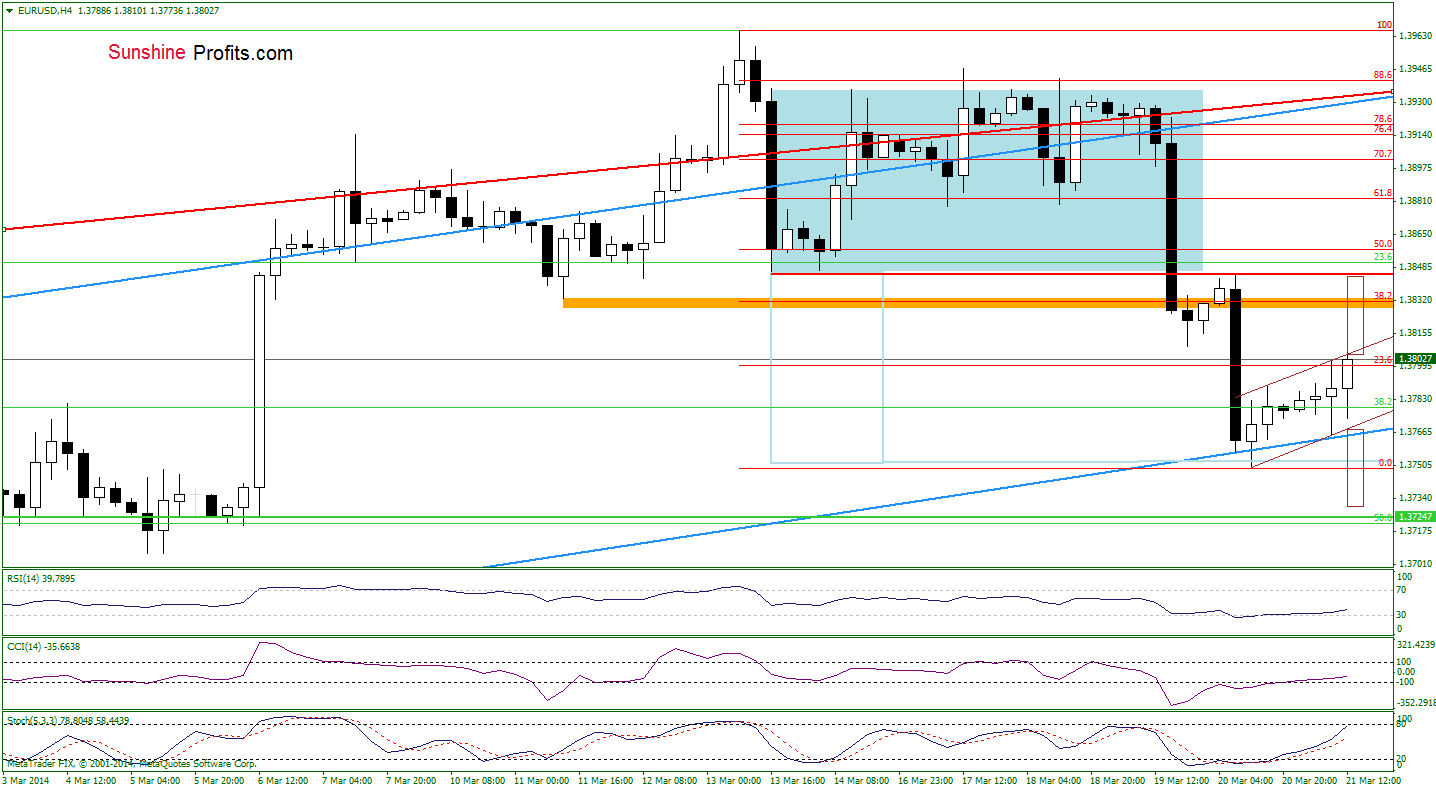
(…) the sellers (…) pushed the exchange to the lower border of the trend channel (…) this support line encouraged buyers to act, which resulted in a small corrective upswing in the following hours. Taking this fact into account, it seems that we may see further improvement – especially if the indicators (which are oversold) generate buy signals. In this case, the upside target for buyers will be the 38.2% Fibonacci retracement based on the recent decline, which corresponds to the March 11 low.
Looking at the above chart, we see that EUR/USD extended gains above the lower border of the trend channel as indicators generated buy signals earlier in the day. From this perspective, we see that the pair is trading in the rising trend channel. If the exchange rate breaks above the upper line of this formation, we may see an increase not only to the 38.2% Fibonacci retracement, but also to the lower border of the consolidation range (marked with a blue rectangle). On the other hand, if the buyers fail, we will likely see a drop to the lower border of the formation, which currently is slightly above the lower border of the blue rising trend channel. If this support is broken, we may see a drop to yesterday’s low or even lower.
Very short-term outlook: bearish
Short-term outlook: bearish
MT outlook: mixed
LT outlook: bearish
Trading position (our opinion): If the exchange rate declines below yesterday’s low (1.3748), it will be justified to re-enter short position. We will keep you informed should anything change, or should we see a confirmation/invalidation of the above.
GBP/USD
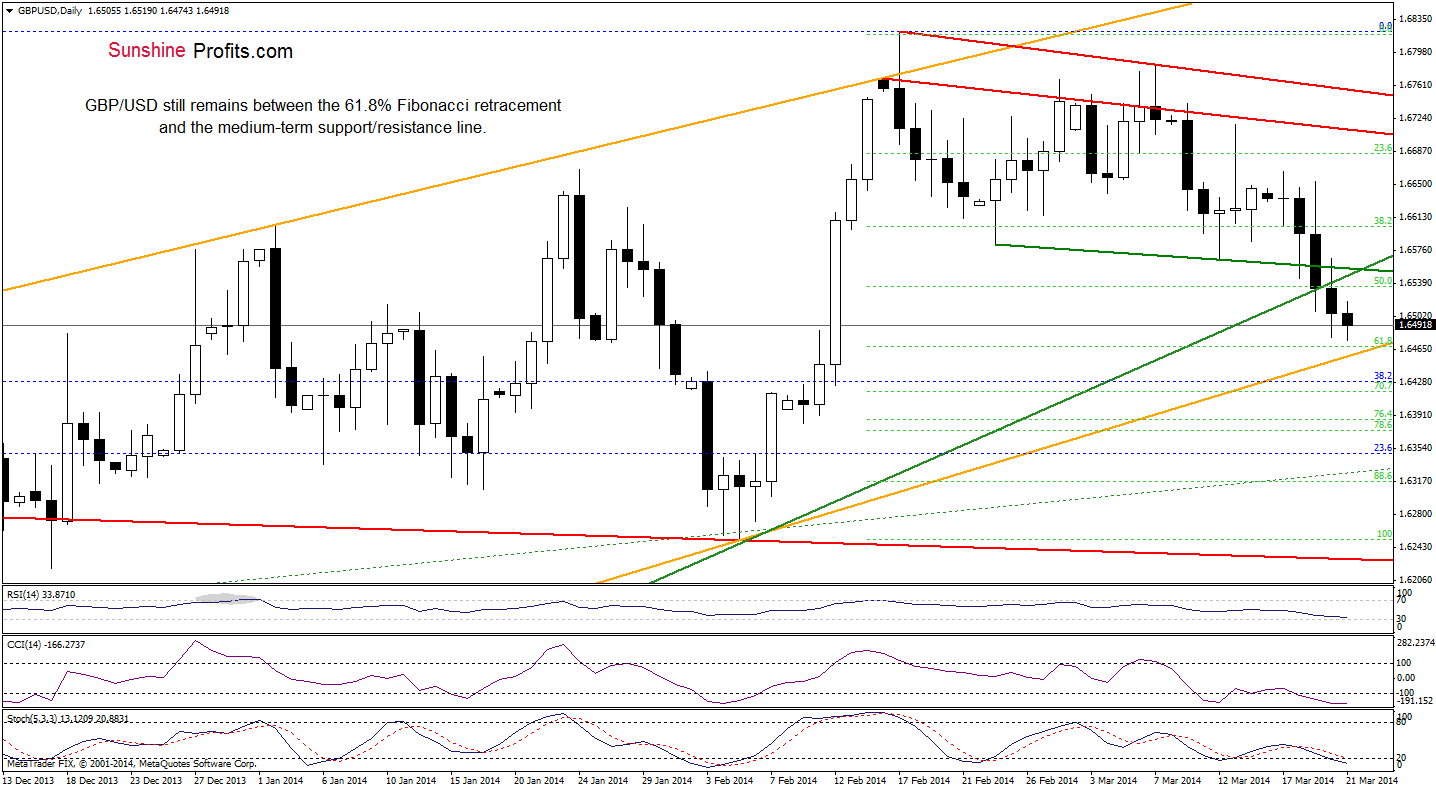
Looking at the daily chart, we see that the very short-term situation hasn’t changed much as GBP/USD remains between an important resistance zone (created by the green support line based on recent lows and the medium-term rising support line based on the July and February lows) and an important support zone (created by the 61.8% Fibonacci retracement based on the recent rally and the lower border of the orange rising trend channel. From this perspective, it seems that only a breakout above the resistance zone (or breakdown below the support zone), will trigger a bigger upward (or downward) move.
Very short-term outlook: bearish
Short-term outlook: mixed
MT outlook: mixed
LT outlook: mixed
Trading position (short-term): In our opinion no positions are justified from the risk/reward perspective at the moment. However, if the pair drops below the lower border of the rising trend channel, we consider opening short positions. We will keep you informed should anything change, or should we see a confirmation/invalidation of the above.
USD/JPY
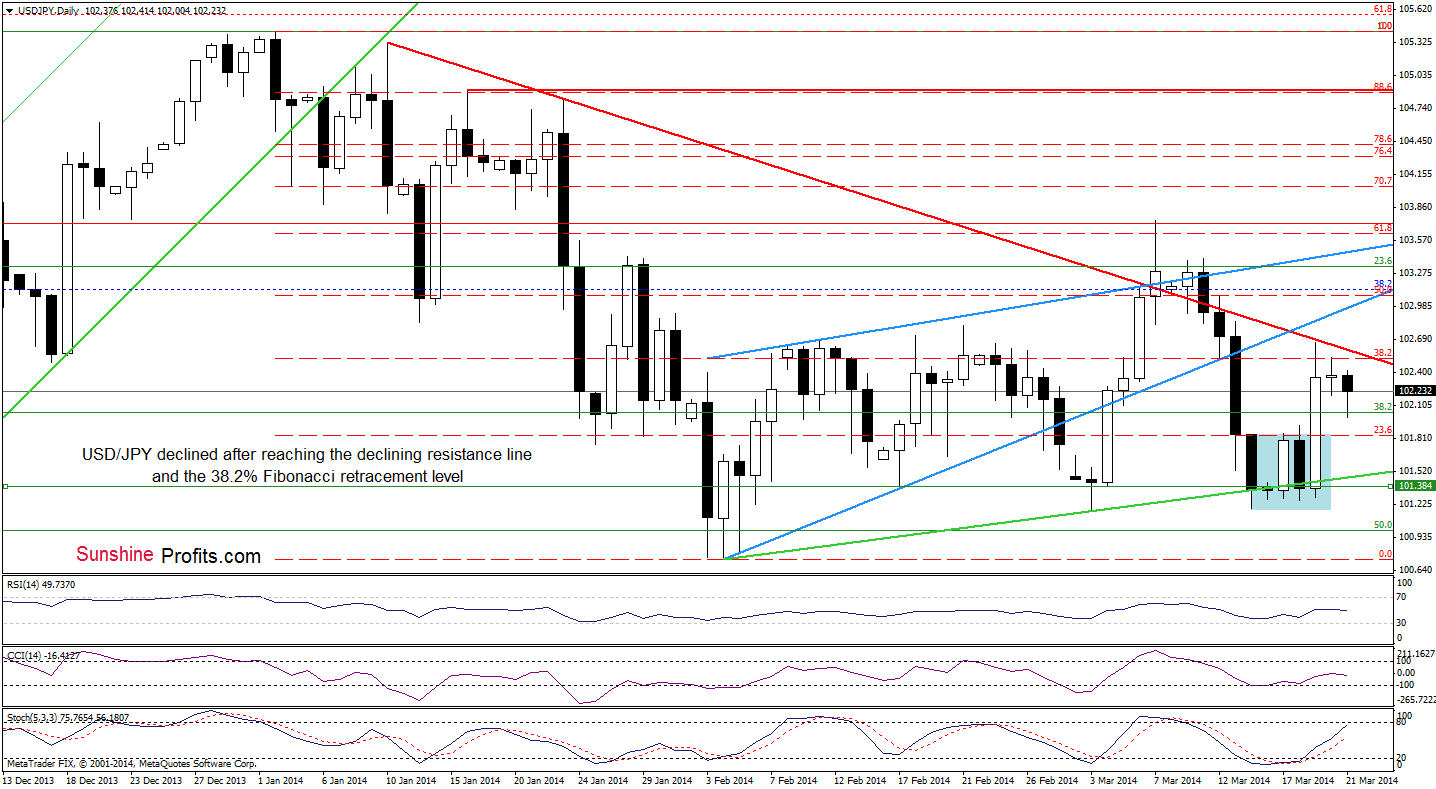
As you see on the above chart, USD/JPY extended losses earlier today as resistance zone created by the 38.2% Fibonacci retracement and the red declining resistance line encouraged sellers to act. With this downswing, the pair approached a support level (created by the previously-broken upper line of the consolidation range) and reversed. Despite this move, from this perspective, it seems that as long as the exchange rate remains below this resistance, a bigger upswing is not likely to be seen.
Very short-term outlook: mixed
Short-term outlook: mixed
MT outlook: bullish
LT outlook: bearish
Trading position (short-term): In our opinion no positions are justified from the risk/reward perspective at the moment. However, if the pair successfully breaks above the resistance zone, we will consider opening long positions. We will keep you informed should anything change, or should we see a confirmation/invalidation of the above.
USD/CAD
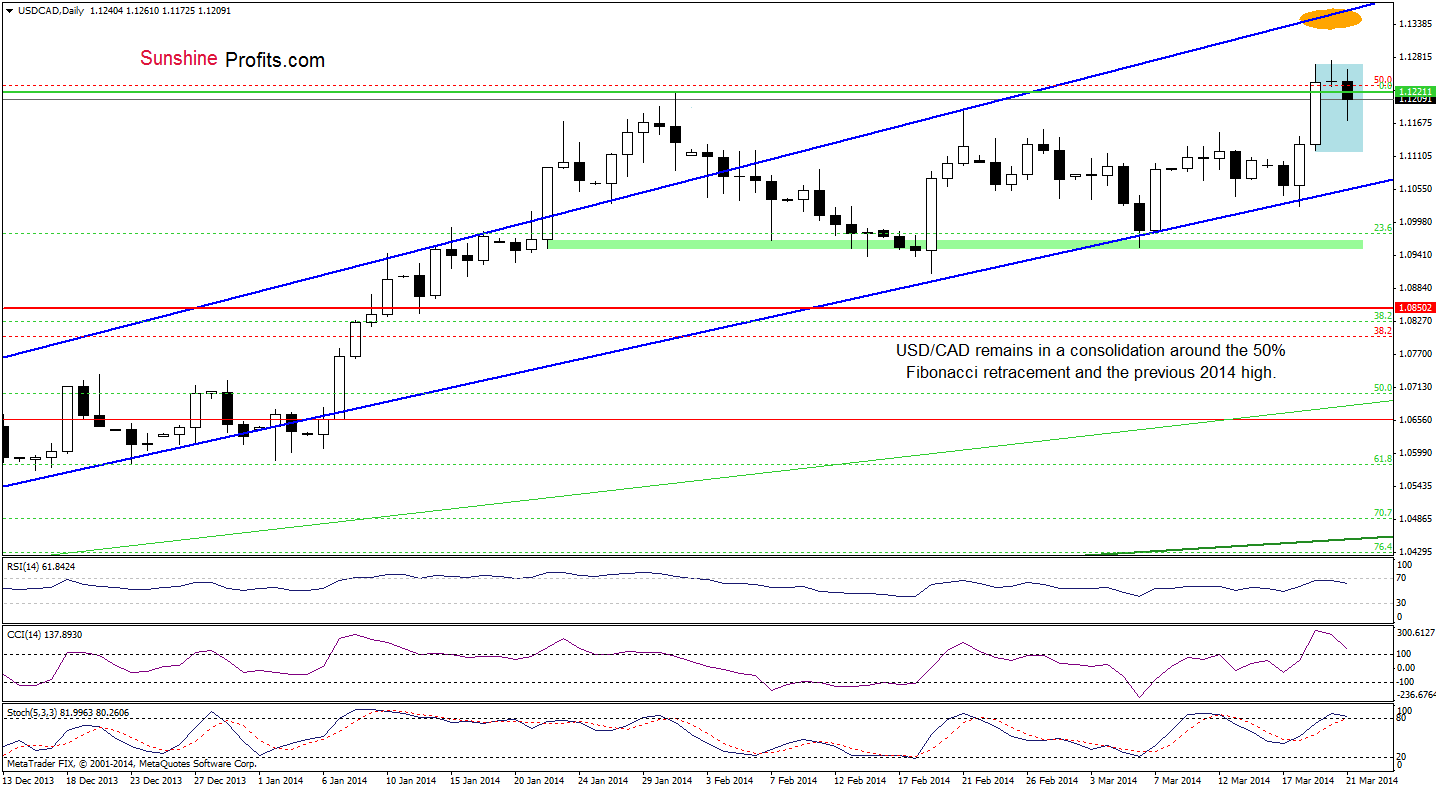
Looking at the above chart, we see that although USD/CAD gave up the gains and declined earlier today, the pair still remains in a consolidation around the previous 2014 high and the 50% Fibonacci retracement level. Taking this fact into account, we should consider two scenarios. If the exchange rate climbs above yesterday’s high, we may see an increase to the next upside target - the upper line of the rising trend channel. On the other hand, if USD/CAD declines below Wednesday low, we may a drop to the lower border of the rising trend channel. Please note that the RSI slipped below the level of 70, while the CCI is overbought and the Stochastic Oscillator is very close to generating a sell signal, which suggests that we may see a pause or a pullback in the coming day (or days).
Very short-term outlook: mixed
Short-term outlook: bullish
MT outlook: bullish
LT outlook: bearish
Trading position (short-term): In our opinion, the space for further growth seems limited, so opening long positions at the moment is not a good idea from the risk/reward perspective. We will keep you informed should anything change, or should we see a confirmation/invalidation of the above.
USD/CHF
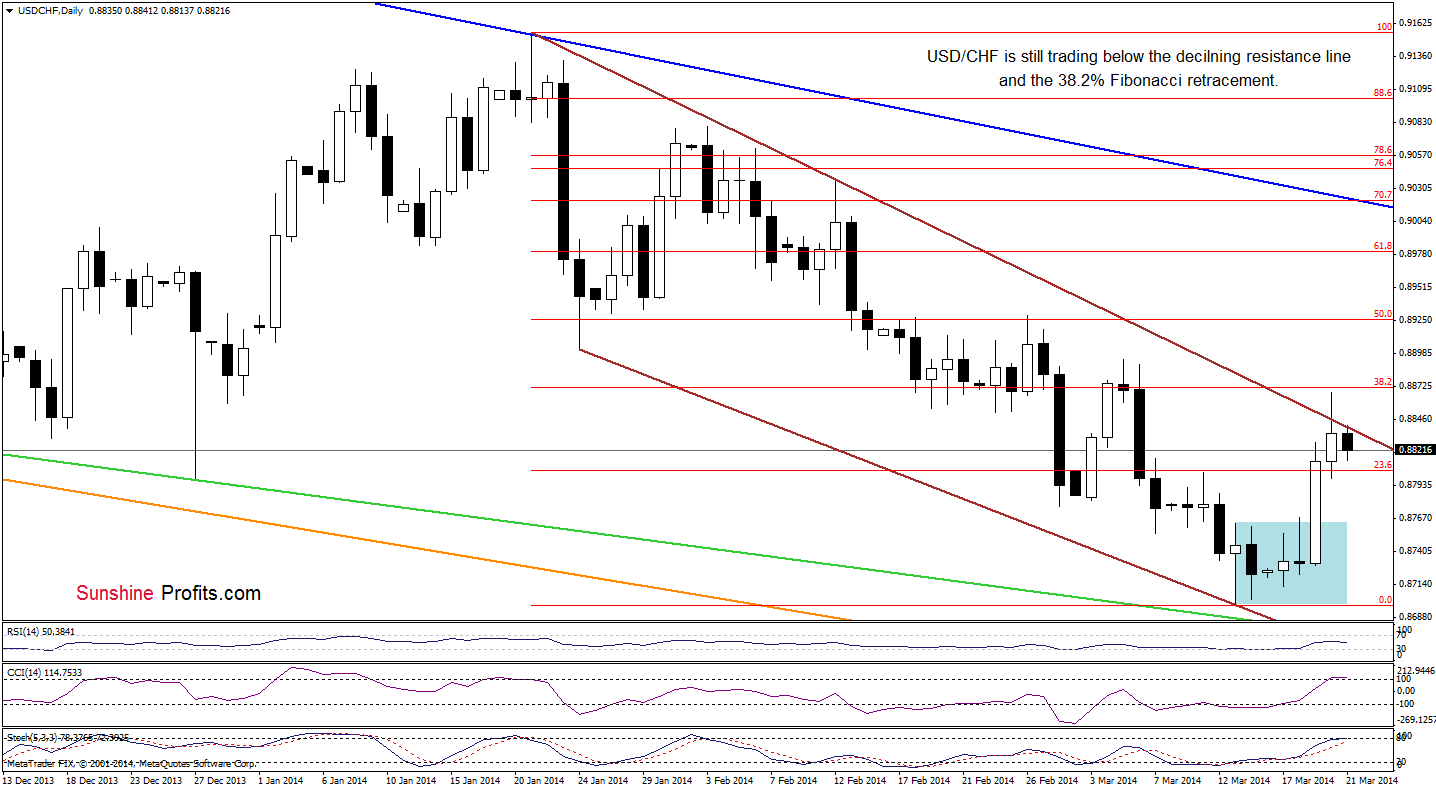
Looking at the above chart, we see that the situation hasn’t changed much as USD/CHF remains below the upper line of the declining wedge/trend channel (marked with brown) and the 38.2% Fibonacci retracement level based on the recent decline. As you see on the daily chart, this strong resistance encouraged sellers to act, which resulted in a small decline earlier today. However, if the buyers do not manage to push the pair above the upper line of the declining wedge/trend channel in the following hours, we may see further deterioration and the initial downside target would be yesterday’s low. If this support is broken, the next downside target will be the previously-broken upper line of the consolidation (around 0.8764).
Very short-term outlook: mixed
Short-term outlook: bearish
MT outlook: bearish
LT outlook: bearish
Trading position (short-term): In our opinion, the situation is not enough bullish to go long at the moment. We will keep you informed should anything change, or should we see a confirmation/invalidation of the above.
AUD/USD
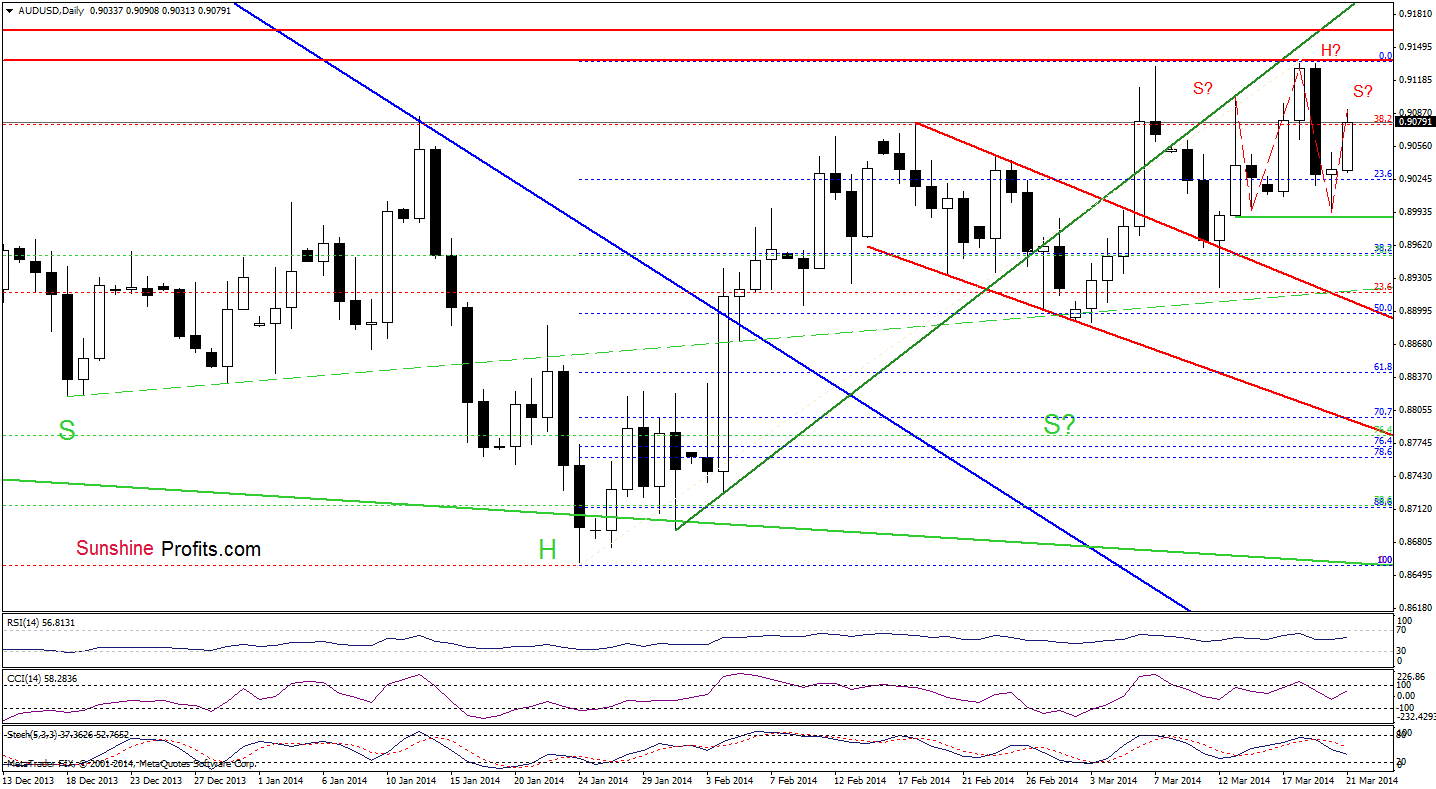
Looking at the above chart, we see that AUD/USD extended gains and approached the March 13 high. From this perspective, we can notice a potential bearish head and shoulders pattern underway. If this is the case, we may see an increase to 0.9102 (or even to Wednesday high). With such an upswing, the pair will form the right shoulder of the formation. At this point, it’s worth noting that a drop below the neck level (in this case, the more reliable will be a decline below the March 13 low) will confirm the pattern and likely trigger further deterioration. Please note that as long as AUD/USD remains below an important resistance zone created by the green resistance line and the 2014 high, a bigger upswing is not likely to be seen.
Very short-term outlook: mixed
Short-term outlook: bullish
MT outlook: bearish
LT outlook: bearish
Trading position (short-term; our opinion): Short. Stop-loss order: 0.9166 and the initial price target: 0.8955. We will keep you informed should anything change as far as our opinion is concerned, or should we see a confirmation/invalidation of the above. The above is not an investment / trading advice and please note that trading (especially using leveraged instruments such as futures or on the forex market) involves risk.
Thank you.
Nadia Simmons
Forex & Oil Trading Strategist
Forex Trading Alerts
Oil Investment Updates
Oil Trading Alerts

