
Although better-than-expected U.S. jobless claims data gave the U.S. dollar some support, the greenback declined sharply against the euro after ECB President Mario Draghi confirmed that the bank left its benchmark interest rate unchanged at 0.5% as recent data indicated moderate economic recovery in the euro zone. In this way, the U.S. currency dropped to its lowest level this year against the common currency. What happened with other currency pairs? What is their current outlook? We invite you to read our today's Forex Trading Alert.
In our opinion the following forex trading positions are justified - summary:
EUR/USD
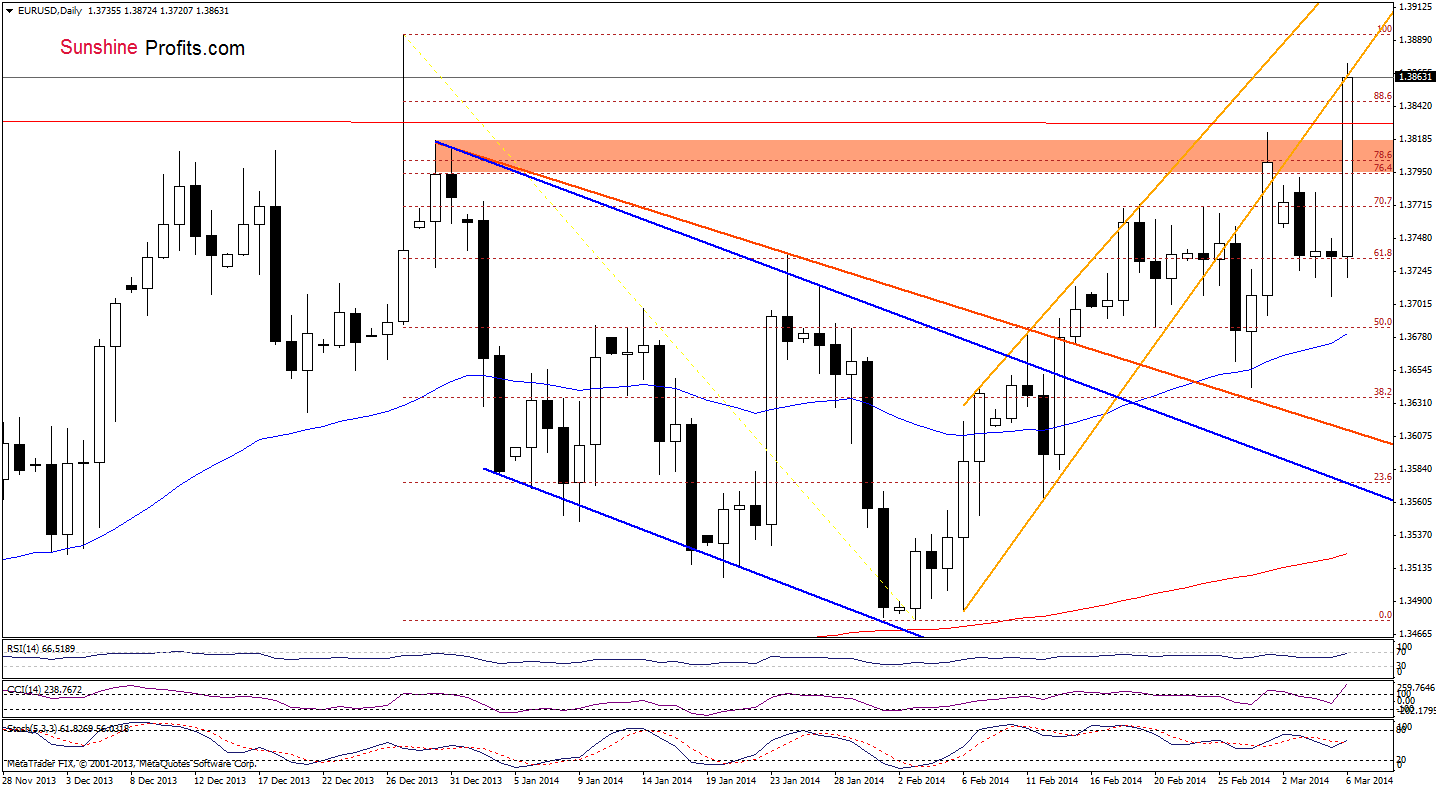
On the above chart, we see that EUR/USD rebounded sharply, broke above the February high, the 88.6% Fibonacci retracement level and reached the lower border of the rising trend channel (marked with orange). If this resistance line encourages sellers to act, we may see a pullback in the near future. However, if it is broken, we may see an increase to the 2013 high (or even to the upper line of the trend channel). Looking at the current position of the indicators, we see that the RSI approached the level of 70, while the CCI is overbought and the Stochastic Oscillator generated a sell signal (additionally, there is a negative divergence between the indicator and the exchange rate), which suggests that the pair may reversed in the near future.
Before we summarize this currency pair, let’s zoom our picture and focus on the 4-hour chart. Will it give us any interesting clues?
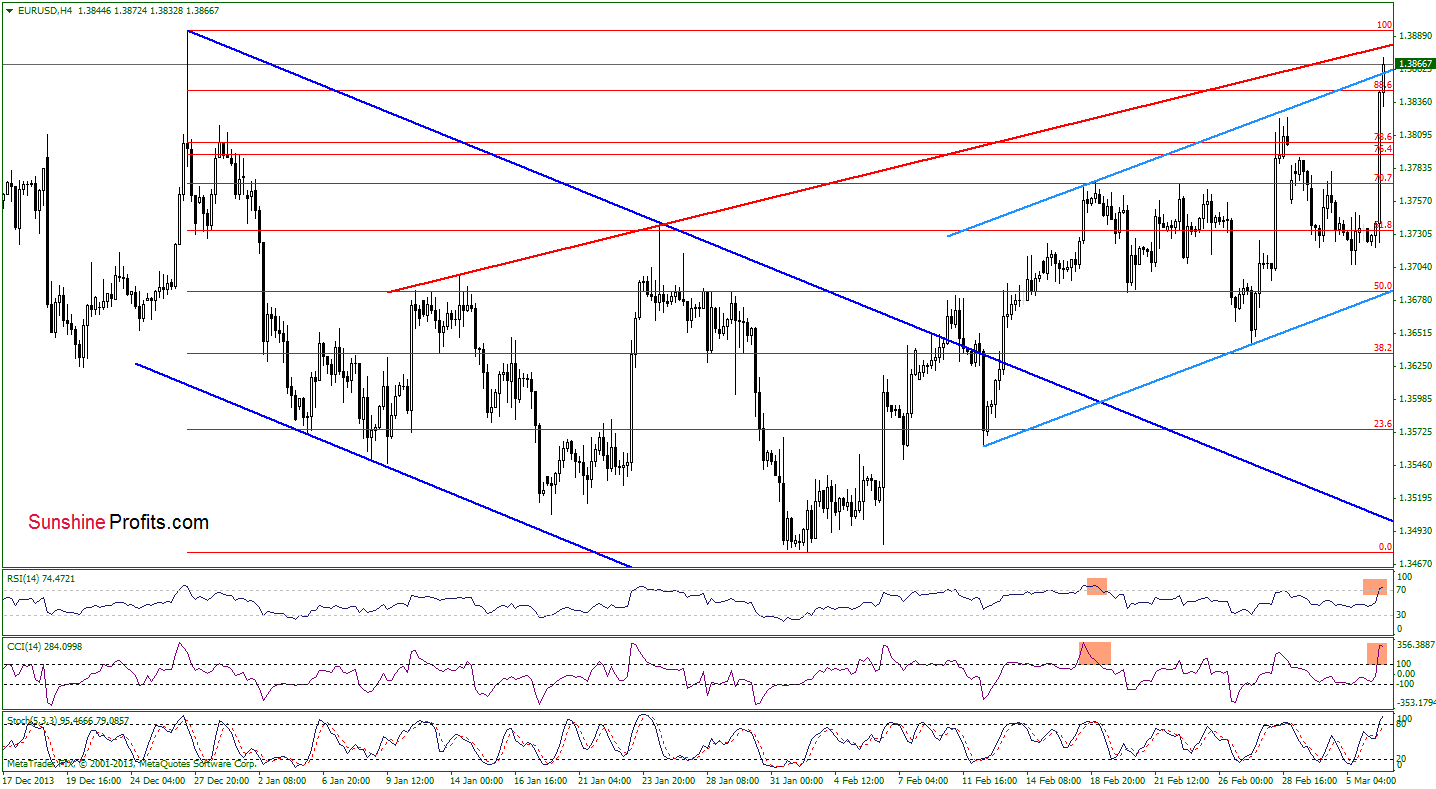
From this perspective, we see that EUR/USD broke above the upper line of the rising trend channel (marked with blue), which is a bullish signal (however, this breakout is not confirmed at the moment). Nevertheless, we should keep in mind that the pair is still below the short-term resistance line (marked with red). Taking these facts into account and combining with the current position of the indicators, it seems that we will likely see a pullback in the following hours – especially if the indicators generate sell signals.
Very short-term outlook: bullish
Short-term outlook: bullish
MT outlook: mixed
LT outlook: bearish
Trading position (short-term): In our opinion no positions are justified from the risk/reward perspective. We will keep you informed should anything change, or should we see a confirmation/invalidation of the above.
GBP/USD
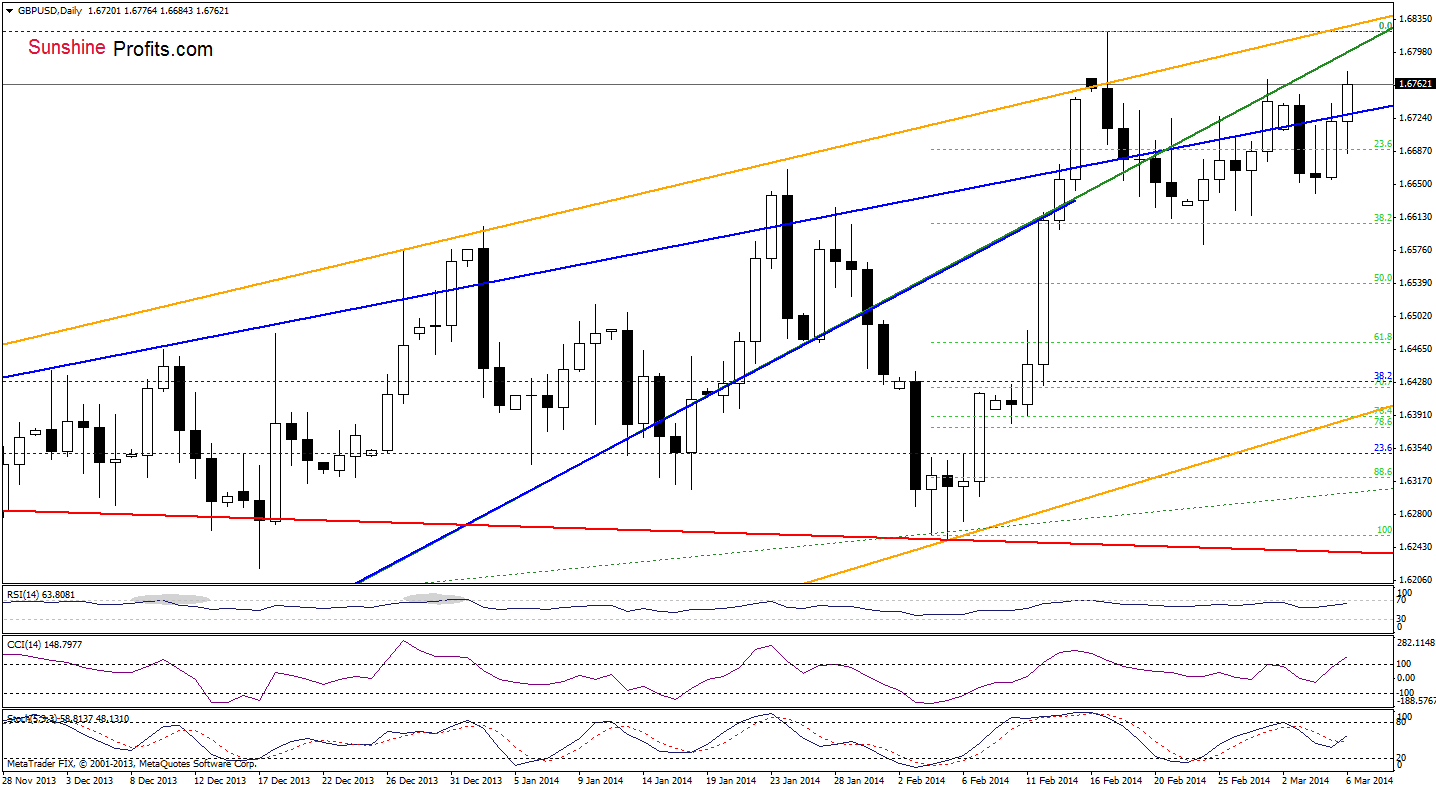
Looking at the above chart, we see that the situation has improved as GBP/USD climbed above the upper line of the rising wedge once again, which is a bullish sign. However, this breakout is not reliable at the moment as we saw similar situation in the previous week (and once again on Monday). Please note that the CCI and Stochastic Oscillator move in the same directions, supporting buyers. If they do not give up, we may see an increase to the medium-term support/resistance green line, which serves as the nearest resistance at the moment.
Nevertheless, we should keep in mind, what we wrote in our previous Forex Trading Alert, discussing the situation in the 4-hour chart.
(…) the CCI and Stochastic Oscillator still support buyers, which suggests that we will likely see an increase to the Feb.28 high. If this resistance level is broken, we may see an upswing to the upper line of the rising channel. From this perspective, it seems that as long as there is no breakout above the upper line of this formation (or breakdown below the lower border) a bigger upswing (or downswing) is not likely to be seen.
Very short-term outlook: mixed
Short-term outlook: mixed
MT outlook: mixed
LT outlook: mixed
Trading position (short-term): In our opinion no positions are justified from the risk/reward perspective at the moment. We will keep you informed should anything change, or should we see a confirmation/invalidation of the above.
USD/JPY
Quoting our last Forex Trading Alert:
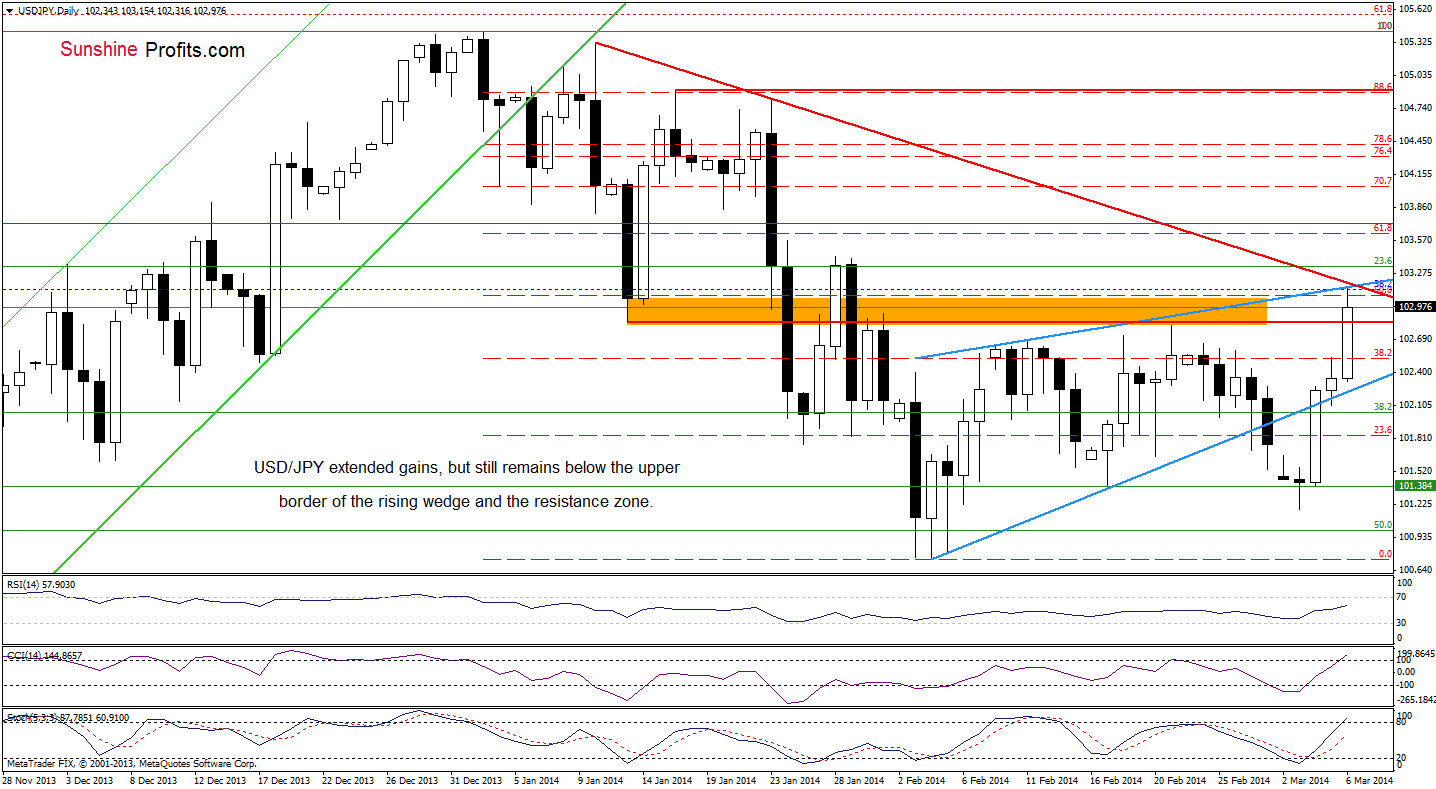
(…) USD/JPY moved above the lower border of the lower border of the rising wedge, which triggered further improvement (…) and the upside target was reached. If the Fibonacci retracement is broken, we will likely see further improvement and an upward move to a resistance zone (marked with an orange rectangle). This pro growth scenario is currently reinforced by the position of the indicators (buy signals still support the bullish case).
Earlier today, the pair extended gains once again and successfully broke above the 38.2% Fibonacci retracement, reaching the next upside target. At this point, it’s worth noting that the orange resistance zone is reinforced by the upper line of the rising wedge, the 50% Fibonacci retracement and the red declining resistance line. If this very strong resistance area encourages sellers to act, we will likely see a drop to the previously-broken Fibonacci retracement. However, if it is broke, we will likely see further improvement and an increase to (at least) the next Fibonacci retracement.
Very short-term outlook: mixed with bullish bias
Short-term outlook: mixed with bearish bias
MT outlook: bullish
LT outlook: bearish
Trading position (short-term): In our opinion, the situation is too unclear to go short or long at the moment. So, no positions are justified from the risk/reward perspective. However, if the resistance zone, the upper line of the rising wedge and the red declining resistance line are broken, we will consider opening long positions. We will keep you informed should anything change, or should we see a confirmation/invalidation of the above.
USD/CAD
In our last Forex Trading Alert, we wrote the following:
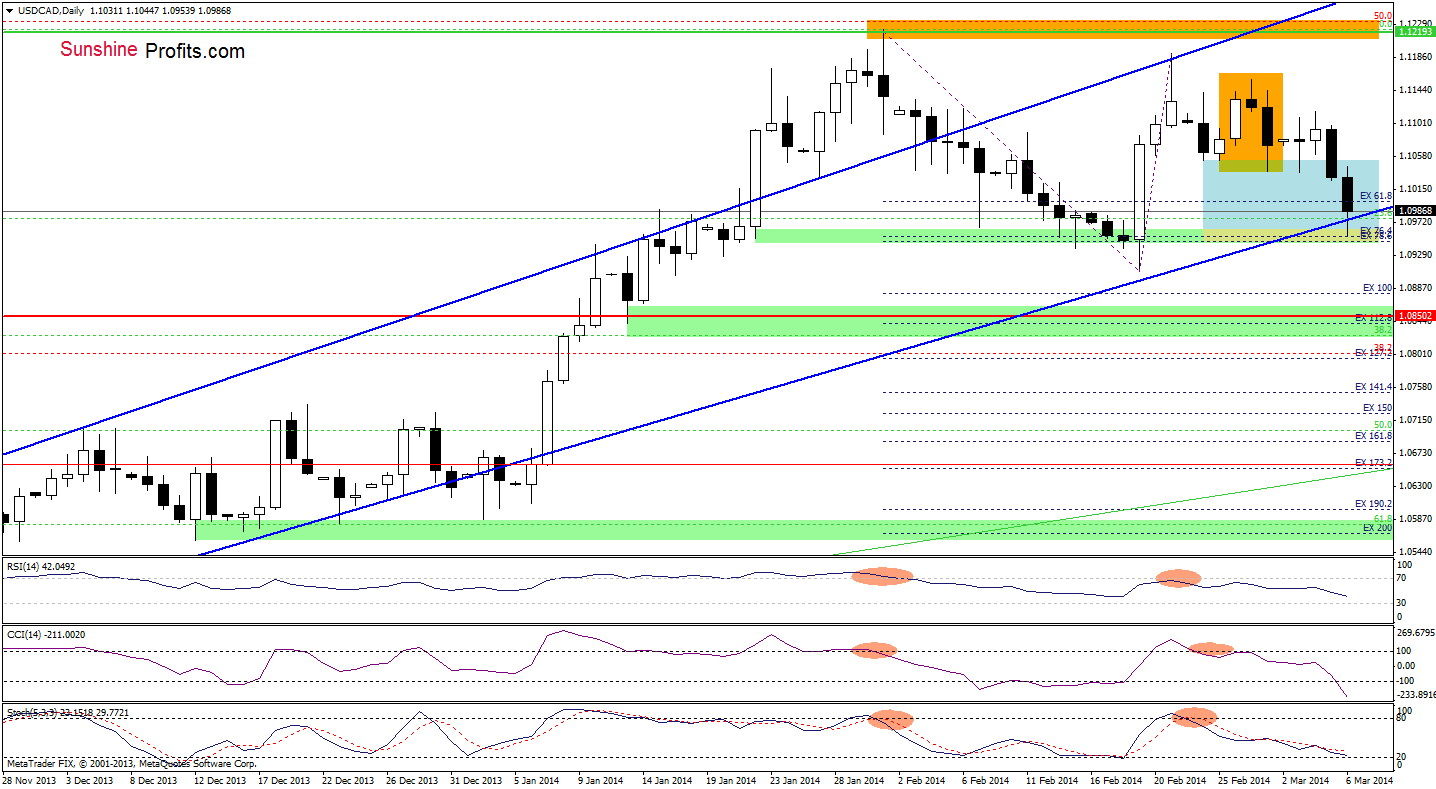
(…) USD/CAD broke below the lower border of the consolidation range, which suggests that we may see further deterioration. Therefore, a bearish scenario (…) is still up-to-date (…) if the exchange rate closes the day below the Feb.24 low, we may see further deterioration and a drop to the lower border of the rising trend channel, which corresponds to a support zone created by Jan.22, Feb.7 and Feb13 lows.
As you see on the above chart, the pair declined earlier today (there was a breakdown below the lower border of the declining trend channel seen on the 4-hour chart that we included yesterday) and sellers realized their scenario. At this point, we should consider two scenarios. If this strong support level encourages buyers to push the order button, we will likely see a corrective upswing in the coming day (or days). However, if the exchange rate extends its decline and dropped below this support zone, we will see further deterioration and the next downside target will be around 1.0850, where the 38.2% Fibonacci retracement based on the entire Sept.-Jan. rally, the May 2010 high and the 112.8 Fibonacci projection are.
Very short-term outlook: mixed
Short-term outlook: mixed
MT outlook: bullish
LT outlook: bearish
Trading position (short-term): In our opinion no positions are justified from the risk/reward perspective. However, if the pair drops below the lower border of the declining trend channel, we consider opening short positions. We will keep you informed should anything change, or should we see a confirmation/invalidation of the above.
USD/CHF
Quoting our previous Forex Trading Alert:
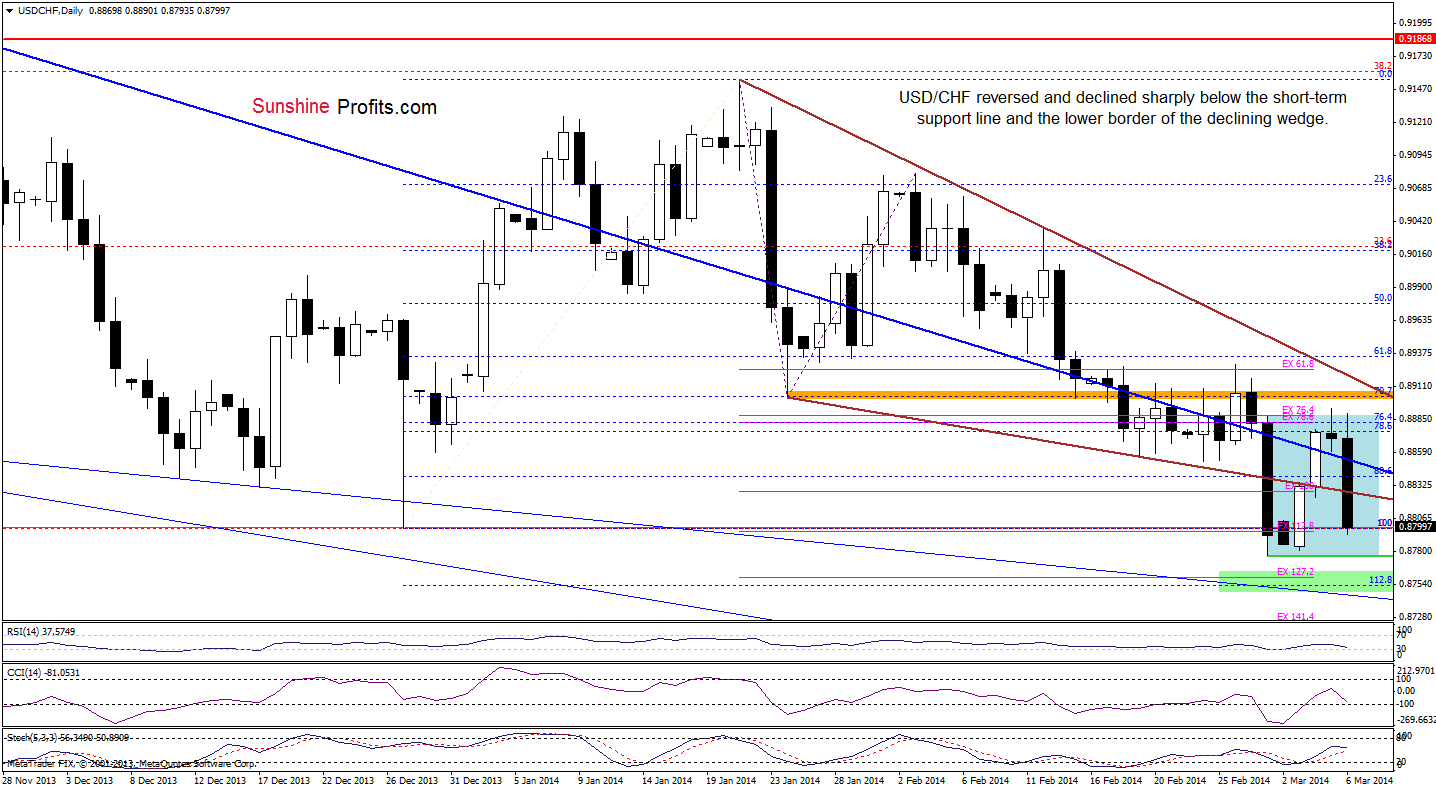
(…) USD/CHF extended gains and almost reached a resistance level (created by the January low) earlier today. If it encourages sellers to act, we may see a pause or a pullback to the previously-broken short-term declining blue line, which serves as the nearest support at the moment (please note that even if the pair drops below this line, the next support – the lower border of the declining wedge is slightly below.
As you on the above chart, the pair reversed and declined sharply earlier today. With this downswing, the exchange rate not only broke below the short-term declining blue line, but also under the lower border of the declining wedge, which is a strong bearish signal. From this perspective, it seems that we will likely see a re-test of the strength of the February low. If it holds, we may see another corrective upswing. However, if the buyers fail, we will likely see a drop to the support zone created by the 112.8% Fibonacci extension, the 127.2% Fibonacci projection and the medium-term thin blue support line, which successfully stopped declines in December.
Very short-term outlook: bearish
Short-term outlook: bearish
MT outlook: bearish
LT outlook: bearish
Trading position (short-term): In our opinion, the situation is too unclear to go long or short at the moment. We will keep you informed should anything change, or should we see a confirmation/invalidation of the above.
AUD/USD
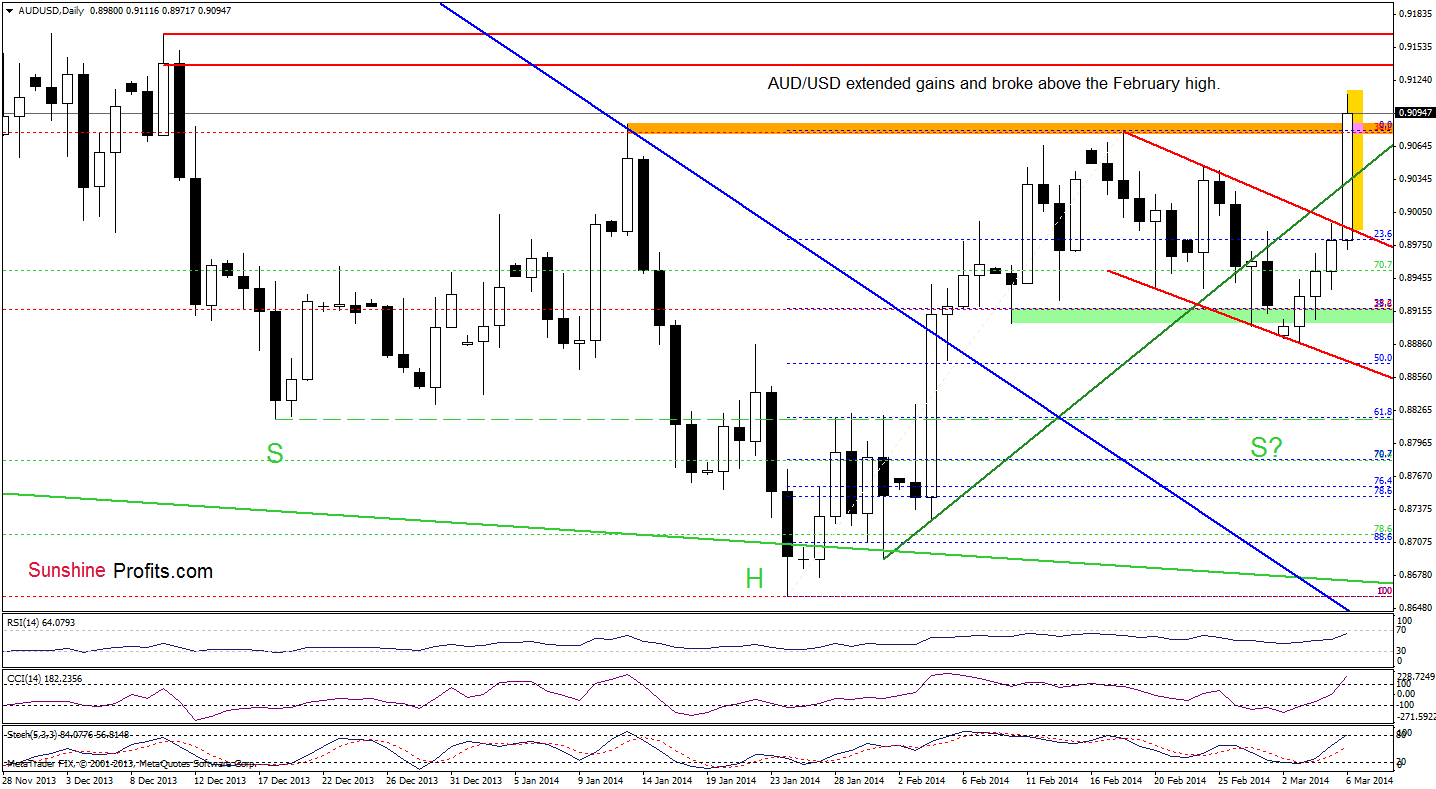
Yesterday, we wrote that the current position of the indicators supported buyers, which suggested that they could try to push the exchange rate higher in the near future. Earlier today, AUD/USD extended gains and successfully broke not only above the upper line of a declining trend channel (marked with red), but also above the green resistance line. These positive circumstances triggered a sharp upward move, which took the pair above the February high. As you see on the daily chart, the exchange rate almost reached an upside price target after a breakout above the upper line of a declining trend channel (marked with yellow), which may encourages sellers to act (especially when we factor in the current position of the indicators). Nevertheless, the short-term outlook is bullish and further increases are quite likely. If this is the case, the nearest resistance zone is between 0.9139 and 0.9165 (the Dec.10 high in terms of intraday high and closing prices).
Very short-term outlook: bullish
Short-term outlook: bullish
MT outlook: bearish
LT outlook: bearish
Trading position (short-term): In our opinion no positions are justified from the risk/reward perspective at the moment. We will keep you informed should anything change, or should we see a confirmation/invalidation of the above.
Thank you.
Nadia Simmons
Forex & Oil Trading Strategist
Forex Trading Alerts
Oil Investment Updates
Oil Trading Alerts

