
Earlier today, the U.S. dollar moved higher against major currencies despite disappointing economic data, which showed that the U.S. private sector added 139,000 jobs in February (below expectations for an increase of 160,000). However, the greenback gave up some gains after the Institute of Supply Management reported that its services purchasing manager's index fell to a 43-month low of 51.6 last month from 54.0 in January (while analysts had expected a drop to 53.5 in February). What impact did it have on major currency pairs? What is their current outlook? If you want to know our take on this question, we invite you to read our today's Forex Trading Alert.
In our opinion the following forex trading positions are justified - summary:
EUR/USD
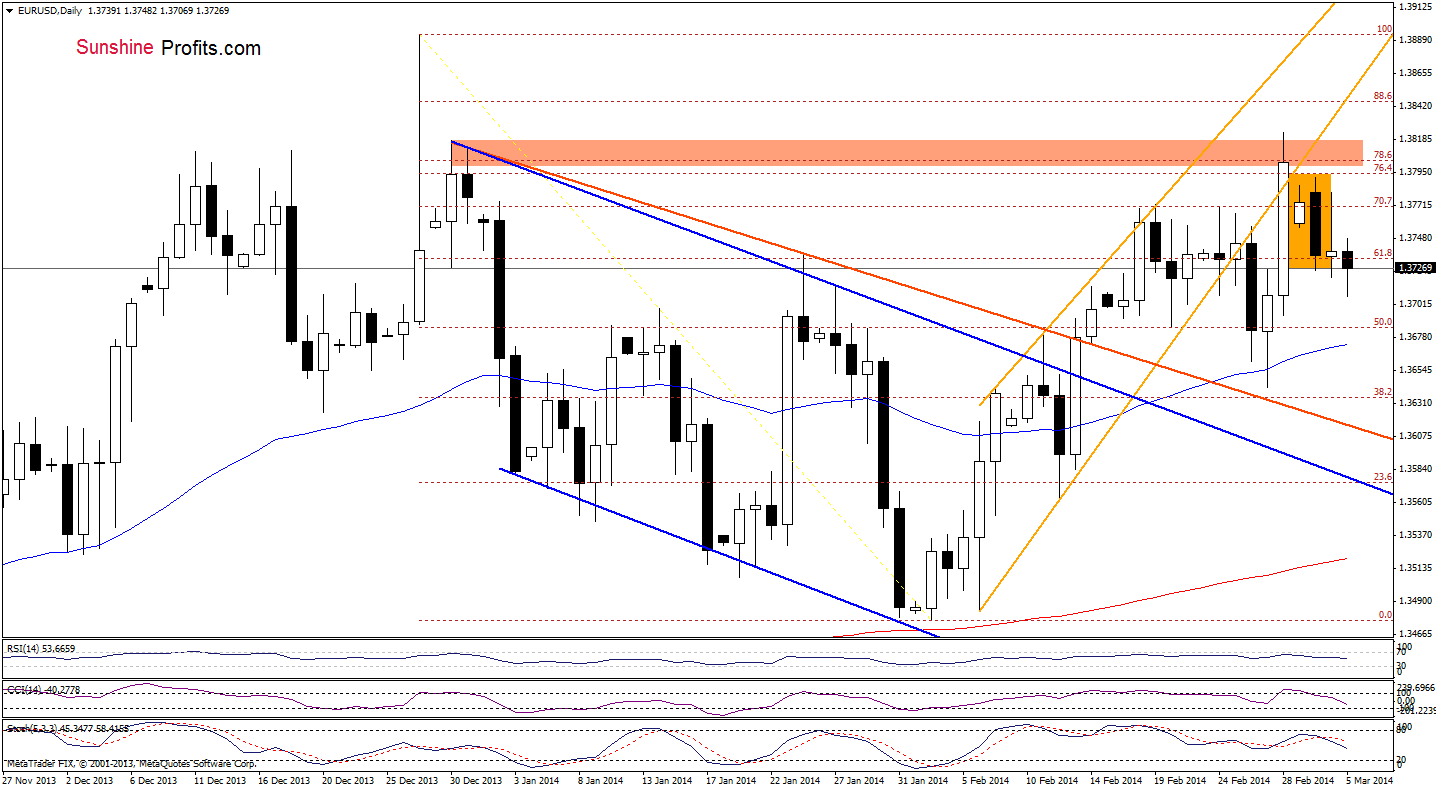
On the above chart, we see that EUR/USD remains between Friday high and low, which makes the situation is a bit unclear at the moment. However, we should keep in mind that a bearish engulfing pattern still supports sellers and sell signals generated by the indicators remain in place, which suggests that further deterioration is just around the corner.
Before we summarize this currency pair, let’s zoom our picture and focus on the 4-hour chart. Will it give us any interesting clues?
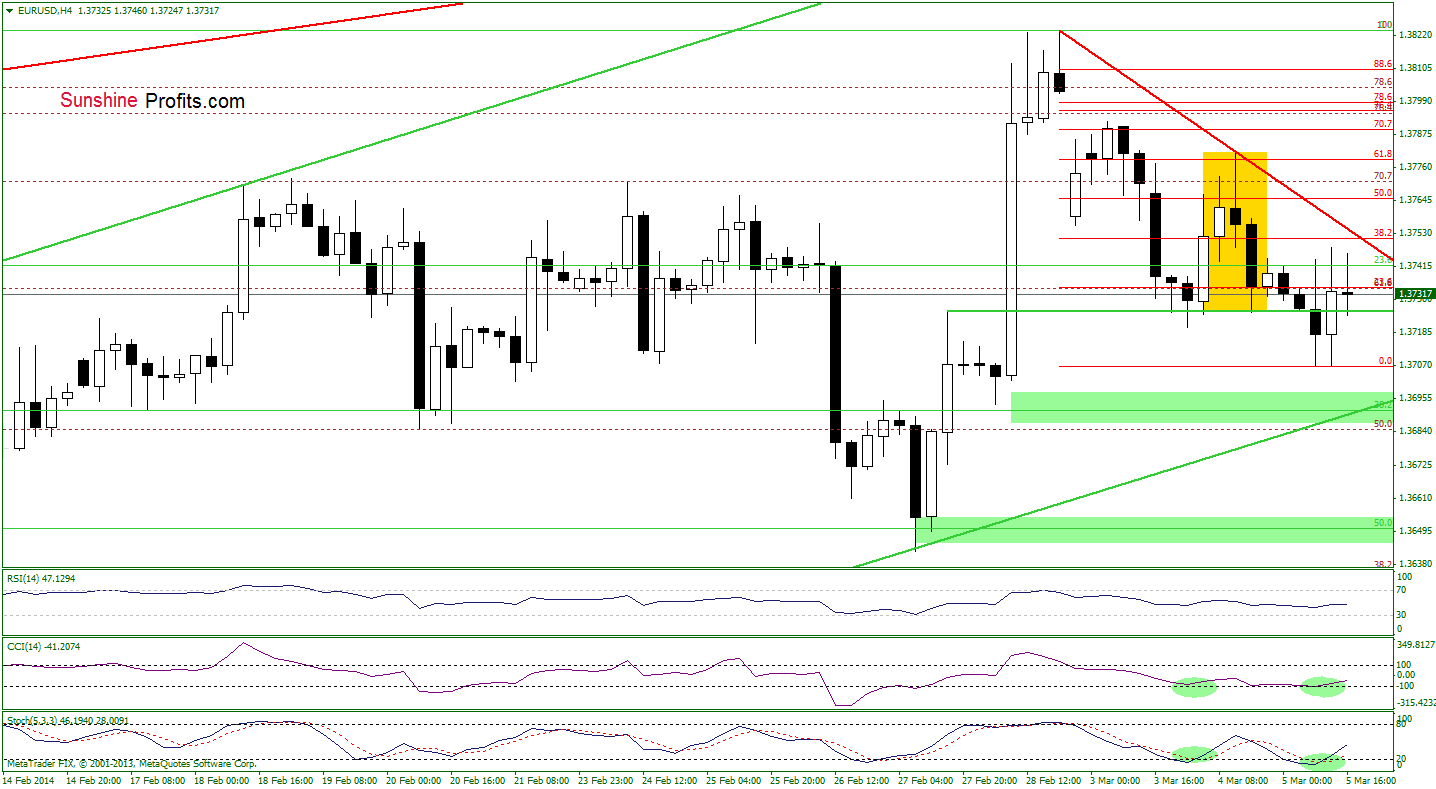
Looking at this chart, we see that EUR/USD remains between the Feb.27 high and the declining resistance line (marked with red). If this very short-term resistance is broken, we will likely see further improvement in the following hours and the upside target will be around 1.3781, where the top of a bearish candlestick formation is. As you see on the above chart, this area is also reinforced by the 61.8% Fibonacci retracement level based on the recent decline. This pro growth scenario is currently reinforce by the position of the indicators. Nevertheless, if the proximity to the declining resistance line encourages sellers to act, we may see a drop to the 38.2% Fibonacci retracement level based on the recent rally, which corresponds to the Friday low and the lower border of the rising trend channel, which may pause or even stop further deterioration.
Very short-term outlook: mixed
Short-term outlook: bullish
MT outlook: mixed
LT outlook: bearish
Trading position (short-term): In our opinion no positions are justified from the risk/reward perspective. We will keep you informed should anything change, or should we see a confirmation/invalidation of the above.
GBP/USD
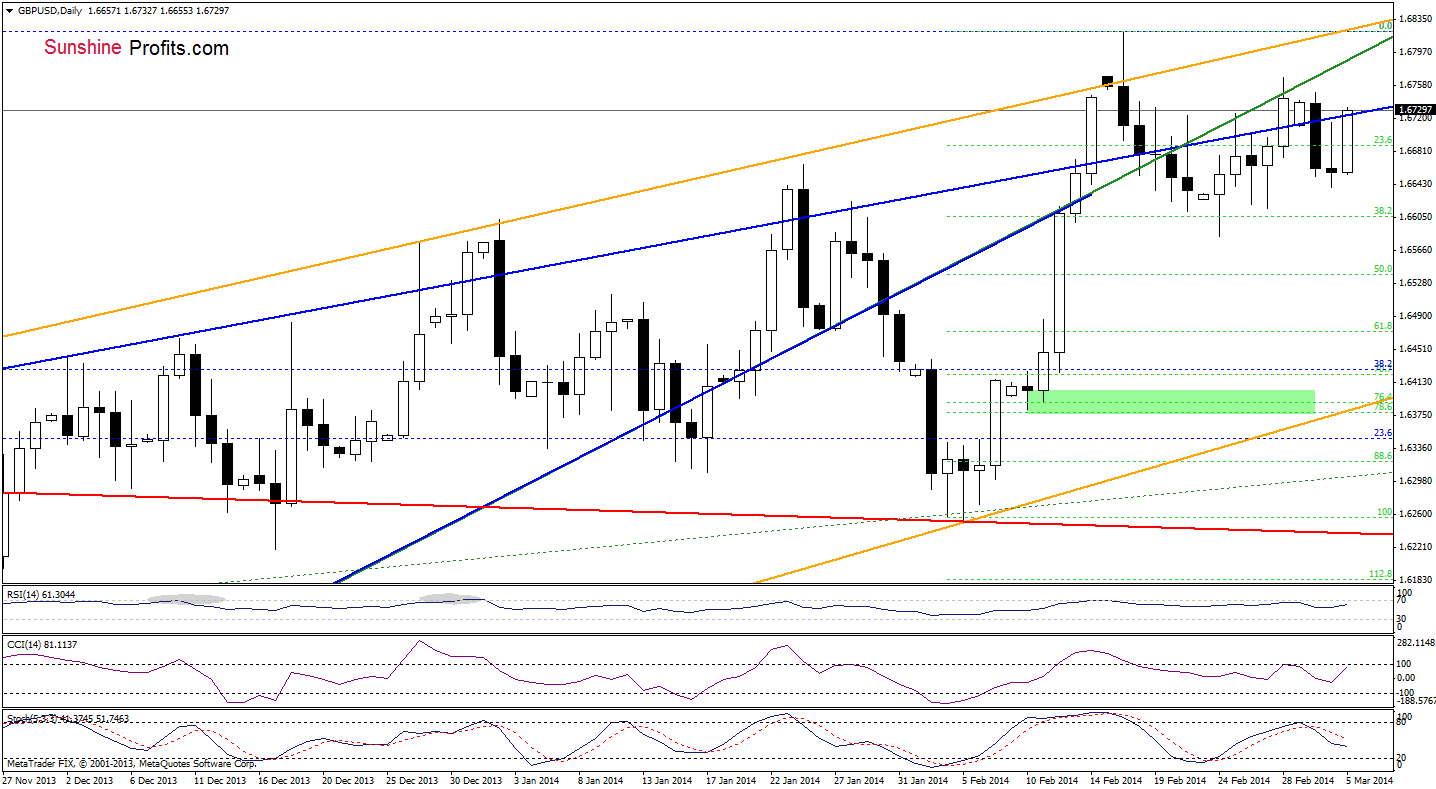
Looking at the above chart, we see that although GBP/USD declined below the upper line of the rising wedge yesterday, we saw another attempt to move above this level earlier today. As you see on the daily chart, the buyers managed to push the exchange rate above this resistance level, which is a bullish sign. However, this breakout is not reliable at the moment as we saw similar situation in the previous week (and once again on Monday). Please note that the CCI and Stochastic Oscillator move in opposite directions, which increases unclarity of the very short-term outlook. On one hand, if the buyers do not give up, we may see an increase to the medium-term support/resistance green line, which serves as the nearest resistance at the moment. On the other hand, if the buyers fail, we will likely see a drop to around yesterday’s low.
Will the 4-hour chart add some clarity?
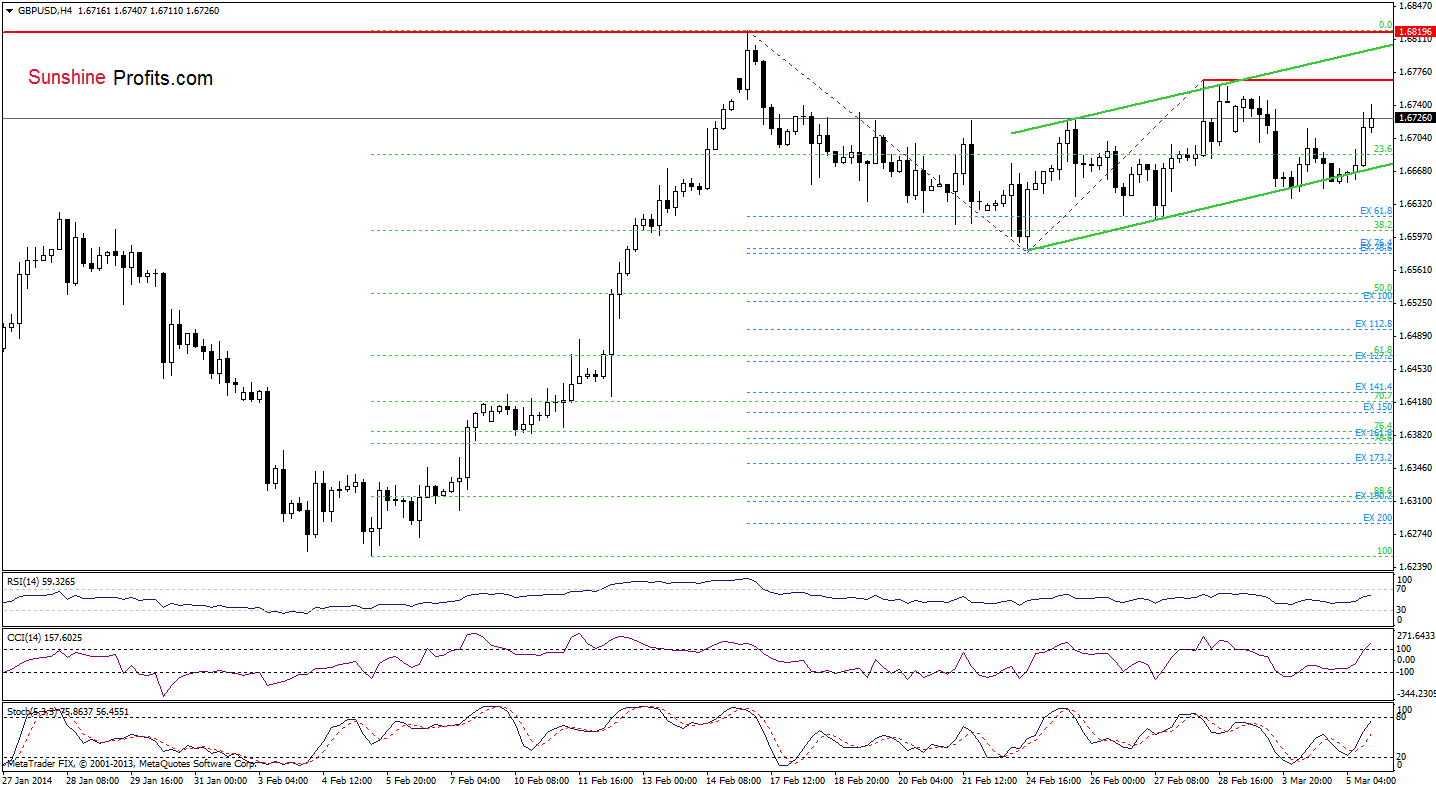
As you see on the above chart, GBP/USD rebounded after a drop to the lower border of the of the rising channel. The CCI and Stochastic Oscillator still support buyers, which suggests that we will likely see an increase to the Feb.28 high. If this resistance level is broken, we may see an upswing to the upper line of the rising channel. From this perspective, it seems that as long as there is no breakout above the upper line of this formation (or breakdown below the lower border) a bigger upswing (or downswing) is not likely to be seen.
Very short-term outlook: mixed
Short-term outlook: mixed
MT outlook: mixed
LT outlook: mixed
Trading position (short-term): In our opinion no positions are justified from the risk/reward perspective at the moment. We will keep you informed should anything change, or should we see a confirmation/invalidation of the above.
USD/JPY
Quoting our last Forex Trading Alert:
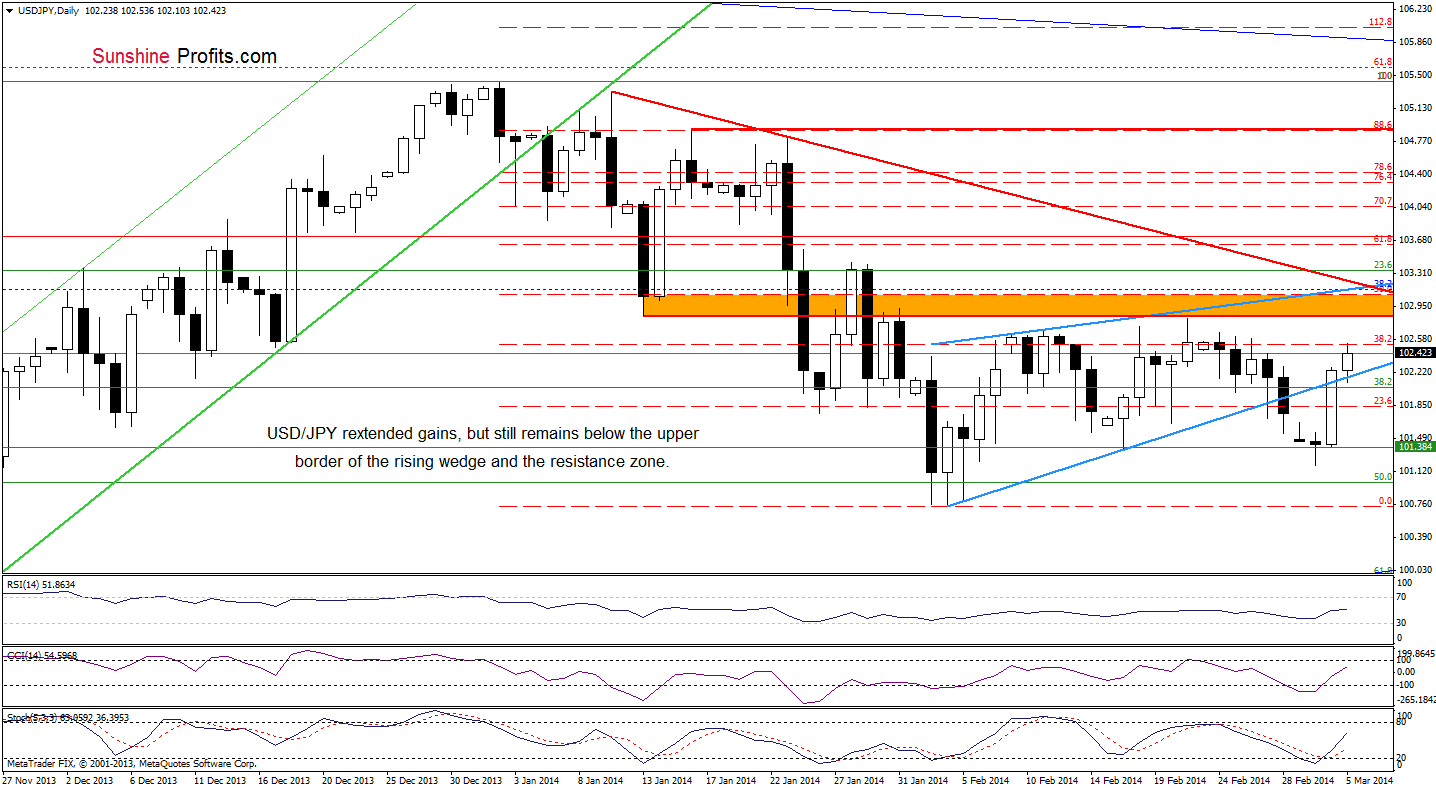
(…) the exchange rate came back to the major very short-term resistance line. If this blue line encourages sellers, we may see another attempt to reach February low. However, if it is broken, we will likely see further improvement and the first upside target will be the 38.2% Fibonacci retracement.
Yesterday, USD/JPY moved above the lower border of the lower border of the rising wedge, which triggered further improvement earlier today. As you see on the above chart, the upside target was reached. If the Fibonacci retracement is broken, we will likely see further improvement and an upward move to a resistance zone (marked with an orange rectangle). This pro growth scenario is currently reinforced by the position of the indicators (buy signals still support the bullish case). However, if this resistance level encourages sellers, we may see a pullback to the previously-broken very short-term support line.
Very short-term outlook: mixed with bullish bias
Short-term outlook: mixed with bearish bias
MT outlook: bullish
LT outlook: bearish
Trading position (short-term): In our opinion, the situation is too unclear to go short or long at the moment. So, no positions are justified from the risk/reward perspective. However, if the resistance zone, the upper line of the rising wedge and the red declining resistance line are broken, we will consider opening long positions. We will keep you informed should anything change, or should we see a confirmation/invalidation of the above.
USD/CAD
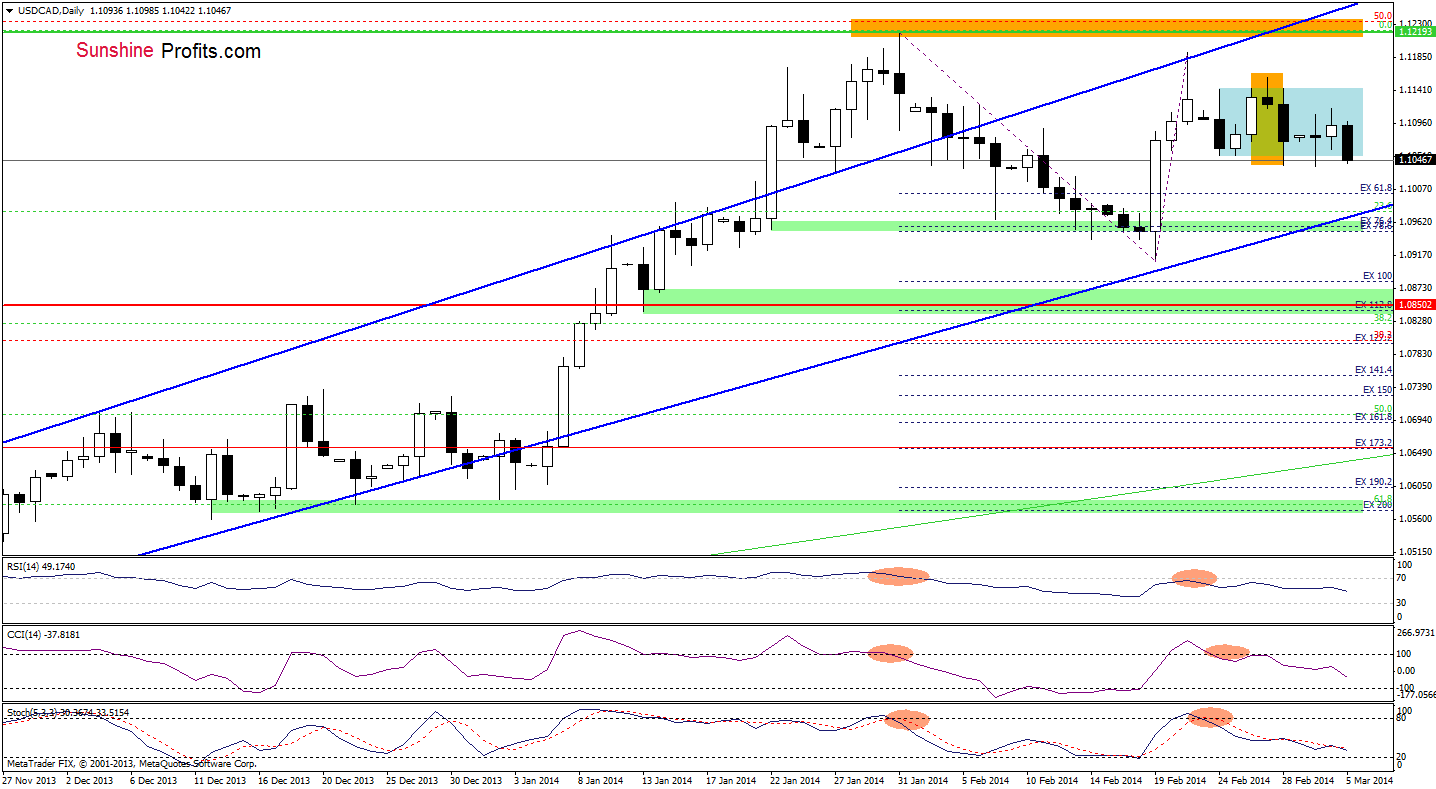
On the daily chart, we see that USD/CAD broke below the lower border of the consolidation range, which suggests that we may see further deterioration. Therefore, a bearish scenario from our last Forex Trading Alert is still up-to-date.
(…) if the exchange rate closes the day below the Feb.24 low, we may see further deterioration and a drop to the lower border of the rising trend channel, which corresponds to a support zone created by Jan.22, Feb.7 and Feb13 lows.
As a reminder, the reversal candlestick formation (an evening star) and the current position of the indicators favor sellers. However, to be more sure where this pair may move in the near future, let's look at the 4-hour chart.
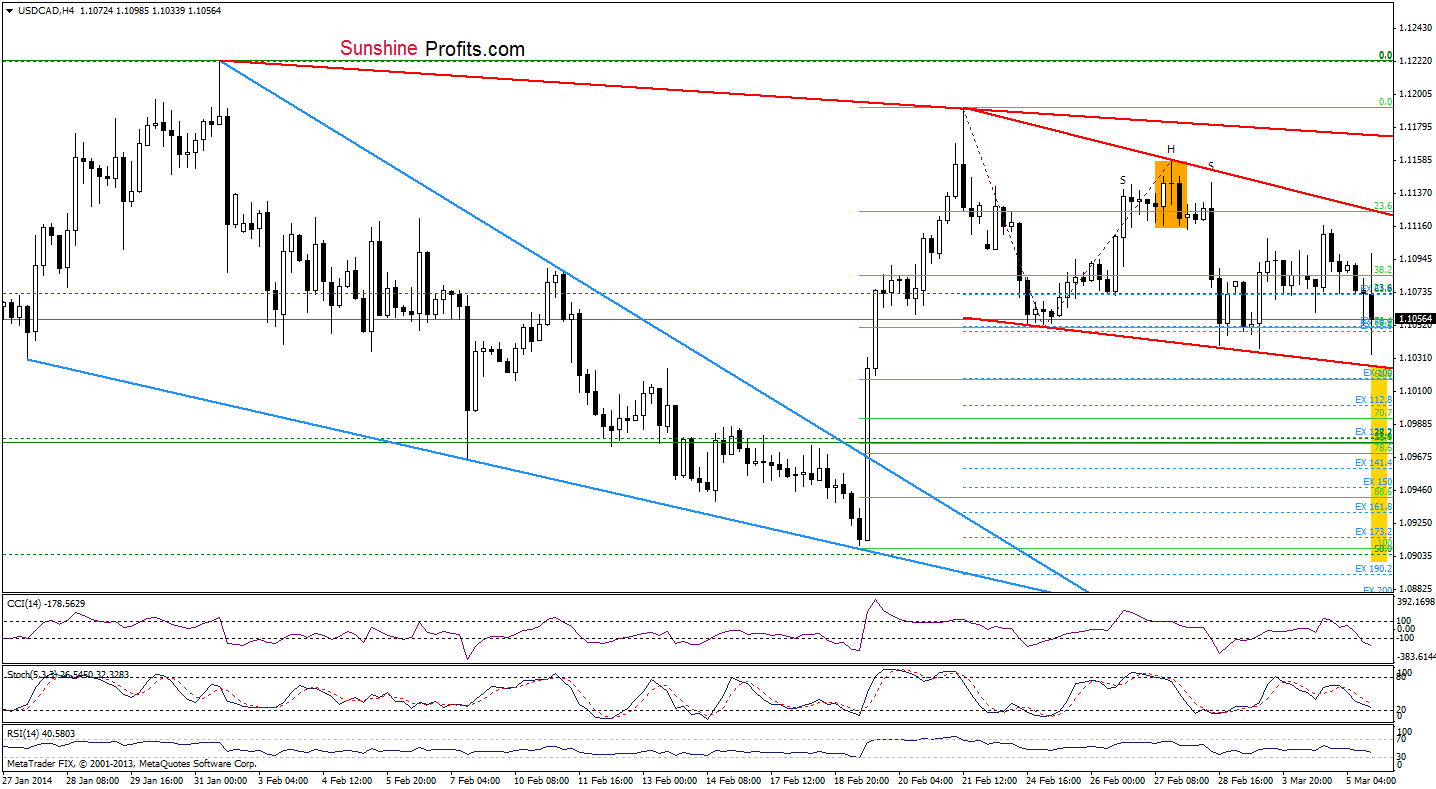
As you see on the above chart, the pair has been trading in the declining trend channel recently (marked with red). Earlier today, USD/CAD approached the lower border of this formation and rebounded slightly. If this support line encourages buyers to act, we may see a corrective upswing in the following hours (we saw a similar situation on Monday). Nevertheless, from this perspective, it seems that as long as there won’t be a breakdown below the lower border of the declining trend channel, a bigger pullback is not likely to be seen and the exchange rate will likely go back to the consolidation range seen on the daily chart.
Very short-term outlook: mixed
Short-term outlook: mixed
MT outlook: bullish
LT outlook: bearish
Trading position (short-term): In our opinion no positions are justified from the risk/reward perspective. However, if the pair drops below the lower border of the declining trend channel, we consider opening short positions. We will keep you informed should anything change, or should we see a confirmation/invalidation of the above.
USD/CHF
Quoting our previous Forex Trading Alert:
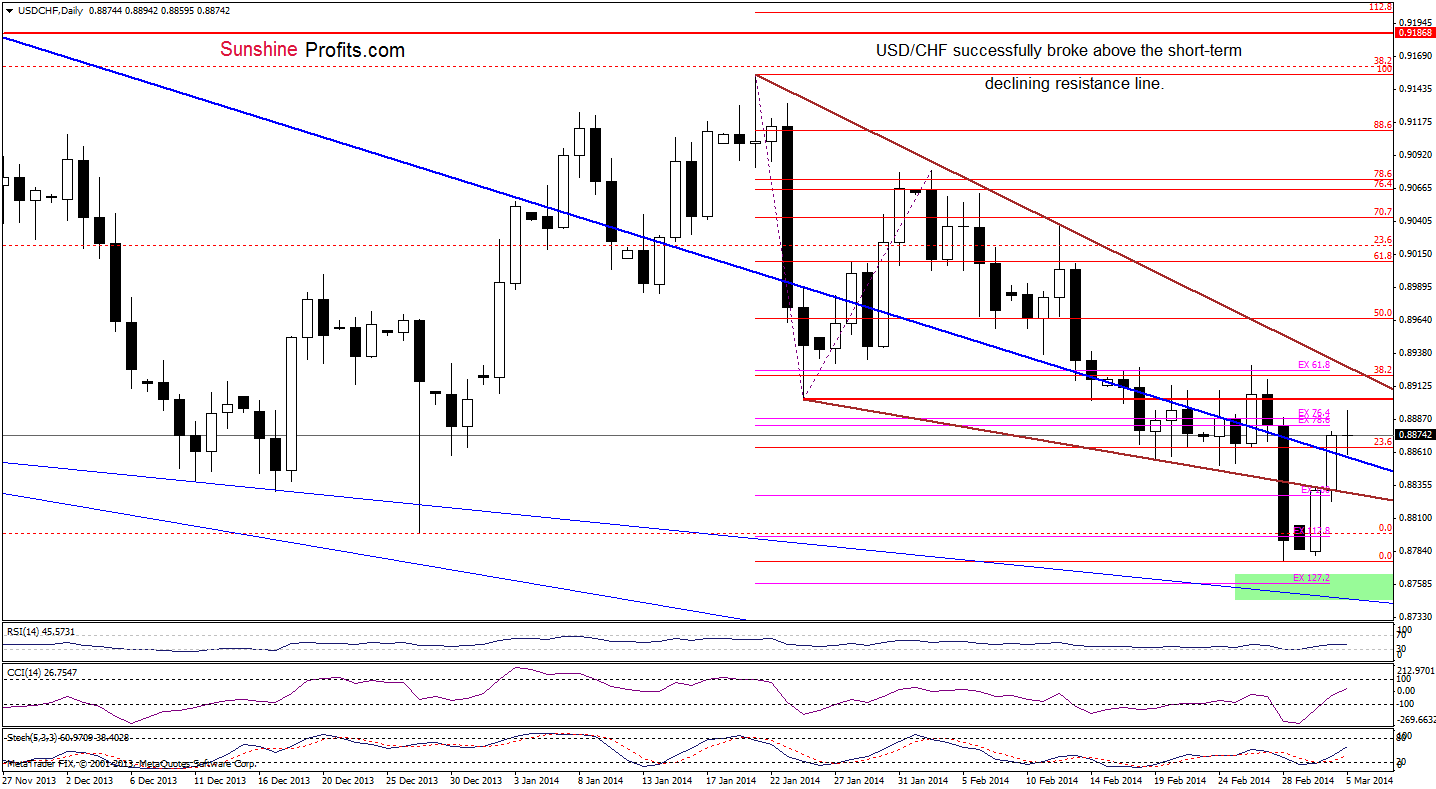
(…) USD/CHF rebounded sharply, broke above the green declining resistance line and reached the previously-broken short-term resistance line (marked with blue). If this important resistance is broken, we may see further improvement and the upside target for buyers would be the red declining resistance line.
As you see on the above chart, USD/CHF extended gains and almost reached a resistance level (created by the January low) earlier today. If it encourages sellers to act, we may see a pause or a pullback to the previously-broken short-term declining blue line, which serves as the nearest support at the moment (please note that even if the pair drops below this line, the next support – the lower border of the declining wedge is slightly below. However, if the pair breaks above the January low, we will likely see an increase to the red declining resistance line. Looking at the position of the indicators, we clearly see that buy signals remain in place, supporting buyers.
Very short-term outlook: mixed with bullish bias
Short-term outlook: bearish
MT outlook: bearish
LT outlook: bearish
Trading position (short-term): In our opinion, the situation is too unclear to go long or short at the moment. We will keep you informed should anything change, or should we see a confirmation/invalidation of the above.
AUD/USD
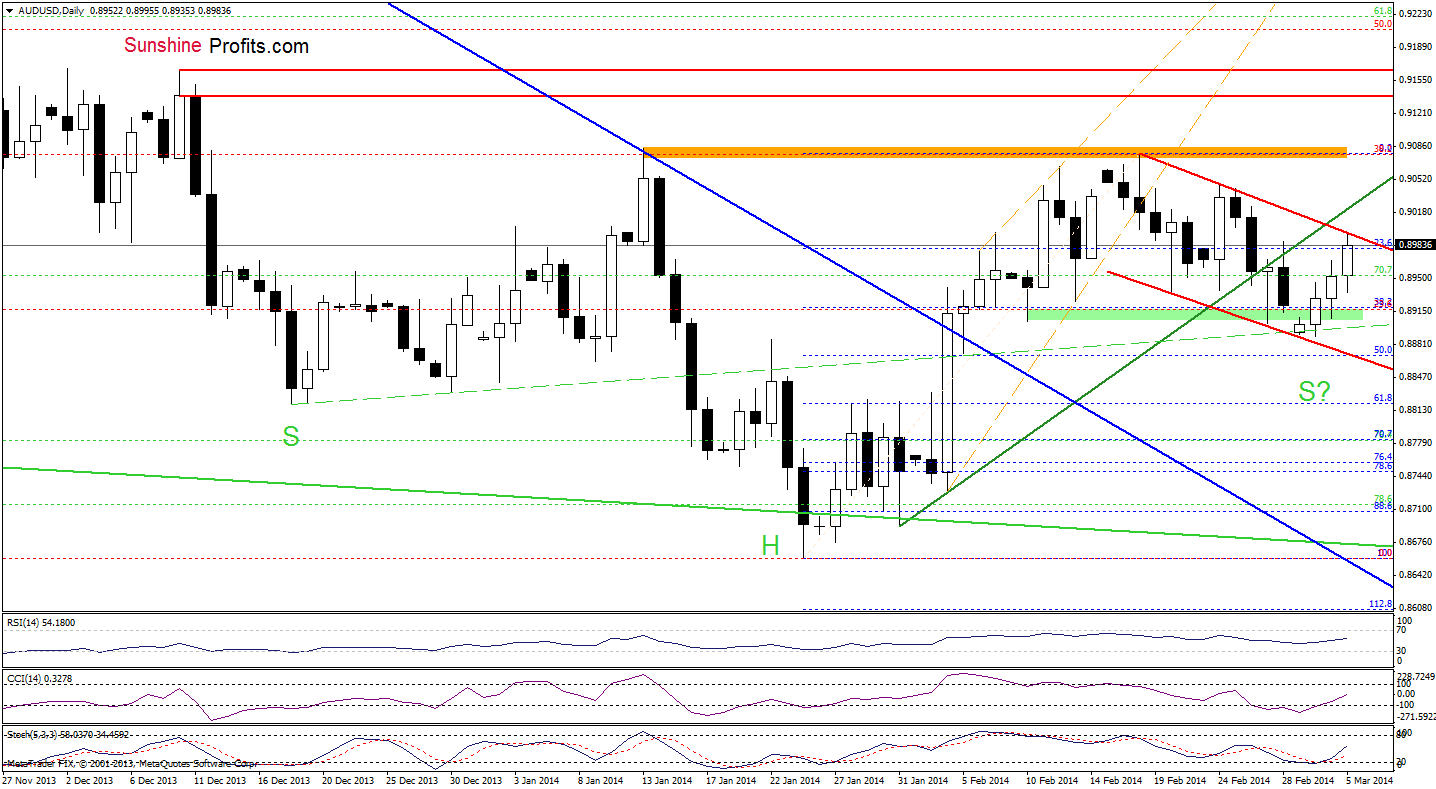
Looking at the above chart, we see that AUD/USD extended gains earlier today, but the pair still remains below the green resistance line and the upper line of a declining trend channel (marked with red). From this perspective, it seems that as long as the exchange rate remains below these lines, another attempt to move lower can’t be ruled out. However, the current position of the indicators supports buyers, which suggests that they may try to push the exchange rate higher in the near future.
Very short-term outlook: mixed with bullish bias
Short-term outlook: mixed
MT outlook: bearish
LT outlook: bearish
Trading position (short-term): In our opinion no positions are justified from the risk/reward perspective. We will keep you informed should anything change, or should we see a confirmation/invalidation of the above.
Thank you.
Nadia Simmons
Forex & Oil Trading Strategist
Forex Trading Alerts
Oil Investment Updates
Oil Trading Alerts

