
The U.S. currency declined once again against the euro and approached a seven-week low earlier today. Will today’s U.S. economic reports support the greenback later in the trading day? Before we know the answer to this question, let’s take a look at the current situation in major currency pairs. We invite you to read our today's Forex Trading Alert.
In our opinion the following forex trading positions are justified - summary:
- EUR/USD: short after a drop below 1.3684 (a stop-loss order: 1.3773, a downside price target: 1.3600)
- GBP/USD: none
- USD/JPY: none
- USD/CAD: short (stop-loss order: 1.1223, an initial price target: 1.0953)
- USD/CHF: none
- AUD/USD: none
EUR/USD
Quoting our previous Forex Trading Alert:
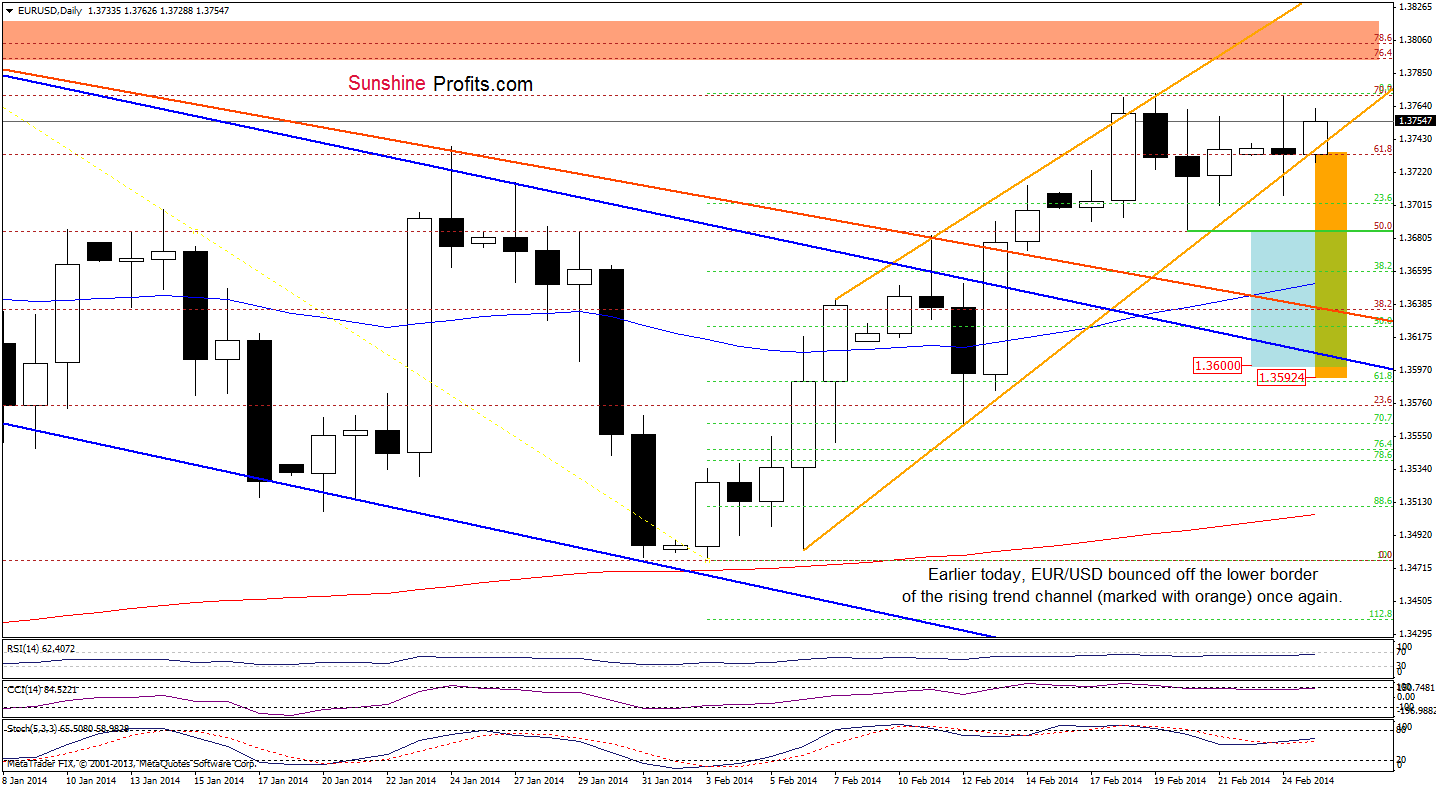
(…) the exchange rate dropped to the lower border of the rising trend channel (marked with orange) (…) if this support encourages buyers to act, we may see another attempt to climb above the February high.
As you see on the above chart, earlier today, EUR/USD bounced off the lower border of the rising trend channel and approached the February high once again. Despite this improvement, the very short-term situation hasn’t changed much as the pair remains below a resistance level created by the monthly high, which successfully stopped further growth yesterday. If history repeats oneself once again, we will likely see another attempt to break below the lower border of the rising trend channel. In this case, if this support line is successfully broken, we may see a decline even to around 1.3592, where the price target for the pattern is (please note that it corresponds to a height of the trend channel). More importantly, if the pair drops below the Feb. 20 low, we will likely see a post double top decline. In this case, the price target for the sellers will be around 1.3600 (marked with a light blue rectangle). From this perspective, in both cases we will likely see a decline below the upper border of the declining trend channel (marked with blue), which will be a strong negative signal that could trigger further deterioration.
Please note that even if the buyers manage to push the exchange higher, the space for further growth seems limited by the upper line of the rising trend channel, which is still reinforced by the medium-term support/resistance line (seen on the weekly chart that we featured yesterday).
Very short-term outlook: mixed
Short-term outlook: mixed
MT outlook: mixed
LT outlook: bearish
Trading position (short-term): In our opinion, opening short positions after a drop below 1.3684 will be a good idea justified from the risk/reward perspective. In this case, a stop-loss order will be at 1.3773 and a downside price target will be at 1.3600. We will keep you informed should anything change, or should we see a confirmation/invalidation of the above.
GBP/USD
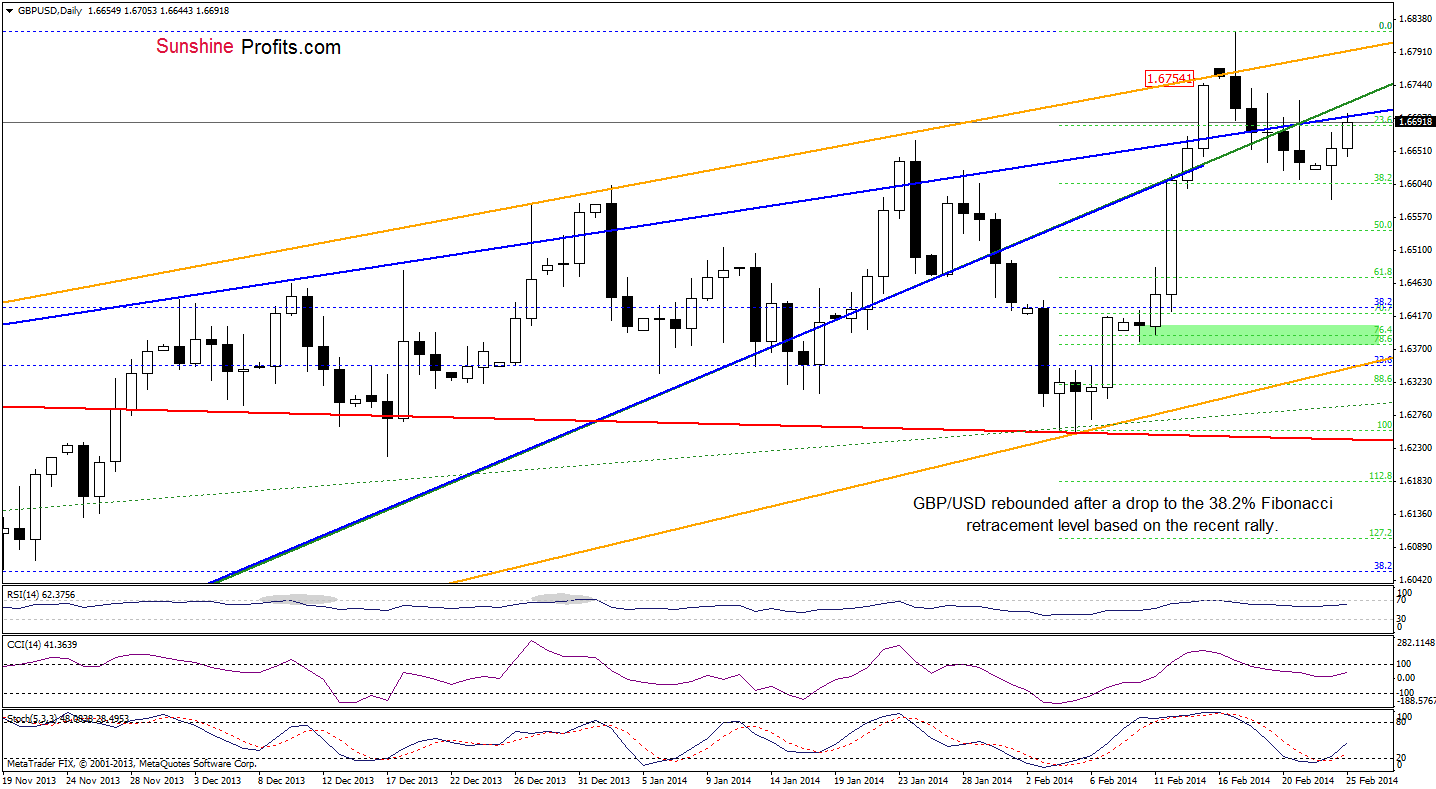
As you see on the above chart, although GBP/USD dropped below the 38.2% Fibonacci retracement level yesterday, the buyers didn’t give up and triggered an corrective upswing, which took the pair to the previously-broken lower border of the rising wedge. Similarly to what we saw in previous weeks, we should consider two scenarios at the moment. On one hand, if this resistance line is broken, we will likely see further improvement and a comeback around the February high (this scenario is reinforced by a buy signal generated by the Stochastic Oscillator). However, if this strong resistance line encourages sellers to act, we will likely see another attempt to move below the 38.2% Fibonacci retracement. Please note that this scenario is reinforced by the fact that GBP/USD confirmed a breakdown below this medium-term resistance line in recent days (we saw four consecutive closes). Connecting the dots, the situation is unclear.
Very short-term outlook: mixed
Short-term outlook: mixed
MT outlook: mixed
LT outlook: mixed
Trading position (short-term): In our opinion no positions are justified from the risk/reward perspective at the moment as the current situation is unclear. We will keep you informed should anything change, or should we see a confirmation/invalidation of the above.
USD/JPY
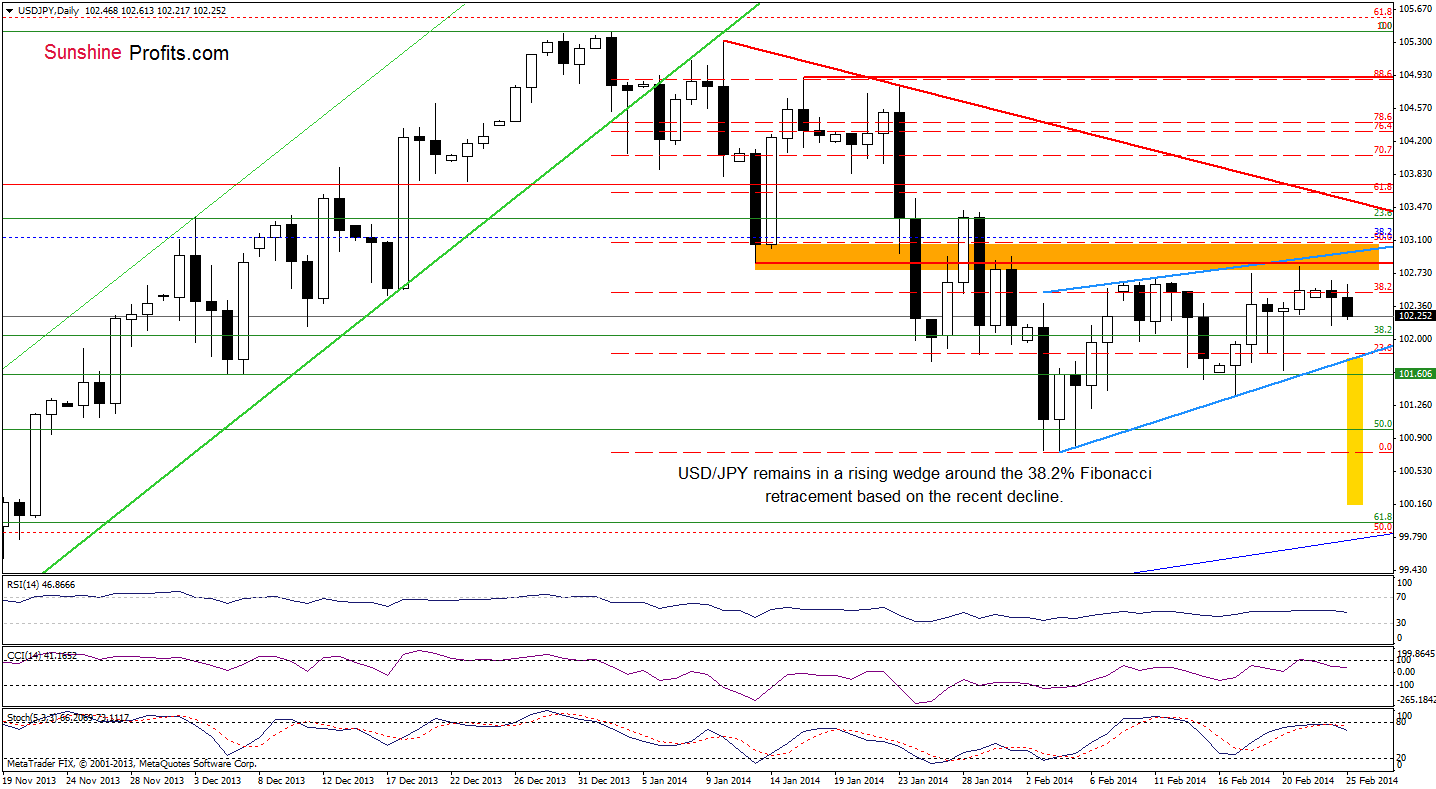
As you see on the above chart, the situation hasn’t changed much as USD/JPY remains around the 38.2% Fibonacci retracement level (based on the recent decline). So, what we wrote in yesterday’s Forex Trading Alert is still up-to-date.
(…) the pair is still trading in the rising wedge (marked with light blue). From this perspective, as long as there is no breakout above the upper line (or a breakdown below the lower border) a bigger upswing (or downswing) is not likely to be seen. (…) the upper line is currently reinforced by a resistance zone created by the Jan.13 low and Jan.31 high (marked with orange). If this resistance is broken, we will likely see an upward move to at least the declining resistance line based on the Jan.10 and Jan.23 highs (marked with red). However, if this strong resistance encourages sellers to act, we will see a drop to the lower border of the rising wedge in the near future. If the pair drops below this important support line, we will probably see a re-test of the strength of the February low. At this point it’s worth noting that the price target after a breakdown is a bit lower than the monthly low and we marked it with a yellow rectangle. Looking at the position of the indicators, we see that the CCI generated a sell signal and Stochastic Oscillator is close to doing it. So, a bearish scenario is more likely at the moment.
Very short-term outlook: mixed
Short-term outlook: mixed with bearish bias
MT outlook: bullish
LT outlook: bearish
Trading position (short-term): In our opinion, the situation is too unclear to go short or long at the moment. So, no positions are justified from the risk/reward perspective. We will keep you informed should anything change, or should we see a confirmation/invalidation of the above.
USD/CAD
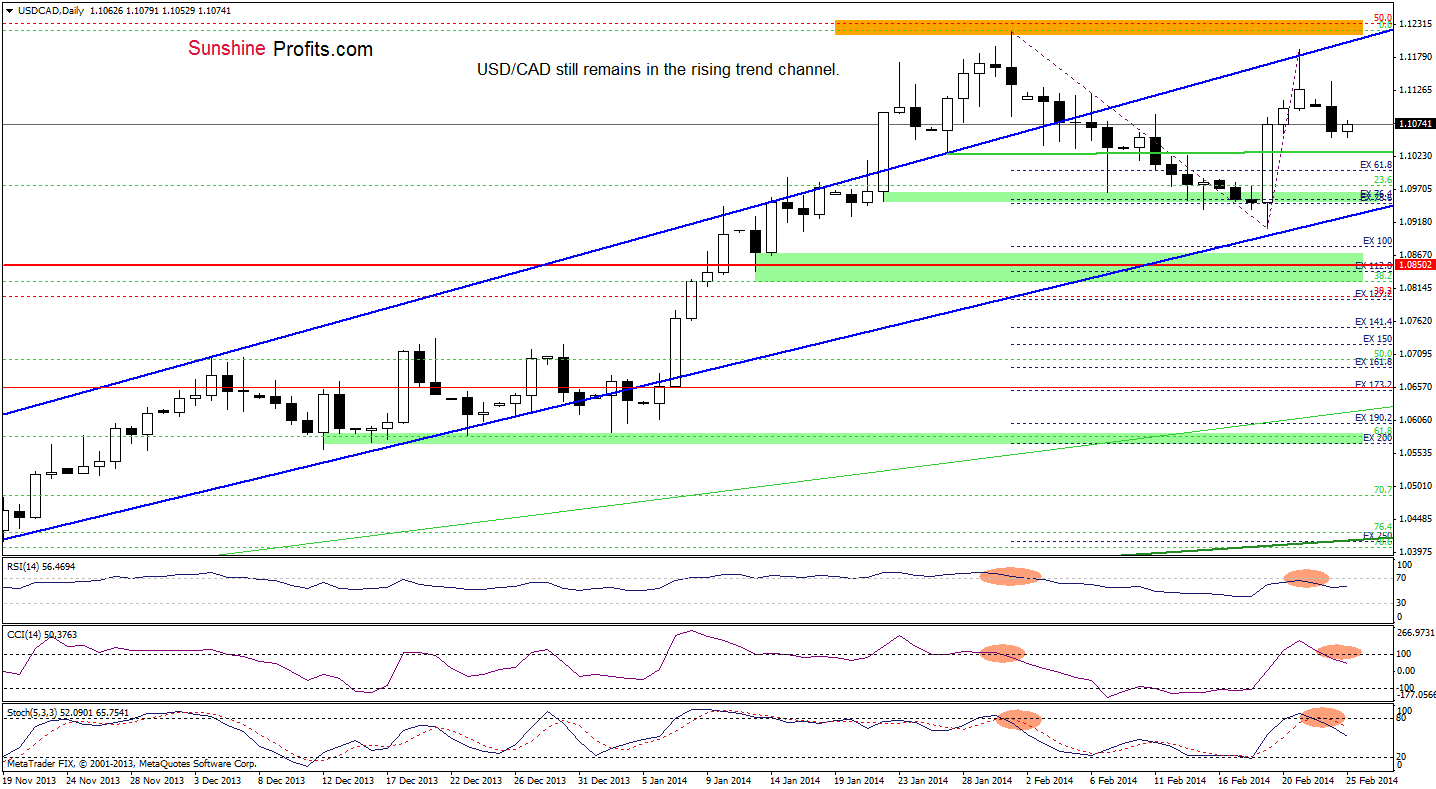
As you see on the daily chart, the situation hasn’t changed much. Although, the pair moved higher earlier today, the size of this upswing is still much smaller than yesterday’s decline. So, what we wrote in our previous Forex Trading Alert remains up-to-date.
(…) all indicators generated sell signals (…) we saw similar price action at the end of January. If history repeats itself once again, we will likely see further deterioration in the coming day (or days) (…) the downside price target for the sellers would be the lower line of the rising trend channel (currently around 1.0923).
Very short-term outlook: mixed with bearish bias
Short-term outlook: mixed
MT outlook: bullish
LT outlook: bearish
Trading position (short-term): Short. Stop-loss order: 1.1223, and an initial price target: 1.0953. We will keep you informed should anything change, or should we see a confirmation/invalidation of the above.
USD/CHF
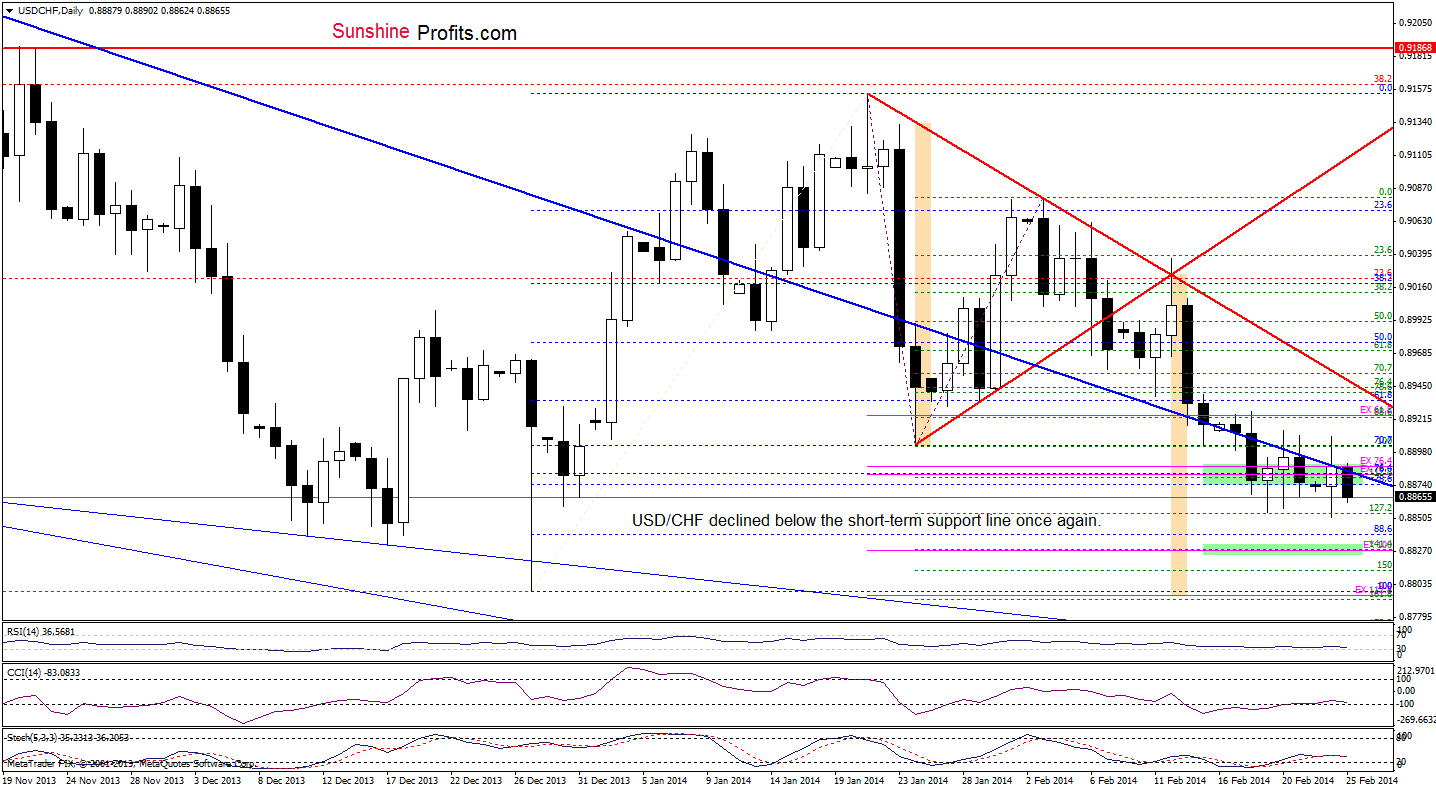
Looking at the above chart, we see that the situation has deteriorated as USD/CHF extended losses and declined below the short-term declining support/resistance line (marked with blue) once again. Additionally, the pair dropped below a support zone (marked with green), which suggests that we will likely see a re-test of the strength of the February low in the nearest future. If this support level holds, we may see another attempt to invalidate the breakdown below the major resistance line. However, if the buyers fail and USD/CHF drops below the monthly low, we will likely see further deterioration and the downside price target for the sellers will be the next support zone (marked with green) created by the 100% Fibonacci projection (based on the Jan.21 and Feb.3 highs and the Jan.24 low) and 141.4% Fibonacci extension (based on the Jan.-Feb. corrective upward move). However, taking into account the fact that the CCI and Stochastic Oscillator reversed, we should still keep in mind what we wrote in our Forex Trading Alert posted on Feb.13, 2014:
(…) the declining resistance line (based on the Jan.21 and Feb.3 highs) and the support line based on the Jan.24 and Jan.29 lows (…) create a triangle. According to theory, a drop below the lower border of the triangle may trigger further deterioration and the downside target for the pattern would be around the December low.
Very short-term outlook: bearish
Short-term outlook: mixed with bearish bias
MT outlook: bearish
LT outlook: bearish
Trading position (short-term): In our opinion, the situation is too unclear to go long or short at the moment. We will keep you informed should anything change, or should we see a confirmation/invalidation of the above.
AUD/USD
Citing our last Forex Trading Alert:
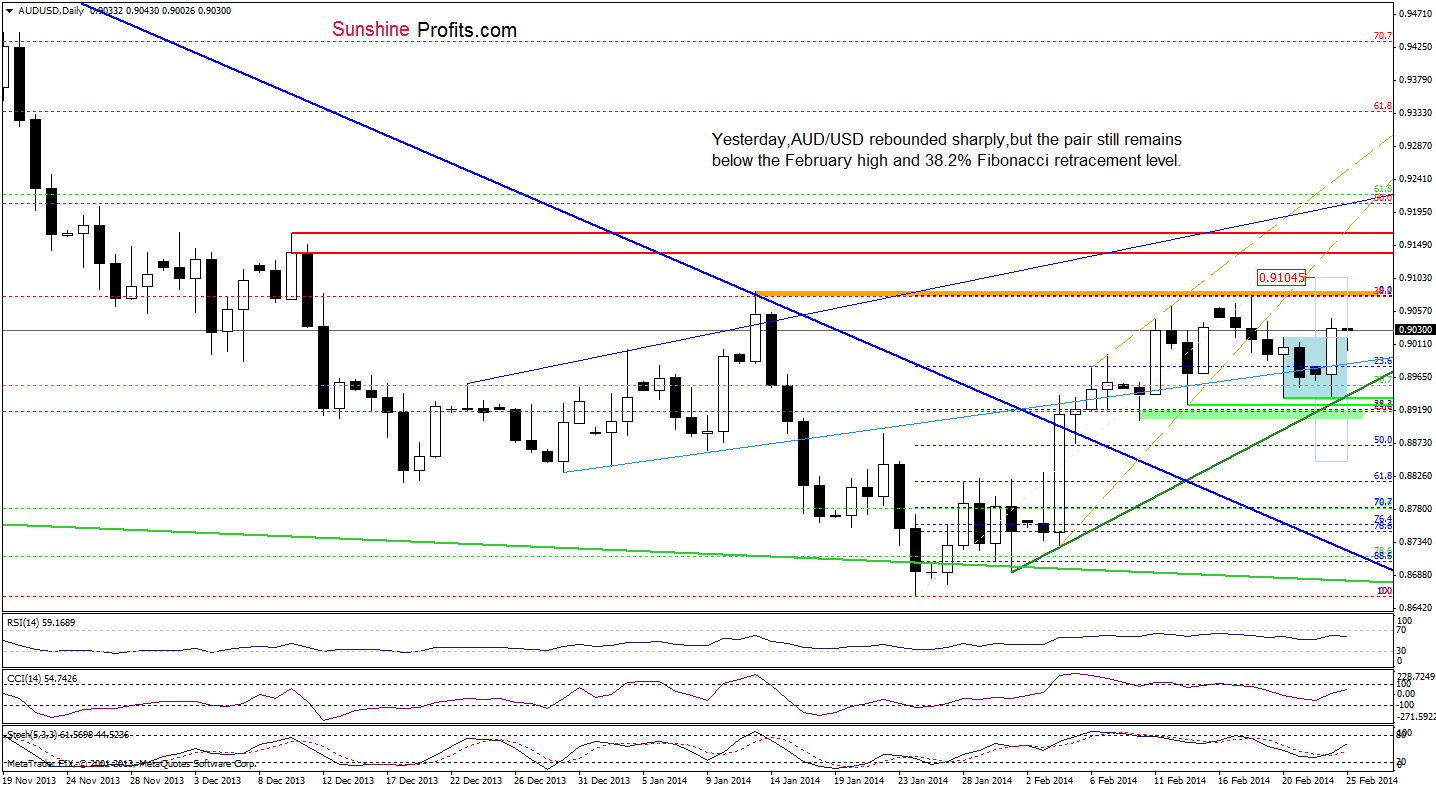
(…) AUD/USD (…) approached the very short-term rising support line (marked with dark green). If this support area encourages buyers to act, we may see a corrective upswing in the coming day (or days). Additionally, if the pair increases above the upper line of a consolidation range (marked with a light blue rectangle), we could see a post double bottom rally. If this is the case, the upside price target would be slightly above the February high (around 0.9104). Nevertheless, before the buyers realize this pro growth scenario they will have to push the exchange rate above the 38.2% Fibonacci retracement level, which successfully stopped increases earlier this month(…) please note that the current correction is similar to the previous one, which means that the very short-term uptrend is not threatened at the moment.
As you see on the daily chart, after a drop to the very short-term rising support line (which remains the nearest major support) AUD/USD rebounded sharply and moved above the upper line of the consolidation range. Therefore, the above bullish scenario is still up-to-date. At this point, it’s worth noting that the Stochastic Oscillator generated a buy signal, supporting the bullish case.
Very short-term outlook: mixed with bullish bias
Short-term outlook: mixed with bullish bias
MT outlook: bearish
LT outlook: bearish
Trading position (short-term): In our opinion, opening long positions at the moment is not a good idea as AUD/USD remains below a strong resistance zone created by the February high and the 38.2% Fibonacci retracement level. Taking this fact into account, the space for further growth seems limited. We will keep you informed should anything change, or should we see a confirmation/invalidation of the above.
Thank you.
Nadia Simmons
Forex & Oil Trading Strategist
Forex Trading Alerts
Oil Investment Updates
Oil Trading Alerts

