
Earlier today, the U.S. dollar was trading slightly above a seven-week low against the euro as yesterday’s weaker-than-expected U.S. data pushed the U.S. currency lower. However, the greenback moved higher against the British pound after data showed that the U.K. unemployment rate unexpectedly ticked higher (while analysts had expected that the jobless rate remain unchanged). Will today’s minutes from the Federal Reserve’s January meeting support the U.S. currency later in the trading day? Before we know the answer to this question, let’s take a look at the current situation in major currency pairs. We invite you to read our today's Forex Trading Alert.
In our opinion the following forex trading positions are justified - summary:
EUR/USD
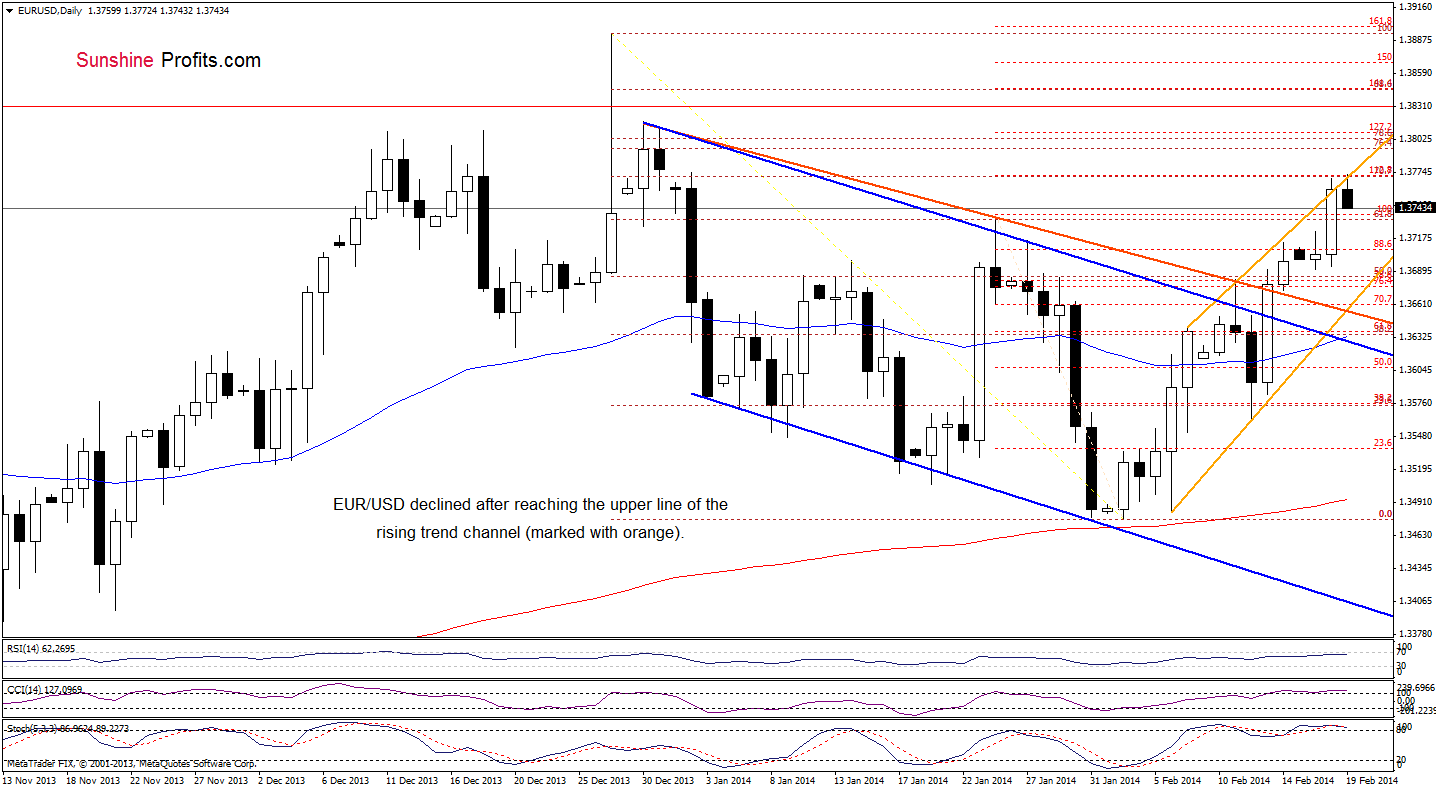
Quoting our last Forex Trading Alert:
(…) EUR/USD extended gains and (…) reached the upper line of the rising trend channel (marked with orange). Taking this fact into account, and combining with the current position of the indicators (the CCI and Stochastic Oscillator are overbought, while the RSI is at its highest level since the end of December), it seems that a correction is just around the corner.
Looking at the above chart, we see that the pair gave up the gains and declined below the upper line of the rising trend channel. Despite this drop, EUR/USD still remains above the Jan.24 high, which serves as support. However, if it is broken and indicators generate sell signals, we will likely see a bigger pullback and the first downside target will be the lower line of the rising trend channel (marked with orange).
Very short-term outlook: bullish
Short-term outlook: mixed
MT outlook: mixed
LT outlook: bearish
Trading position (short-term): In our opinion no positions are justified from the risk/reward perspective at the moment. However, if the exchange rate invalidates breakouts above the orange declining line and the upper line of the declining trend channel, we will likely consider opening short positions. We will keep you informed should anything change, or should we see a confirmation/invalidation of the above.
GBP/USD
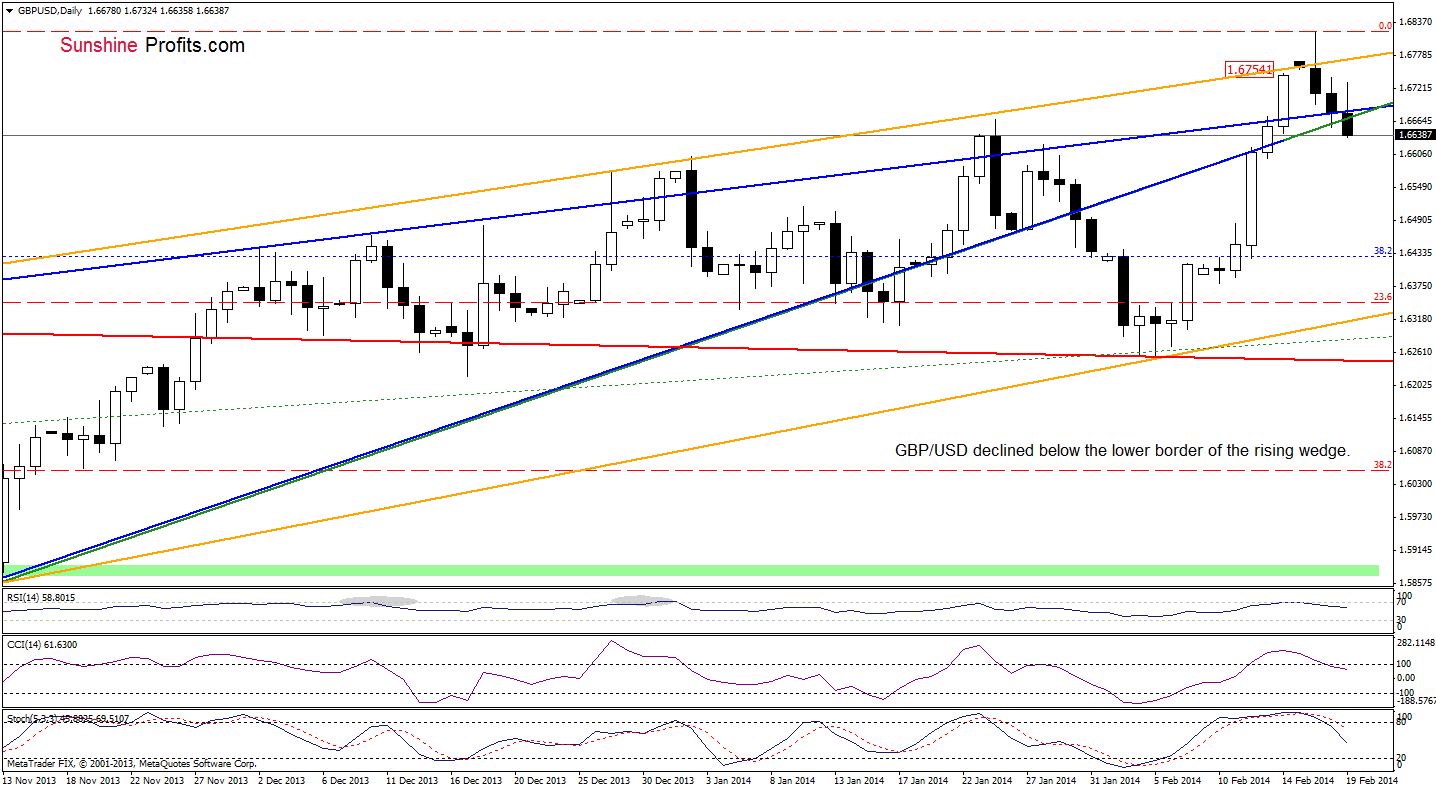
In our previous Forex Trading Alert, we wrote:
(…) GBP/USD gave up the gains and invalidated a breakout above the medium-term orange resistance line yesterday (…) this bearish signal triggered further deterioration and the pair declined to the lower border of the rising wedge earlier today. (…) if it is broken, we will likely see a correction and the downside target will be the 23.6% Fibonacci retracement level based on the entire Jun-Feb. rally (around 1.6347).
As you see on the above chart, GBP/USD declined below the lower border of the rising wedge, which is a bearish signal. Additionally, all indicators generated sell signals, which suggests that further deterioration is just around the corner. If the pair doesn’t invalidate the breakdown and closes the day below this important support/resistance line, we will likely see a bigger correction and the first downside target will be around 1.6435 (slightly above the Feb.12 low).
Very short-term outlook: mixed
Short-term outlook: mixed with bullish bias
MT outlook: mixed
LT outlook: mixed
Trading position (short-term): In our opinion no positions are justified from the risk/reward perspective at the moment. Nevertheless, if the pair closes the day below the lower border of the rising wedge, we will consider opening short positions. We will keep you informed should anything change, or should we see a confirmation/invalidation of the above.
USD/JPY
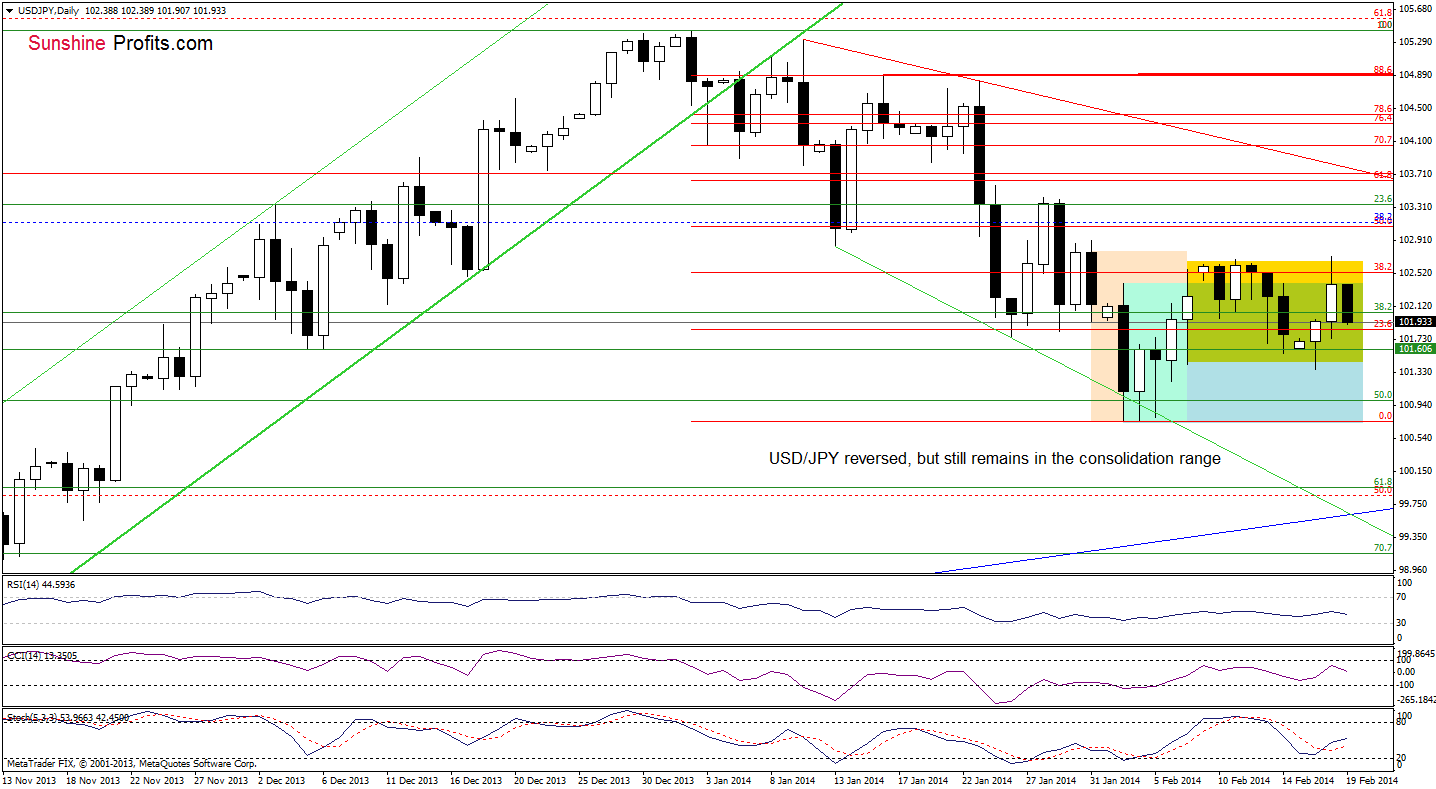
Quoting our last Forex Trading Alert:
(…) USD/JPY (…) reached the upper border of the consolidation range and the 38.2% Fibonacci retracement level. If this resistance zone encourages sellers to act we may see another pullback (similarly to the situation that we saw in the previous week). However, if it is broken, the pair may extend increases and climb to the next Fibonacci retracement level.
As you see on the above chart, the pair gave up the gains and declined earlier today. From this perspective, it seems that we may see further deterioration (just like a week ago) and the downside target for the sellers would be the Feb.17 low. Please note that even if it is broken, the next support level is slightly below (the Feb.6 low).
Very short-term outlook: mixed
Short-term outlook: mixed with bearish bias
MT outlook: bullish
LT outlook: bearish
Trading position (short-term): In our opinion, the situation is too unclear to go short or long at the moment. So, no positions are justified from the risk/reward perspective. We will keep you informed should anything change, or should we see a confirmation/invalidation of the above.
USD/CAD
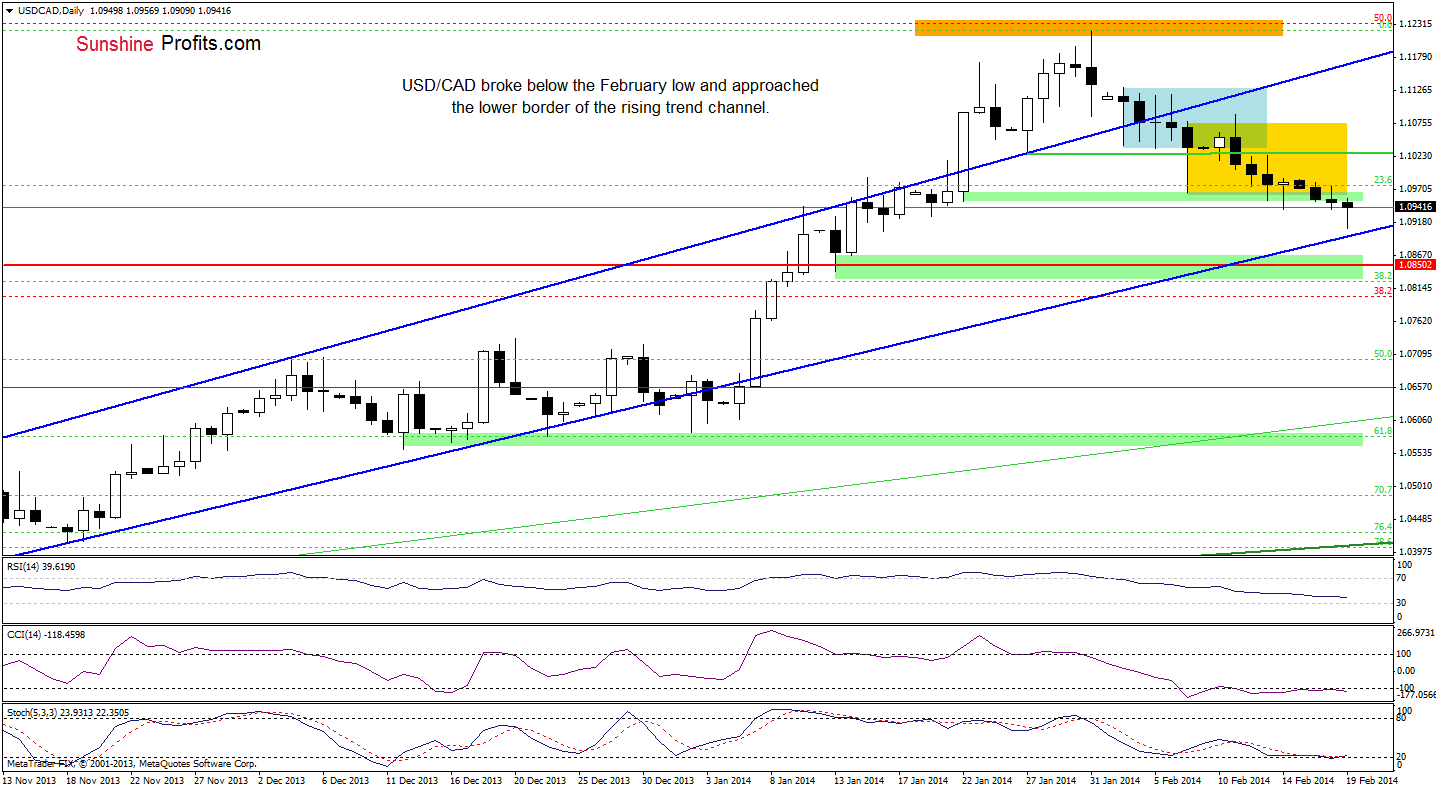
On the above chart, we see that USD/CAD extended losses and declined below the Jan.22 low once again. With this downswing, the pair also approached the lower border of the trend channel. The proximity to this important support line encouraged buyers to act and the exchange rate rebounded earlier today. Despite this small upswing, USD/CAD still remains below a resistance level created by the Jan.22 low, which is a bearish signal. If the buyers do not manage to push the pair higher, we will likely see another drop to the major support line. If it is broken, the next downside target for the sellers will be a strong support zone created by the 38.2% Fibonacci retracement level (based on the entire Sept.-Jan. rally), the Jan. 13 low and the 2010 high. Nevertheless, we should keep in mind that the CCI and Stochastic Oscillator are oversold (additionally, the latter generated a buy signal), which suggests that may see a bigger upswing in the coming days.
Very short-term outlook: mixed
Short-term outlook: mixed
MT outlook: bullish
LT outlook: bearish
Trading position (short-term): From today’s point of view, even if the pair extended losses, the lower border of the trend channel will likely stop further deterioration. Therefore, in our opinion opening short positions is not justified from the risk/reward perspective. On the other hand, it’s too early to open long positions as the pair remains below the previous low. We will keep you informed should anything change, or should we see a confirmation/invalidation of the above.
USD/CHF
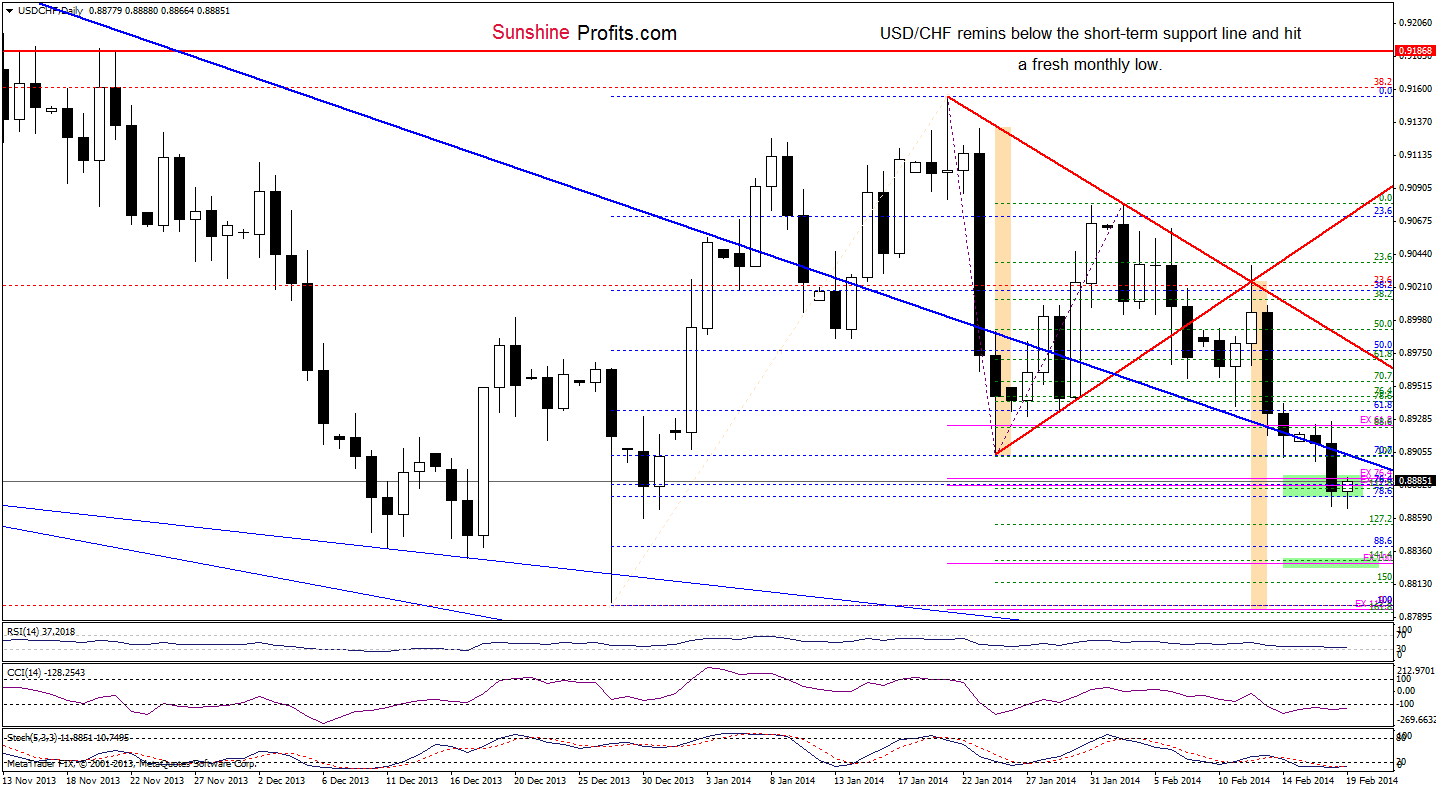
As you see on the above chart, the situation hasn’t changed much as USD/CHF remains in a support zone created by the 76.4%, 78.6% Fibonacci retracement levels (based on the Dec.-Jan. rally) and the 76.4%, 78.6% Fibonacci projections (marked with a green rectangle on the above chart). From this perspective, what we wrote in our last Forex Trading Alert remains up-to-date.
(…) if this support encourages buyers to act, we may see a corrective upswing to the short-term declining support line. At this point, it’s worth mentioning that the current position of the indicators and a positive divergence between the CCI and the exchange rate support a pro growth scenario. Nevertheless, we should still keep in mind that the short-term declining support line is broken and serves as resistance at this moment. Taking this fact into account, we may see further deterioration if the pair declines below the support zone. In this case, the next downside target for the sellers would be around 0.8828, where the 100% Fibonacci projection (based on the Jan.21, Feb.3 highs and Jan.24 low) is.
Very short-term outlook: bearish
Short-term outlook: mixed
MT outlook: bearish
LT outlook: bearish
Trading position (short-term): In our opinion, the situation is too unclear to go short or long as the pair reached its downside target. So, no positions are justified from the risk/reward perspective. We will keep you informed should anything change, or should we see a confirmation/invalidation of the above.
AUD/USD
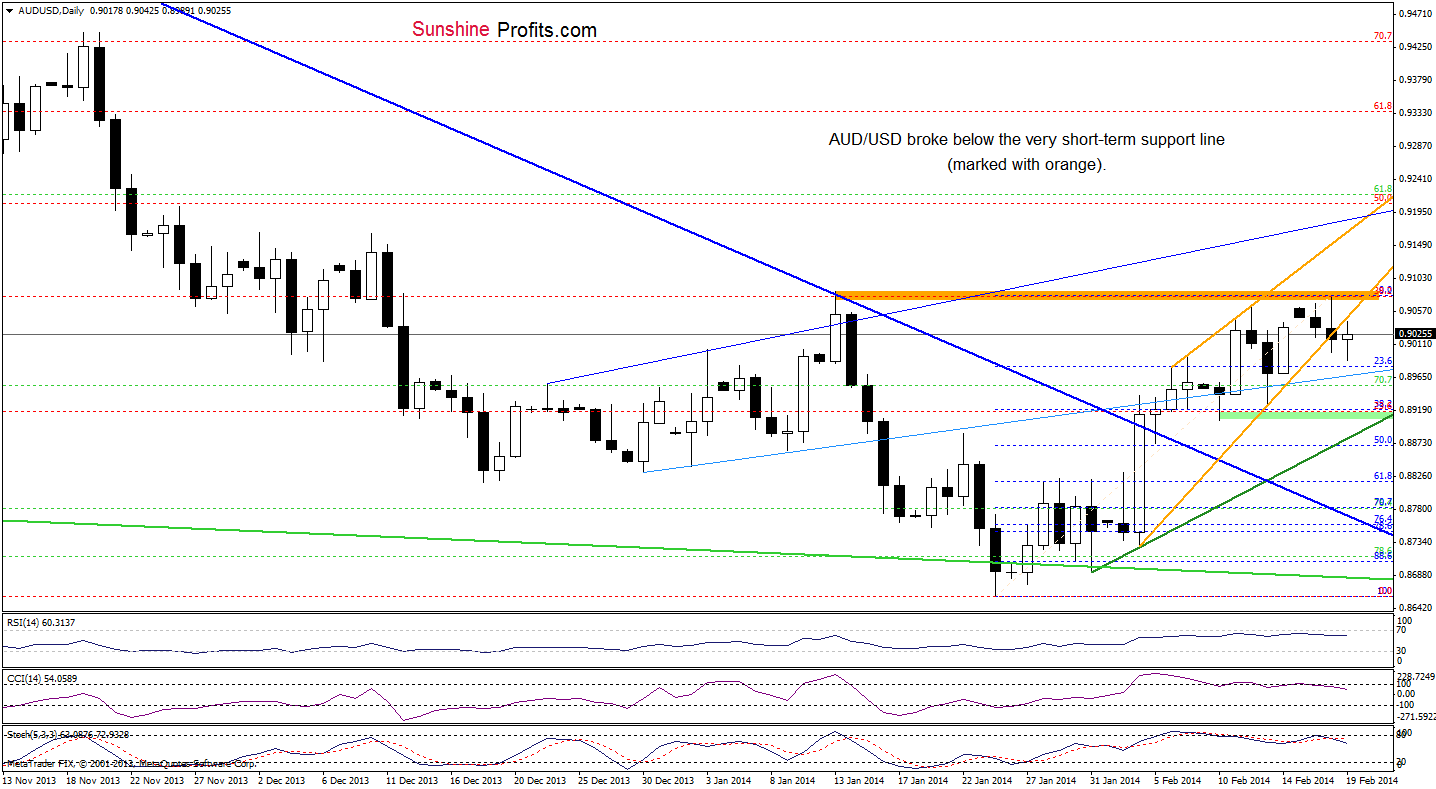
Looking at the above chart, we see that AUD/USD moved lower and broke below the very short-term support line (marked with orange). Despite this drop, the current correction is still smaller than the previous one, which means that the very short-term uptrend is not threatened at the moment. Taking only this fact into account, we may see another attempt to break above a resistance zone created by the 38.2% Fibonacci retracement and the January high. However, if the buyers fail and the pair doesn’t come back above the very short-term support line, we will likely see further deterioration and the initial downside target will be a support zone created by the Feb. 10 and Feb.13 lows and the 38.2% Fibonacci retracement level based on the recent rally. Please note that this scenario is reinforced by the current position of the indicators, which suggests that a bigger pullback is just around the corner.
Very short-term outlook: mixed
Short-term outlook: mixed with bullish bias
MT outlook: bearish
LT outlook: bearish
Trading position (short-term): In our opinion, if the pair drops below the February 10 low, we might consider opening short positions. However, as long as AUD/USD remains between above this level and the 38.2% Fibonacci retracement level, no positions are justified from the risk/reward perspective. We will keep you informed should anything change, or should we see a confirmation/invalidation of the above.
Thank you.
Nadia Simmons
Forex & Oil Trading Strategist
Forex Trading Alerts
Oil Investment Updates
Oil Trading Alerts

