
The greenback declined against major currencies after the New York Federal Reserve's Empire State index of manufacturing activity for February dropped to 4.48 this month from a 20-month high of 12.51 in January (while analysts had expected the index to decline to 9.00). What impact did it have on major currency pairs? If you want to know our take on this question, we invite you to read our today's Forex Trading Alert.
In our opinion the following forex trading positions are justified - summary:
EUR/USD
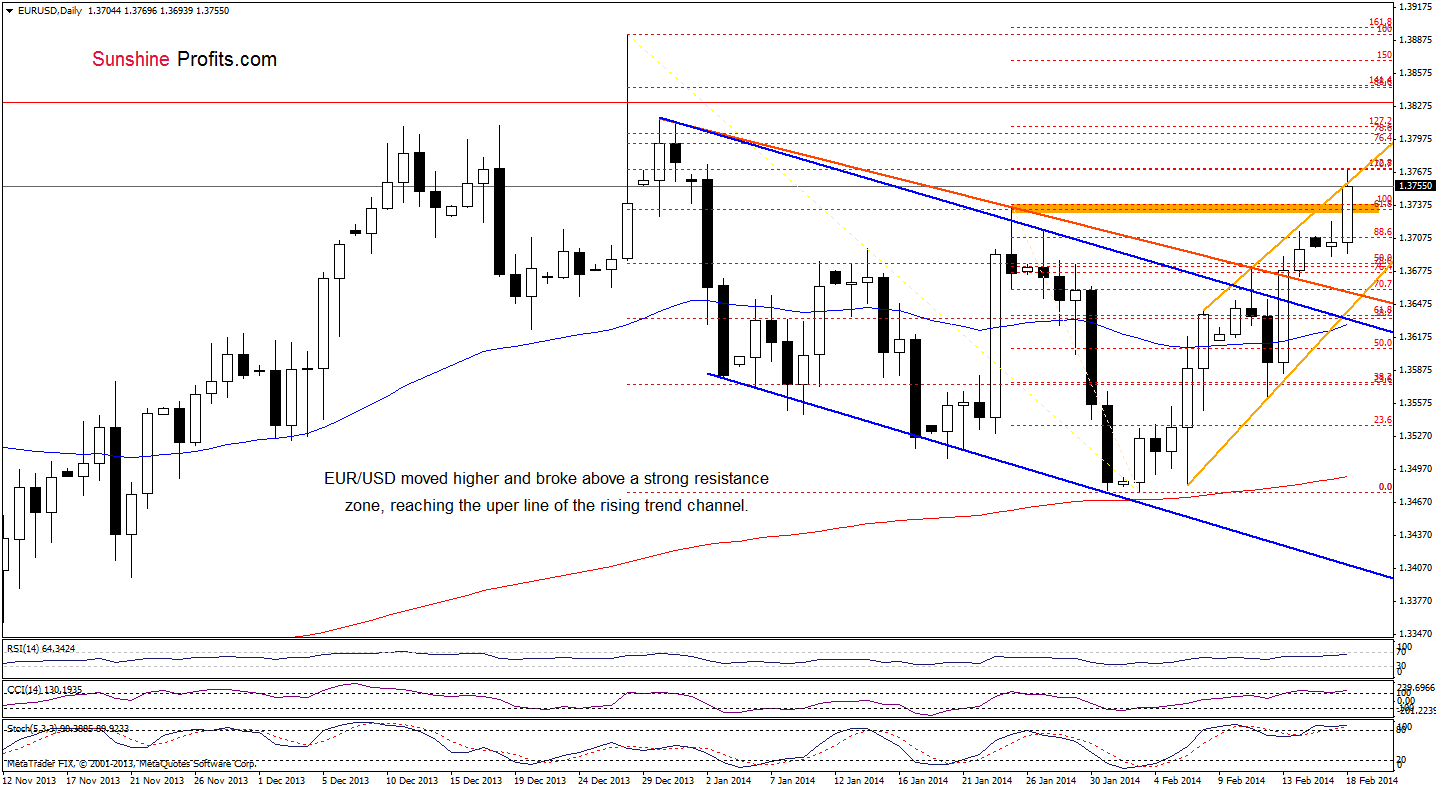
Looking at the above chart, we see that the situation has improved significantly earlier today as EUR/USD extended gains and broke above a resistance zone created by the Jan.24 high and the 61.8% Fibonacci retracement (based on the entire Dec.-Feb. decline). As you see on the daily chart, with this upswing the exchange rate reached the upper line of the rising trend channel (marked with orange). Taking this fact into account, and combining with the current position of the indicators (the CCI and Stochastic Oscillator are overbought, while the RSI is at its highest level since the end of December), it seems that a correction is just around the corner.
Very short-term outlook: bullish
Short-term outlook: mixed
MT outlook: mixed
LT outlook: bearish
Trading position (short-term): In our opinion no positions are justified from the risk/reward perspective at the moment. However, if the exchange rate invalidates breakouts above the orange declining line and the upper line of the declining trend channel, we will likely consider opening short positions. We will keep you informed should anything change, or should we see a confirmation/invalidation of the above.
GBP/USD
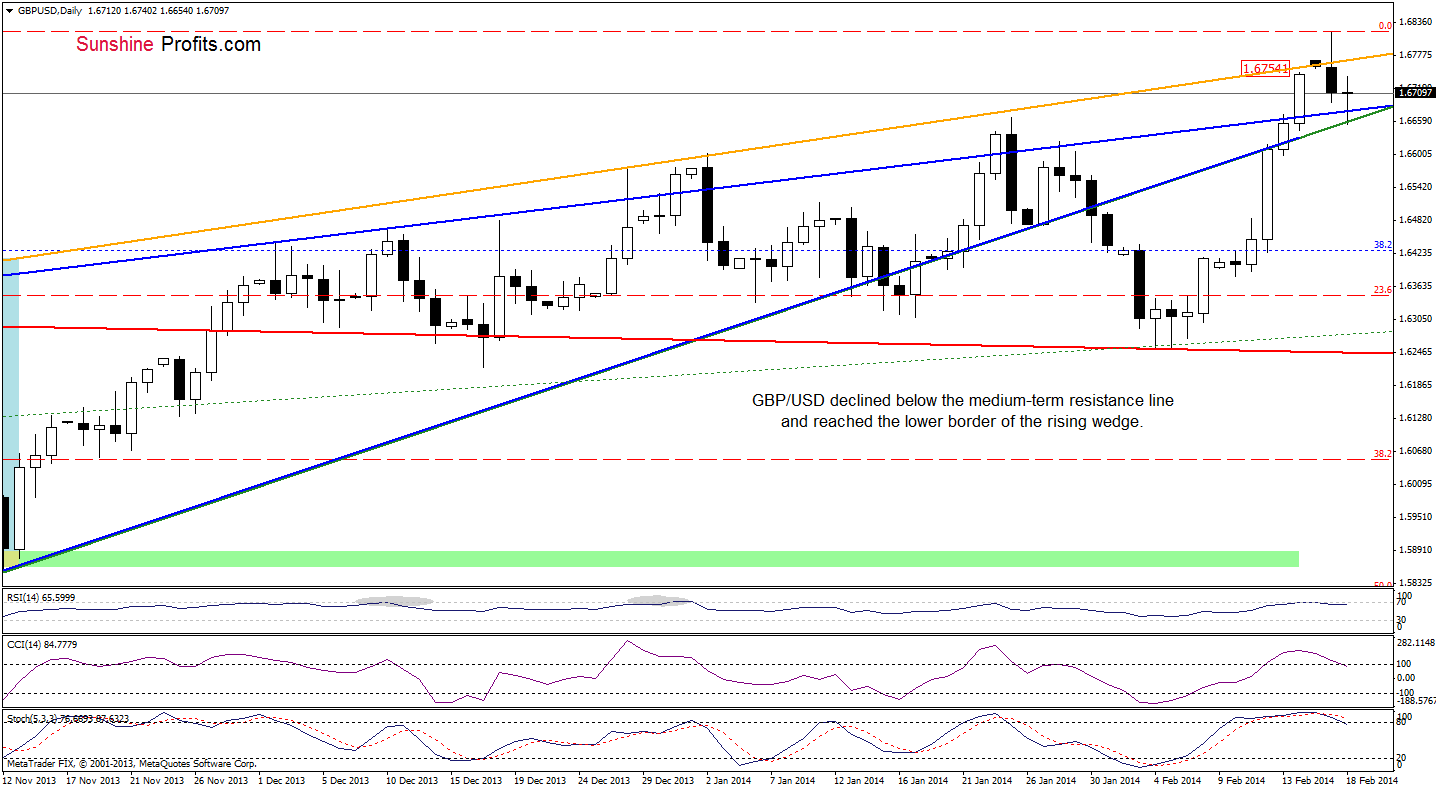
Looking at the above chart, we see that GBP/USD gave up the gains and invalidated a breakout above the medium-term orange resistance line yesterday. As you see on the daily chart, this bearish signal triggered further deterioration and the pair declined to the lower border of the rising wedge earlier today. If this support holds and encourages buyers to act, we may see another upswing above the major resistance line. However, if it is broken, we will likely see a correction and the downside target will be the 23.6% Fibonacci retracement level based on the entire Jun-Feb. rally (around 1.6347).
Very short-term outlook: bullish
Short-term outlook: mixed with bullish bias
MT outlook: mixed
LT outlook: mixed
Trading position (short-term): In our opinion no positions are justified from the risk/reward perspective. Nevertheless, if the pair declines below the lower border of the rising wedge, we will consider opening short positions. We will keep you informed should anything change, or should we see a confirmation/invalidation of the above.
USD/JPY
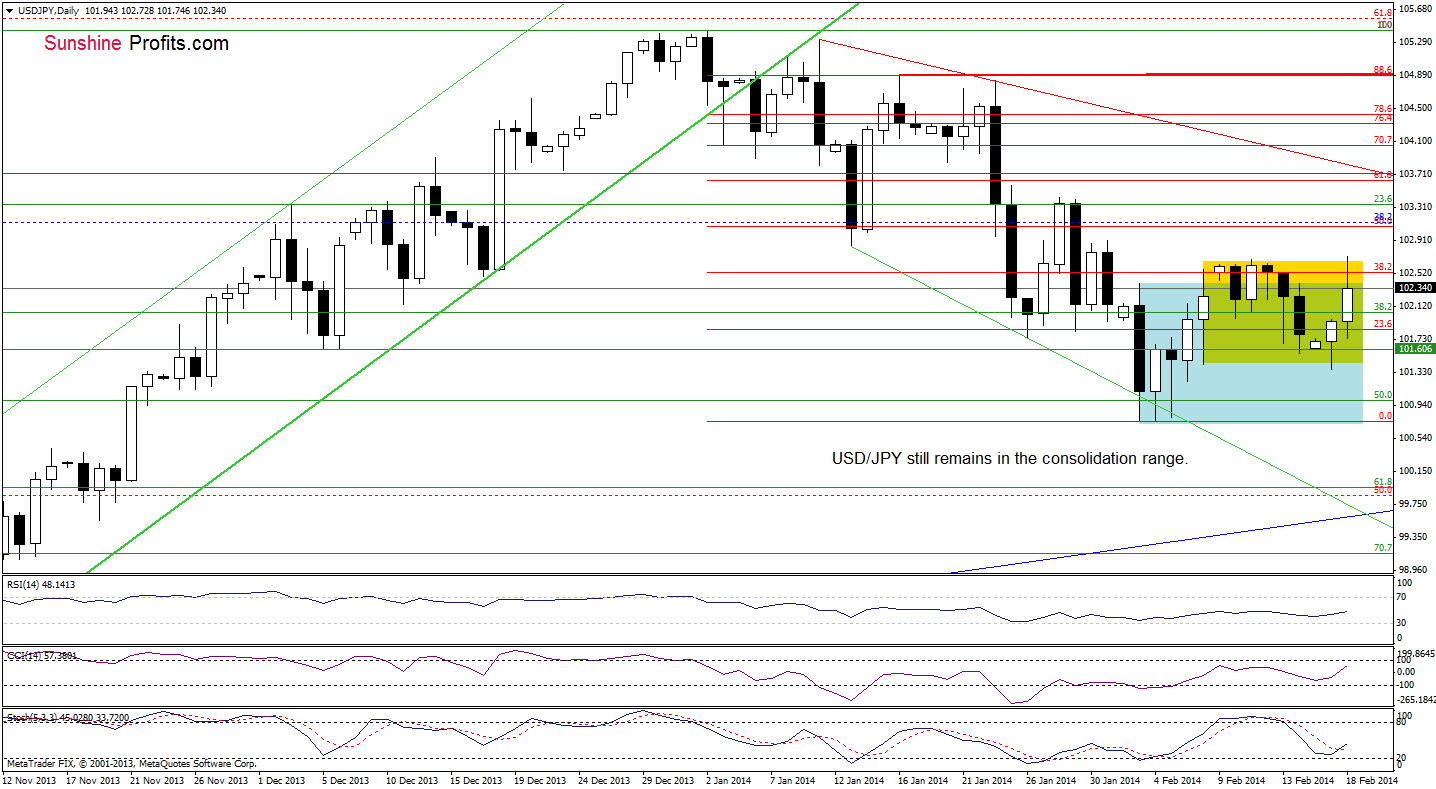
Yesterday, USD/JPY extended declines and slipped below last Friday low. Despite this drop, the pair rebounded quickly, which triggered further improvement earlier today. With this upswing, the exchange rate reached the upper border of the consolidation range and the 38.2% Fibonacci retracement level. If this resistance zone encourages sellers to act we may see another pullback (similarly to the situation that we saw in the previous week). However, if it is broken, the pair may extend increases and climb to the next Fibonacci retracement level. Please note that the indicators rebounded (the Stochastic Oscillator generated a buy signal) supporting buyers.
Very short-term outlook: mixed
Short-term outlook: mixed with bearish bias
MT outlook: bullish
LT outlook: bearish
Trading position (short-term): In our opinion, the situation is too unclear to go short or long at the moment. So, no positions are justified from the risk/reward perspective. We will keep you informed should anything change, or should we see a confirmation/invalidation of the above.
USD/CAD
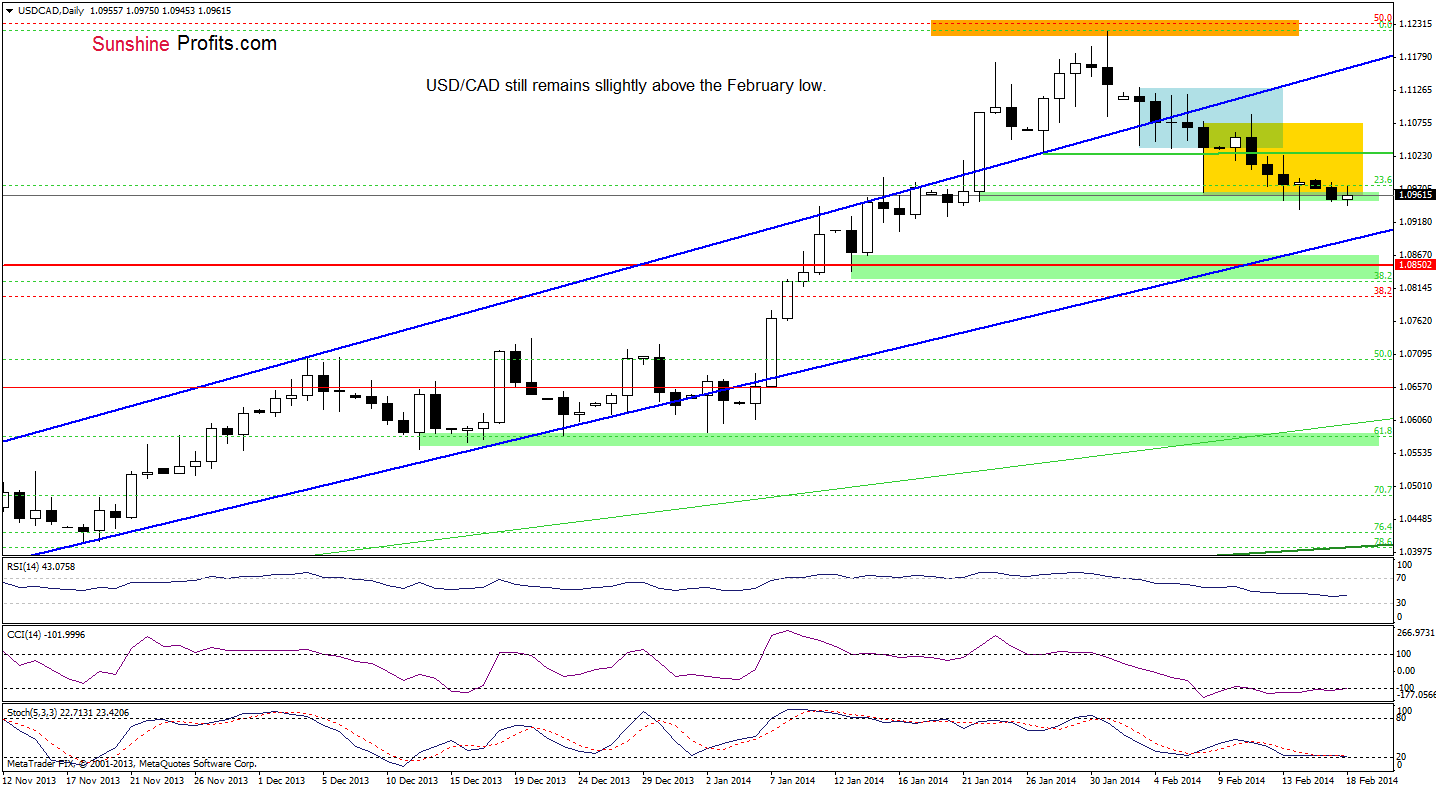
Looking at the above chart, we see that the situation hasn’t changed much as USD/CAD remains in a narrow range slightly above the Jan.22 low. Therefore, what we wrote in our last Forex Trading Alert remains up-to-date also today.
(…) at this point, we should consider two scenarios. If this support level encourages buyers to act, we will likely see another comeback to the consolidation range (marked with blue). However, if it is broken and the exchange rate closes the day below the Jan.22 low, it will likely trigger a decline to 1.0904 (the Jan. 16 low) or even to a strong support zone created by the 38.2% Fibonacci retracement level (based on the entire Sept.-Jan. rally), the lower border of the trend channel, the Jan. 13 low and the 2010 high.
Very short-term outlook: mixed
Short-term outlook: mixed
MT outlook: bullish
LT outlook: bearish
Trading position (short-term): From today’s point of view, even if the pair extended losses, the lower border of the trend channel will likely stop further deterioration. Therefore, in our opinion opening short positions is not justified from the risk/reward perspective. We will keep you informed should anything change, or should we see a confirmation/invalidation of the above.
USD/CHF
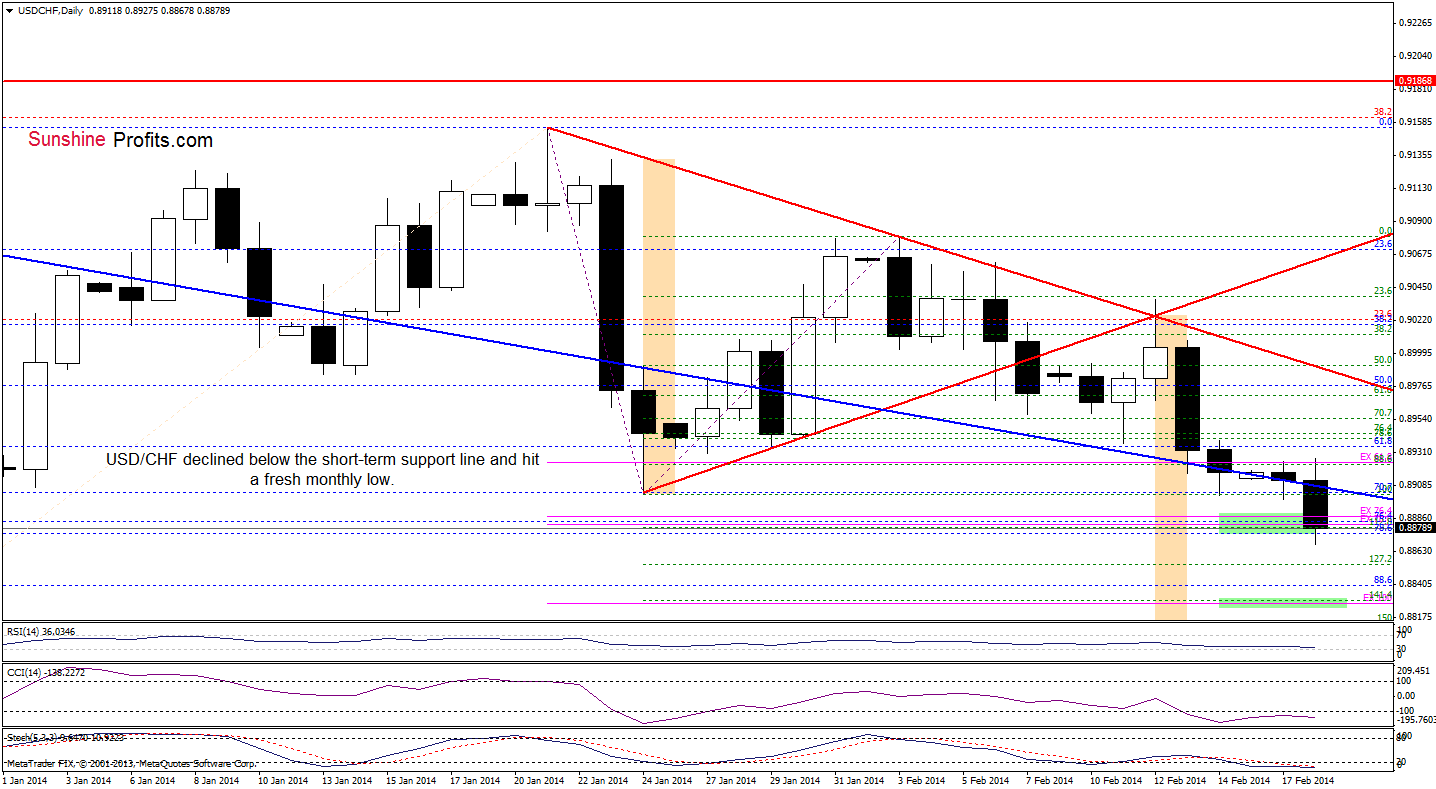
Quoting our last Forex Trading Alert:
(…) if the short-term declining support line is successfully broken, we will likely see a drop (…) even to a support zone created by the 76.4%, 78.6% Fibonacci retracement levels (based on the Dec.-Jan. rally) and the 76.4%, 78.6% Fibonacci projections (marked with a green rectangle on the above chart).
Looking at the above chart, we see that USD/CHF extended declines and reached its downside target earlier today. If this support encourages buyers to act, we may see a corrective upswing to the short-term declining support line. At this point, it’s worth mentioning that the current position of the indicators and a positive divergence between the CCI and the exchange rate support a pro growth scenario. Nevertheless, we should still keep in mind that the short-term declining support line is broken and serves as resistance at this moment. Taking this fact into account, we may see further deterioration if the pair declines below the support zone. In this case, the next downside target for the sellers would be around 0.8828, where the 100% Fibonacci projection (based on the Jan.21, Feb.3 highs and Jan.24 low) is.
Very short-term outlook: bearish
Short-term outlook: mixed
MT outlook: bearish
LT outlook: bearish
Trading position (short-term): In our opinion, the situation is too unclear to go short or long as the pair reached its downside target. So, no positions are justified from the risk/reward perspective. We will keep you informed should anything change, or should we see a confirmation/invalidation of the above.
AUD/USD
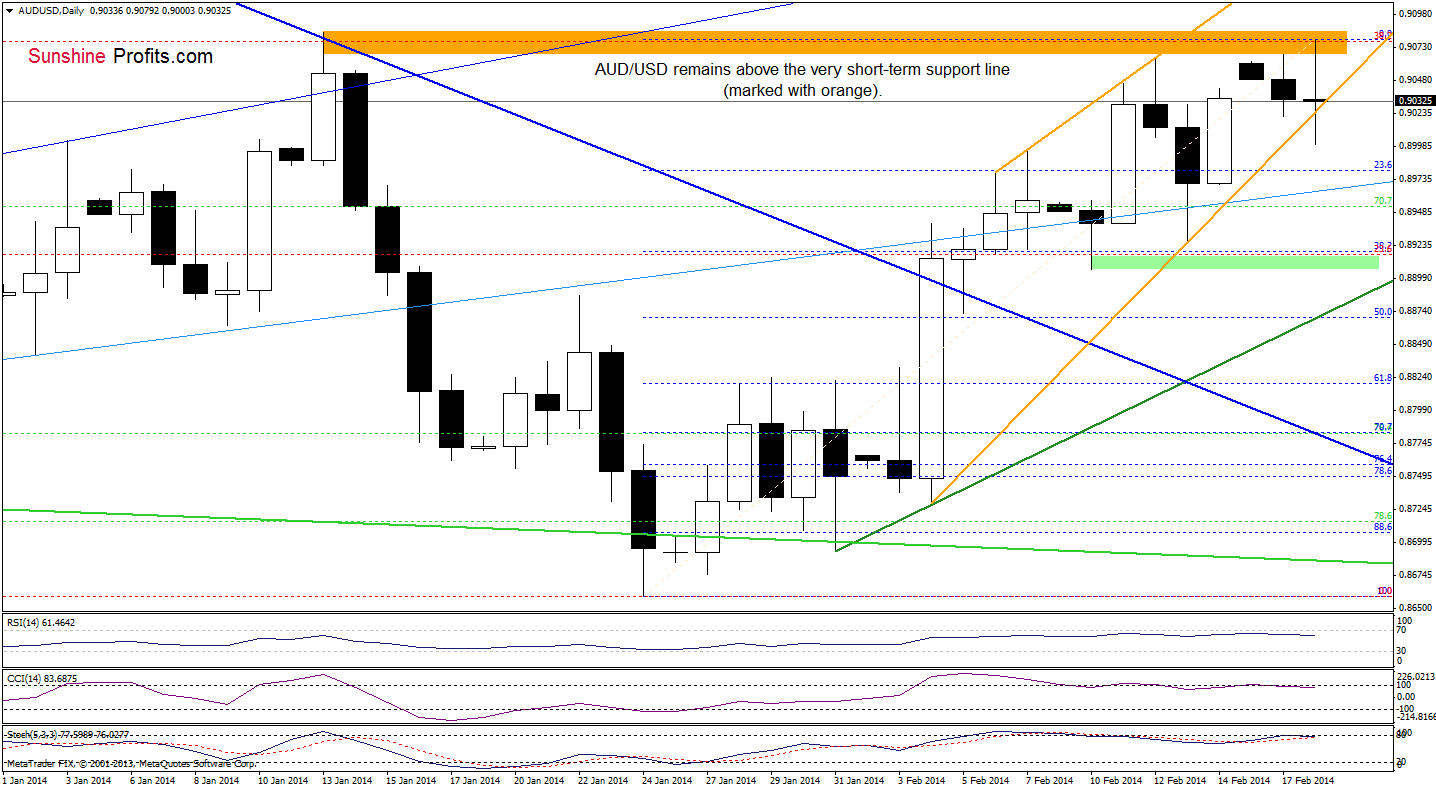
Looking at the above chart, we see that AUD/USD moved higher once again and hit a fresh monthly high earlier today. With this upswing, the pair reached the 38.2% Fibonacci retracement level, which triggered a pullback to the very short-term support line (marked with orange). From this perspective, we should consider two scenarios. If the buyers do not give up, we may see another attempt to break above a resistance zone created by the 38.2% Fibonacci retracement and the January high. However, if the pair drops below the orange support line, we will likely see further deterioration and the initial downside target will be a support zone created by the Feb. 10 and Feb.13 lows and the 38.2% Fibonacci retracement level based on the recent rally. Please note that this scenario is reinforced by the current position of the indicators, which suggests that a bigger pullback is just around the corner.
Very short-term outlook: mixed
Short-term outlook: mixed with bullish bias
MT outlook: bearish
LT outlook: bearish
Trading position (short-term): In our opinion, if the pair drops below the February 10 low, we might consider opening short positions. However, as long as AUD/USD remains between above this level and the 38.2% Fibonacci retracement level, no positions are justified from the risk/reward perspective. We will keep you informed should anything change, or should we see a confirmation/invalidation of the above.
Thank you.
Nadia Simmons
Forex & Oil Trading Strategist
Forex Trading Alerts
Oil Investment Updates
Oil Trading Alerts

