
The U.S. dollar moved lower against major currencies after weaker-than-expected U.S. retail sales numbers for January and an increase in the number of new unemployment claims. The Commerce Department said that U.S. retail sales fell 0.4% last month (missing expectations for a 0.3% increase), while the Labor Department said in its report that initial claims for jobless benefits rose by 8,000 to 339,000 from the previous week’s total of 331,000 (analysts had expected jobless claims to fall by 1,000). What impact did it have on major currency pairs? If you want to know our take on this question, we invite you to read our today's Forex Trading Alert.
In our opinion the following forex trading positions are justified - summary:
EUR/USD
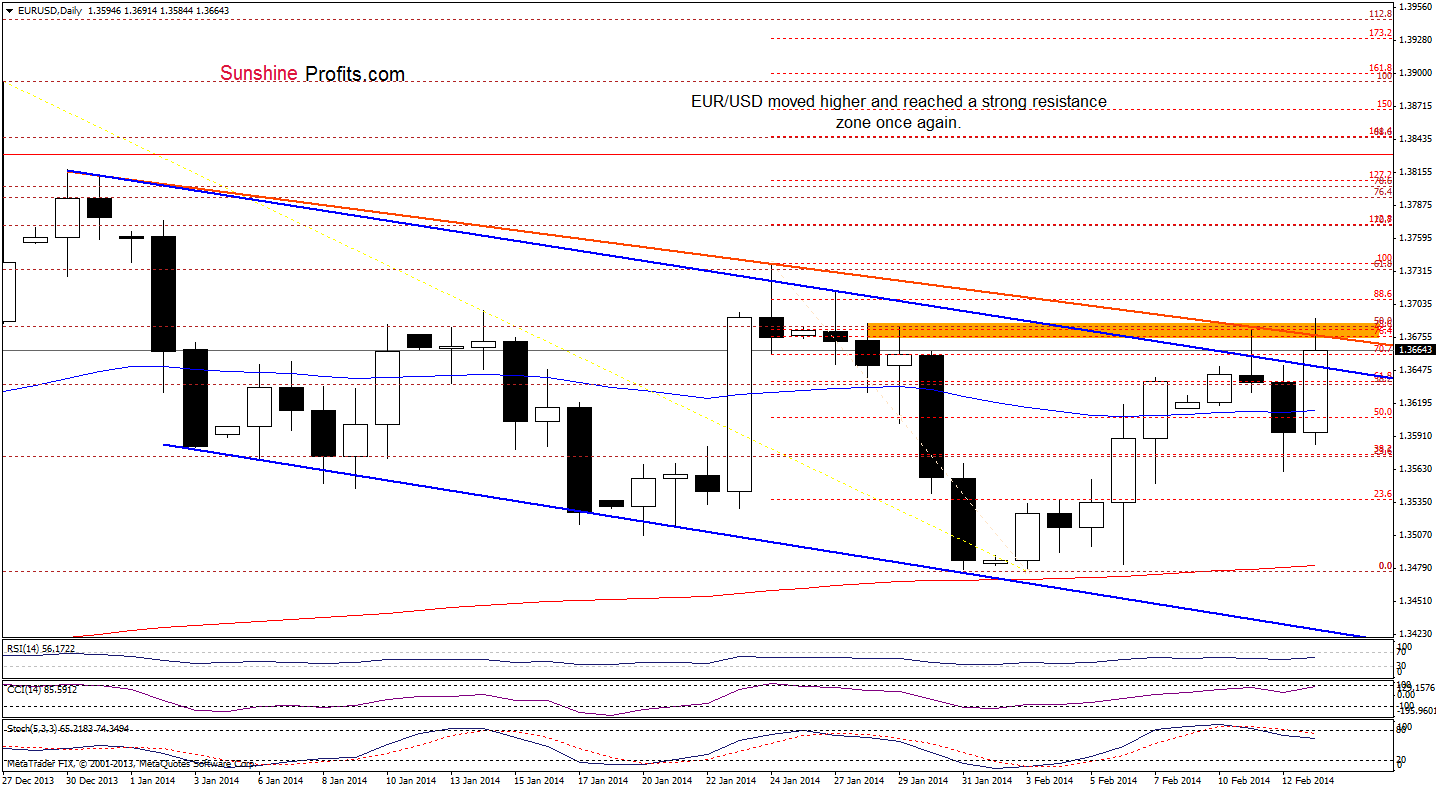
Looking at the above chart, we see that EUR/USD rebounded sharply and came back above the upper line of the declining trend channel earlier today. However, with this upswing, the pair reached a strong resistance zone created by the Jan. 28 high, the 76.4% and 78.6% Fibonacci retracement levels (based on the recent decline) and the 50% Fibonacci retracement based on the entire Dec.-Feb. decline. Additionally, EUR/USD broke (but very temporarily) above the declining resistance line based on the Dec.30 and Jan.24 highs (marked with orange), which reinforces the resistance zone at the moment. Taking the above into account and combining with sell signals generated by the CCI and Stochastic Oscillator (please note that there is a negative divergence between the indicator and the exchange rate, which is a bearish signal), it seems that we may see another attempt to move lower in the coming day (or days). Nevertheless, if the resistance zone is broken, we will likely see further improvement and the next upside target will be the Jan.24 high.
Very short-term outlook: bullish
Short-term outlook: mixed
MT outlook: mixed
LT outlook: bearish
Trading position (short-term): In our opinion no positions are justified from the risk/reward perspective. We will keep you informed should anything change, or should we see a confirmation/invalidation of the above.
GBP/USD
Quoting our last Forex Trading Alert:
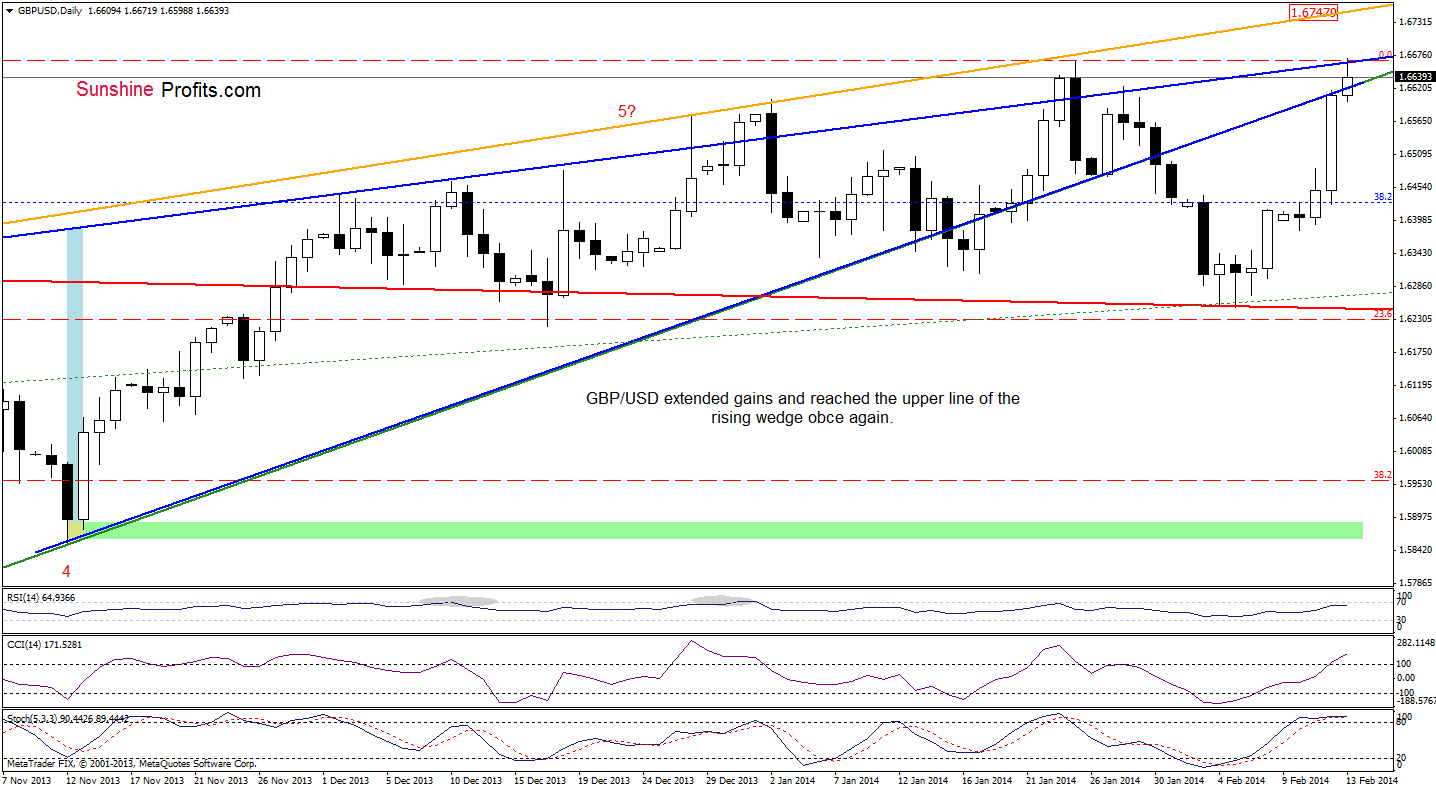
(…) the buyers (…) managed to push the pair to a resistance zone created by the 76.4% and 78.6% Fibonacci retracement levels (based on the recent decline). If it is broken, we will likely see further improvement and the upside target will be the previously-broken lower border of the rising wedge.
As you see on the above chart, GBP/USD extended gains and hit a fresh monthly high. With this upswing, the pair, not only broke above the lower border of the rising wedge, but also reached the upper line of this formation. If this strong resistance line encourages sellers to act, we will likely see a pause or a pullback in the nearest future. At this point, it’s worth noting that this scenario is reinforced by the current position of the indicators (the CCI and Stochastic Oscillator are overbought, while the RSI reached its highest level since Jan.24). Nevertheless, if the buyers do not give up and manage to push the exchange rate higher, we may see an increase to the rising resistance line (marked with orange) based on the Oct.1 and Dec.27 highs, which will likely stop further improvement.
Very short-term outlook: bullish
Short-term outlook: mixed with bullish bias
MT outlook: mixed
LT outlook: mixed
Trading position (short-term): In our opinion no positions are justified from the risk/reward perspective. We will keep you informed should anything change, or should we see a confirmation/invalidation of the above.
USD/JPY
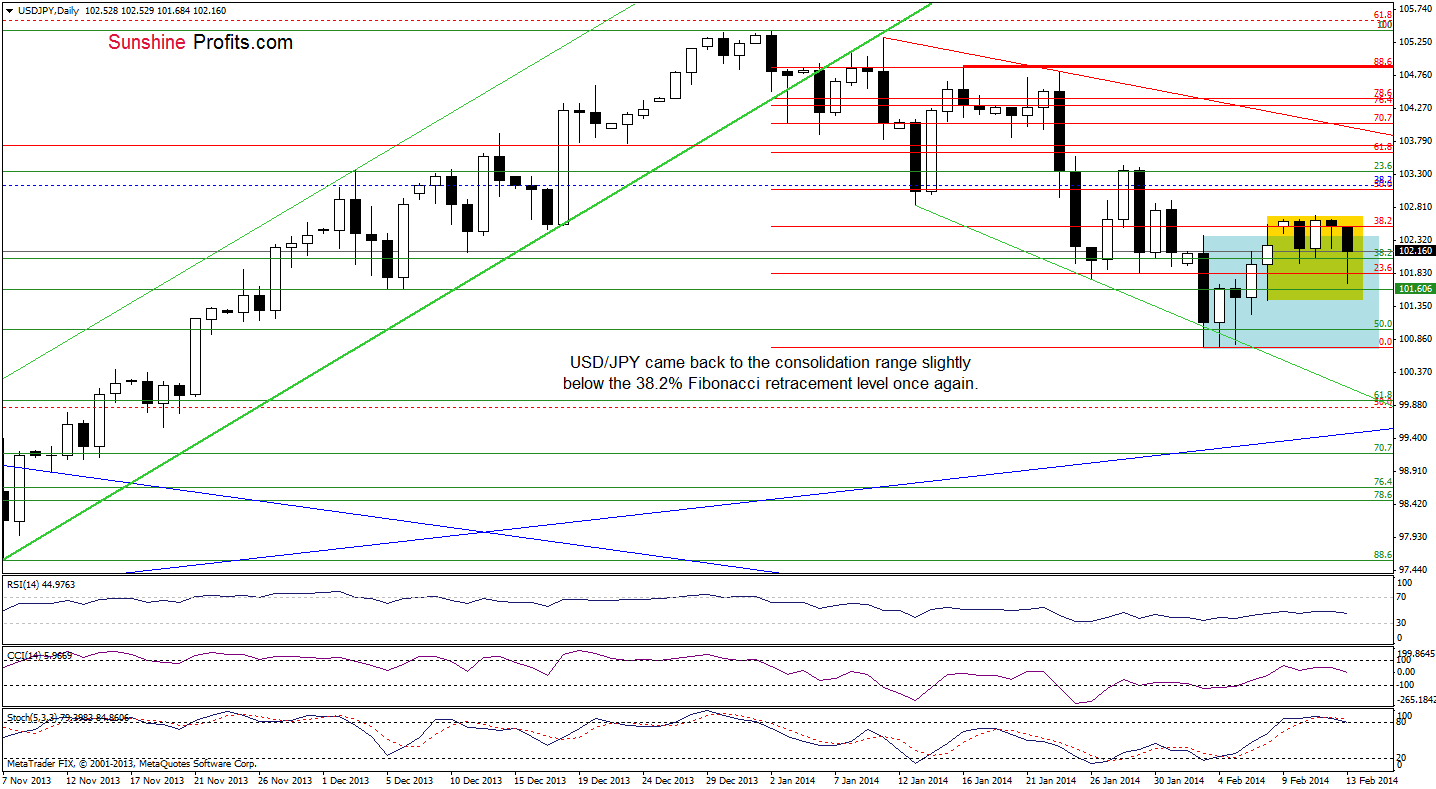
On the above chart, we see that the situation has deteriorated slightly as USD/JPY extended declines and approached Friday low. Despite this drop, the pair still remains in a narrow range (marked with yellow) slightly below the 38.2% Fibonacci retracement level based on the recent decline. When we take a closer look at the position of the indicators, we see that the Stochastic Oscillator generated a sell signal, which suggests that we may see another attempt to hit the first downside target around 101.43 (Friday low).
Very short-term outlook: mixed
Short-term outlook: mixed with bearish bias
MT outlook: bullish
LT outlook: bearish
Trading position (short-term): In our opinion no positions are justified from the risk/reward perspective. We will keep you informed should anything change, or should we see a confirmation/invalidation of the above.
USD/CAD
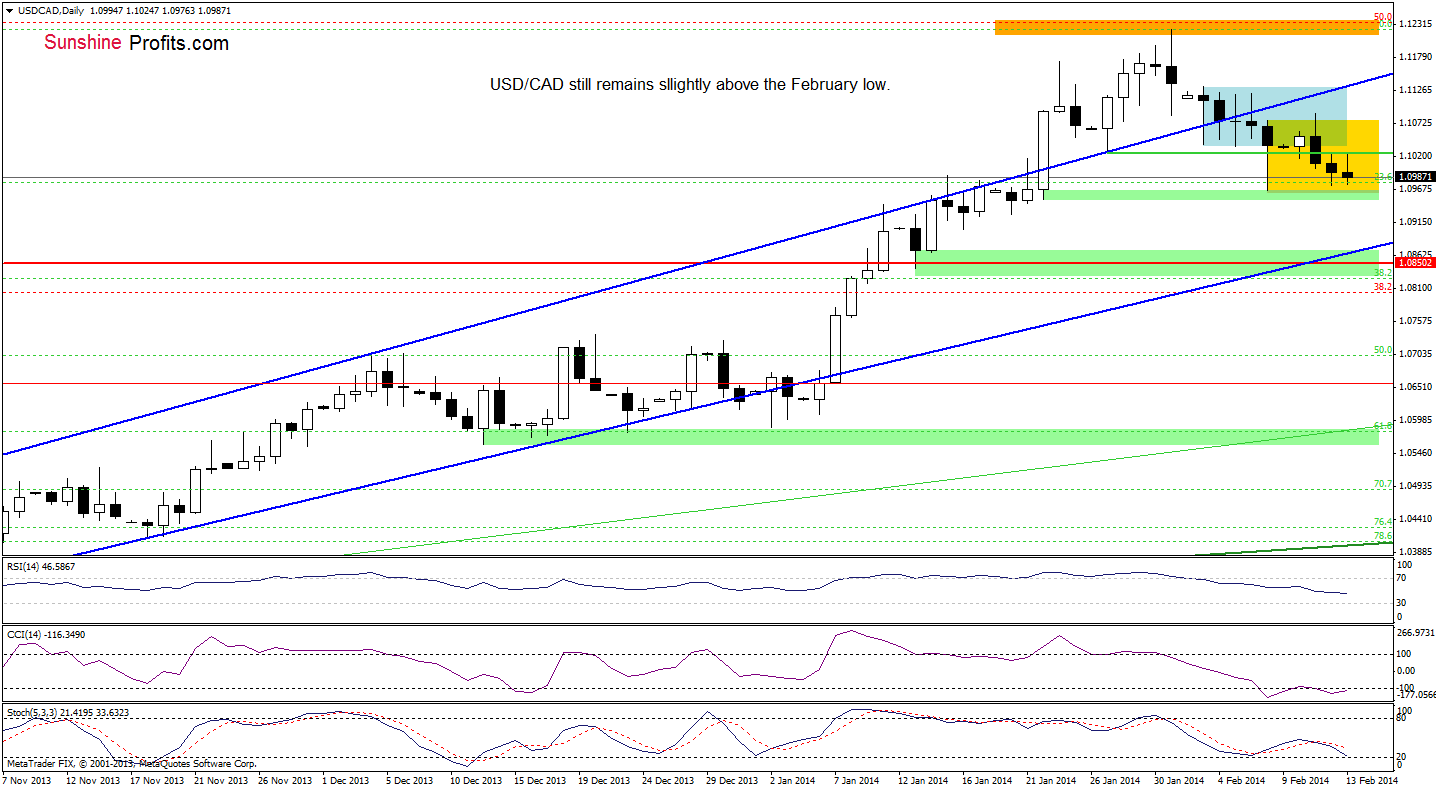
Looking at the above chart, we see that the situation hasn’t changed much as USD/CAD remains in a consolidation range (marked with yellow) slightly above the February low. Taking this fact into account, what we wrote in our last Forex Trading Alert remains up-to-date.
(…) at this point, we should consider two scenarios. If this support level encourages buyers to act, we will likely see another comeback to the consolidation range (marked with blue). However, if it is broken and the exchange rate closes the day below the Jan.22 low, it will likely trigger a decline to 1.0904 (the Jan. 16 low) or even to a strong support zone created by the 38.2% Fibonacci retracement level (based on the entire Sept.-Jan. rally), the lower border of the trend channel, the Jan. 13 low and the 2010 high.
Very short-term outlook: mixed
Short-term outlook: mixed
MT outlook: bullish
LT outlook: bearish
Trading position (short-term): In our opinion no positions are justified from the risk/reward perspective. We will keep you informed should anything change, or should we see a confirmation/invalidation of the above.
USD/CHF
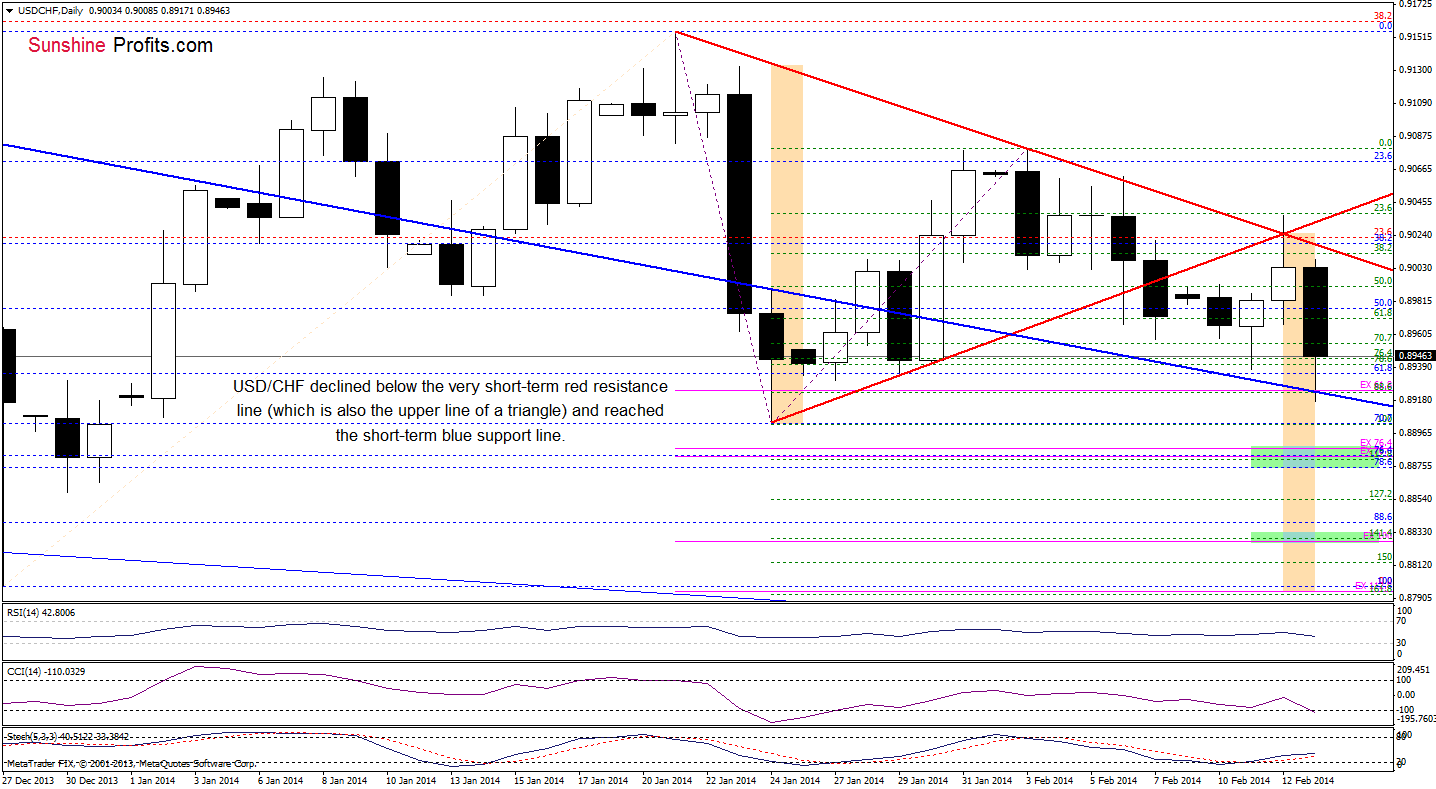
Looking at the above chart, we see that USD/CHF declined sharply after a breakdown below the declining resistance line (based on the Jan.21 and Feb.3 highs) and the support line based on the Jan.24 and Jan.29 lows. As you see on the daily chart, these two lines create a triangle. According to theory, a drop below the lower border of the triangle may trigger further deterioration and the downside target for the pattern would be around the December low. However, the short-term declining support line (marked with blue) may stop the sellers in the near future - especially when we factor in the 61.8% Fibonacci projection (based on the Jan.21, Feb.3 highs and Jan.24 low marked with pink) and positive divergence between the Stochastic Oscillator and the exchange rate. Nevertheless, we should keep in mind that if the short-term declining support line is successfully broken, we will likely see a drop to the January low or even to a support zone created by the 76.4%, 78.6% Fibonacci retracement levels (based on the Dec.-Jan. rally) and the 76.4%, 78.6% Fibonacci projections (marked with a green rectangle on the above chart).
Very short-term outlook: bearish
Short-term outlook: mixed
MT outlook: bearish
LT outlook: bearish
Trading position (short-term): In our opinion no positions are justified from the risk/reward perspective. We will keep you informed should anything change, or should we see a confirmation/invalidation of the above.
AUD/USD
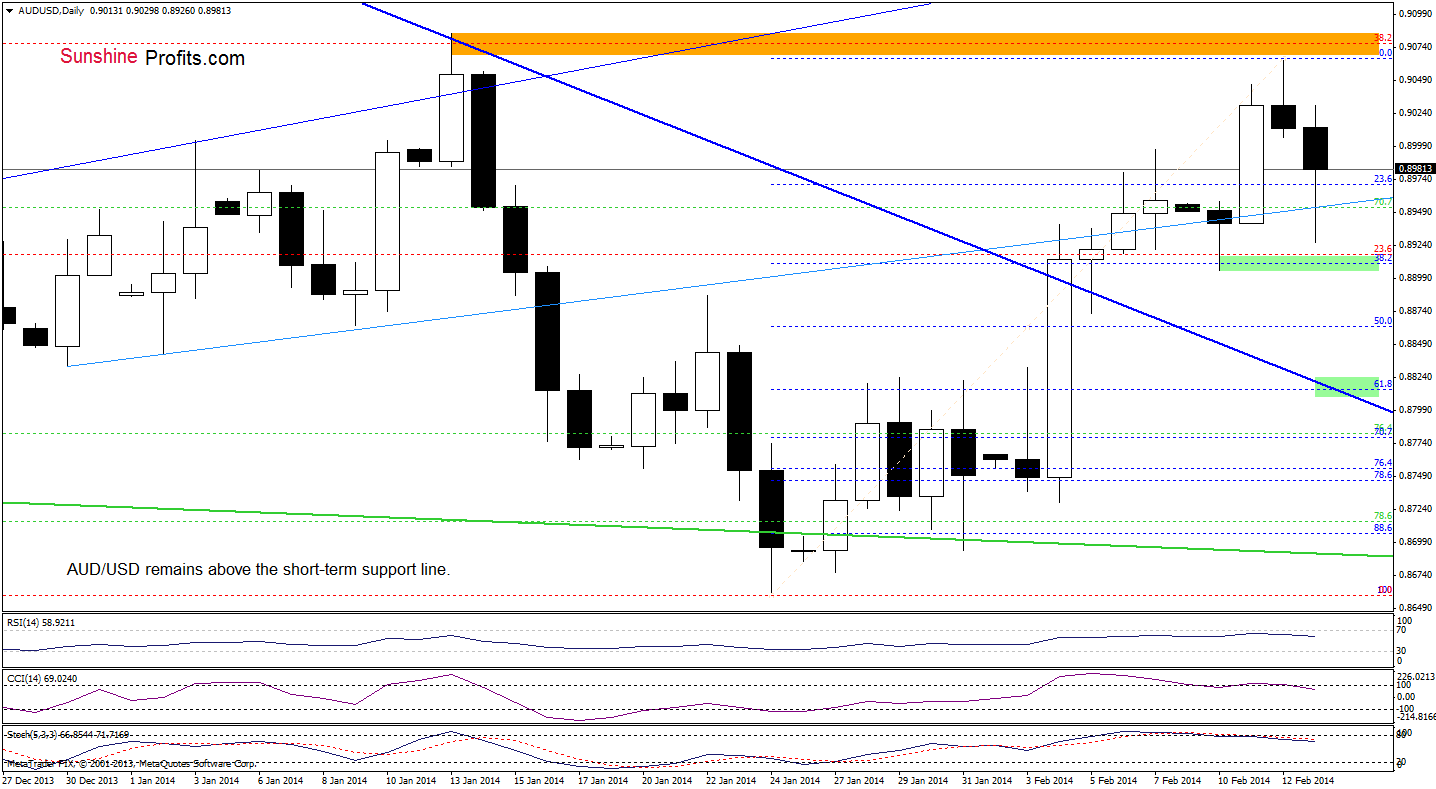
Quoting our last Forex Trading Alert:
(…) AUD/USD (…) approached the 38.2% Fibonacci retracement level based on the entire Oct.-Jan. decline. Taking into account the proximity to this resistance level and combining it with the current position of the indicators (…), it seems that a correction is just around the corner.
As you see on the above chart, the pair gave up the gains and reversed earlier today. With this downswing, the exchange rate declined temporarily below the very short-term support line and approached the Feb.10 low. However, the buyers didn’t give up and AUD/USD rebounded. Despite this fact, the pair still remains below the 38.2% Fibonacci retracement level and the CCI generated a sell signal (a sell signal generated by the Stochastic Oscillator remains in place), which supports the bearish case. Nevertheless, as long as the exchange rate remains above the short-term blue rising line, the space for declines seems limited.
Very short-term outlook: mixed
Short-term outlook: mixed with bullish bias
MT outlook: bearish
LT outlook: bearish
Trading position (short-term): In our opinion no positions are justified from the risk/reward perspective. We will keep you informed should anything change, or should we see a confirmation/invalidation of the above.
Thank you.
Nadia Simmons
Forex & Oil Trading Strategist
Forex Trading Alerts
Oil Investment Updates
Oil Trading Alerts

